

Note: This report includes forecasting data that is based on baseline historical data.
Executive summary
The retail sales of snack are predominantly led by Western European countries. The top five snack markets in European Uniton (EU) included the United Kingdom (UK), German, France, Italy and Spain, which collectively accounted for 66.3% of the total snack retail value sales in EU in 2021.
The snack market in EU grew at a compound annual growth rate (CAGR) of 3.1% between 2016 and 2021 and was valued at US$138.2 billion in 2021. The snack market is expected to expand much faster at a CAGR of 4.6%, reaching nearly US$173.2 billion in total retail sales by 2026.
The UK became the largest snack market in EU, with total retail sales of US$28.2 billion in 2021. This market grew at a CAGR of 2.7% between 2016 and 2021.
Germany snack market saw growth at a CAGR of 3.4% during the 2016-2021 period, reaching total retail sales of US$21.2 billion in 2021. Popcorn, and nuts, seeds and trail mixes grow the fastest at a CAGR of 7.9% and 7.8% respectively between 2016 and 2021.
France snack market saw growth at a CAGR of 2.3% during the 2016-2021 period, reaching total retail sales of US$17.4 billion in 2021.
In Italy, between 2016 and 2021, the retail sales of snacks increased by a CAGR of 1.4% and was valued at US$13.8 billion in 2021.
The Spain snacks sector grew at a CAGR of 4.9% during the 2016-2021 period, reaching total retail sales of US$10.5 billion in 2021.
Market overview
The retail sales of snack are predominantly led by Western European countries. The top five confectionery markets in EU included UK, German, France, Italy and Spain, which collectively accounted for 66.3% of the total snack retail value sales in EU in 2021.
The snack market in EU grew at a Compound Annual Growth Rate (CAGR) of 3.1% between 2016 and 2021 and was valued at US$138.2 billion in 2021. The snack market is expected to expand much faster at a CAGR of 4.6%, reaching nearly US$173.2 billion in total retail sales by 2026.
| Country | 2016 | 2021 | CAGR % 2016-2021 | 2022 | 2026 | CAGR % 2021-2026 |
|---|---|---|---|---|---|---|
| European Union (including United Kingdom) Total | 118,712.4 | 138,221.1 | 3.1 | 146,640.1 | 173,200.7 | 4.6 |
| United Kingdom | 24,678.0 | 28,225.9 | 2.7 | 30,516.2 | 35,340.1 | 4.6 |
| Germany | 21,010.2 | 24,600.1 | 3.2 | 25,555.8 | 29,074.5 | 3.4 |
| France | 15,560.5 | 17,403.5 | 2.3 | 18,180.0 | 21,242.7 | 4.1 |
| Italy | 12,846.1 | 13,789.9 | 1.4 | 14,742.9 | 17,552.5 | 4.9 |
| Spain | 8,268.4 | 10,486.6 | 4.9 | 11,048.5 | 13,663.8 | 5.4 |
| Poland | 4,707.6 | 6,159.1 | 5.5 | 6,846.6 | 9,482.1 | 9.0 |
| Netherlands | 4,476.4 | 5,040.7 | 2.4 | 5,298.6 | 6,131.5 | 4.0 |
| Sweden | 3,370.9 | 4,048.6 | 3.7 | 4,150.7 | 4,838.3 | 3.6 |
| Denmark | 2,575.7 | 3,160.4 | 4.2 | 3,260.9 | 3,650.2 | 2.9 |
| Belgium | 2,851.7 | 2,996.8 | 1.0 | 3,139.4 | 3,591.1 | 3.7 |
|
Source: Euromonitor International, 2022 *CAGR: Compound annual growth rate Historic data: 2016 to 2021 Forecast data: 2022 to 2026 |
||||||
The United Kingdom
Market overview
The UK became the largest snack market in EU, with total retail sales of US$28.2 billion in 2021. This market grew at a CAGR of 2.7% between 2016 and 2021. While meat snack was the fastest growing subsector, which expanded by a CAGR of 9.8% from 2016 to 2021, with total retail sales of US$372.1 million in 2021. Chocolate confectionery was the largest subcategory (US$9.3 billion in 2021) in terms of total retail value sales.
In 2022, retail volume sales of snacks are set to decline, due to the upcoming implementation of the HFSS (high in fat, salt or sugar) regulation, which restricts the in-store and online presence of food products that are high in fat, sugar and salt in retailers above 2,000 sqaure feet (185 square metres), effective from October 2022 (Eromonitor 2022).
| Category | 2016 | 2017 | 2018 | 2019 | 2020 | 2021 |
|---|---|---|---|---|---|---|
| Snacks Total | 24,678.0 | 25,112.7 | 25,778.3 | 26,449.9 | 27,540.1 | 28,225.9 |
| Confectionery | 11,332.2 | 11,433.8 | 11,630.8 | 11,804.4 | 11,742.3 | 11,987.5 |
| Chocolate Confectionery | 8,471.7 | 8,588.8 | 8,777.6 | 8,935.8 | 8,998.8 | 9,262.5 |
| Gum | 516.0 | 505.4 | 491.8 | 489.4 | 404.8 | 383.2 |
| Sugar Confectionery | 2,344.4 | 2,339.7 | 2,361.3 | 2,379.2 | 2,338.6 | 2,341.7 |
| Savoury Snacks | 6,964.0 | 7,110.7 | 7,266.9 | 7,471.0 | 8,273.1 | 8,537.8 |
| Nuts, Seeds and Trail Mixes | 754.0 | 821.2 | 906.9 | 979.5 | 1,135.4 | 1,190.7 |
| Salty Snacks | 4,651.3 | 4,696.2 | 4,806.5 | 4,926.3 | 5,435.8 | 5,553.8 |
| Savoury Biscuits | 972.0 | 960.7 | 893.6 | 884.6 | 951.5 | 970.6 |
| Popcorn | 158.3 | 178.1 | 186.8 | 192.0 | 200.3 | 206.7 |
| Pretzels | 96.7 | 98.2 | 100.2 | 104.6 | 116.4 | 119.7 |
| Meat Snacks | 232.7 | 250.1 | 262.5 | 270.4 | 313.2 | 372.1 |
| Seafood Snacks | 23.2 | 25.2 | 25.9 | 27.3 | 28.6 | 30.1 |
| Other Savoury Snacks | 75.9 | 81.1 | 84.5 | 86.3 | 91.9 | 94.2 |
| Sweet Biscuits, Snack Bars and Fruit Snacks | 4,076.7 | 4,195.7 | 4,351.0 | 4,493.1 | 4,607.2 | 4,621.9 |
| Fruit Snacks | 425.5 | 451.8 | 469.8 | 495.7 | 535.5 | 561.2 |
| Snack Bars | 922.5 | 1,033.5 | 1,134.2 | 1,225.8 | 1,186.9 | 1,238.7 |
| Sweet Biscuits | 2,728.7 | 2,710.4 | 2,747.0 | 2,771.6 | 2,884.9 | 2,822.0 |
| Source: Euromonitor International, 2022 | ||||||
| Category | Annual growth % 2020-2021 | CAGR* % 2016-2021 | Total growth % 2016-2021 |
|---|---|---|---|
| Snacks Total | 2.5 | 2.7 | 14.4 |
| Confectionery | 2.1 | 1.1 | 5.8 |
| Chocolate Confectionery | 2.9 | 1.8 | 9.3 |
| Gum | −5.3 | −5.8 | −25.7 |
| Sugar Confectionery | 0.1 | 0.0 | −0.1 |
| Savoury Snacks | 3.2 | 4.2 | 22.6 |
| Nuts, Seeds and Trail Mixes | 4.9 | 9.6 | 57.9 |
| Salty Snacks | 2.2 | 3.6 | 19.4 |
| Savoury Biscuits | 2.0 | 0.0 | −0.1 |
| Popcorn | 3.2 | 5.5 | 30.6 |
| Pretzels | 2.8 | 4.4 | 23.8 |
| Meat Snacks | 18.8 | 9.8 | 59.9 |
| Seafood Snacks | 5.2 | 5.3 | 29.7 |
| Other Savoury Snacks | 2.5 | 4.4 | 24.1 |
| Sweet Biscuits, Snack Bars and Fruit Snacks | 0.3 | 2.5 | 13.4 |
| Fruit Snacks | 4.8 | 5.7 | 31.9 |
| Snack Bars | 4.4 | 6.1 | 34.3 |
| Sweet Biscuits | −2.2 | 0.7 | 3.4 |
|
Source: Euromonitor International, 2022 *CAGR: Compound annual growth rate |
|||
This growth trend will likely continue throughout the 2021-2026 period. The UK snack market is forecast to grow at a CAGR of 4.6% and be valued at US$35.3 billion by 2026. Nuts, seeds and trail mixes is forecast to surpass meat snacks to grow the fastest at a CAGR of 9.9% between 2021 and 2026, reaching US$1.9 billion in 2026.
| Category | 2022 | 2023 | 2024 | 2025 | 2026 |
|---|---|---|---|---|---|
| Snacks Total | 30,516.2 | 31,235.3 | 32,427.4 | 33,821.7 | 35,340.1 |
| Confectionery | 12,808.7 | 13,032.7 | 13,423.9 | 13,892.4 | 14,393.2 |
| Chocolate Confectionery | 9,994.0 | 10,128.3 | 10,431.2 | 10,806.1 | 11,216.6 |
| Gum | 404.3 | 435.9 | 460.1 | 477.5 | 483.2 |
| Sugar Confectionery | 2,410.4 | 2,468.5 | 2,532.5 | 2,608.8 | 2,693.4 |
| Savoury Snacks | 9,376.3 | 9,617.8 | 10,039.9 | 10,518.8 | 11,035.2 |
| Nuts, Seeds and Trail Mixes | 1,327.5 | 1,466.9 | 1,602.0 | 1,748.9 | 1,908.4 |
| Salty Snacks | 6,053.3 | 6,144.1 | 6,382.4 | 6,654.6 | 6,947.1 |
| Savoury Biscuits | 1,086.3 | 1,069.7 | 1,079.5 | 1,089.1 | 1,099.9 |
| Popcorn | 230.9 | 235.9 | 245.9 | 257.9 | 270.3 |
| Pretzels | 135.1 | 137.1 | 143.5 | 149.8 | 156.1 |
| Meat Snacks | 409.1 | 428.6 | 447.7 | 474.5 | 503.7 |
| Seafood Snacks | 32.2 | 32.6 | 34.1 | 35.7 | 37.3 |
| Other Savoury Snacks | 101.9 | 103.0 | 104.9 | 108.5 | 112.3 |
| Sweet Biscuits, Snack Bars and Fruit Snacks | 5,039.2 | 5,138.1 | 5,346.2 | 5,578.8 | 5,831.9 |
| Fruit Snacks | 599.1 | 647.9 | 687.2 | 723.2 | 757.5 |
| Snack Bars | 1,348.0 | 1,359.3 | 1,413.4 | 1,484.5 | 1,573.8 |
| Sweet Biscuits | 3,092.1 | 3,130.8 | 3,245.5 | 3,371.1 | 3,500.6 |
| Source: Euromonitor International, 2022 | |||||
| Category | Annual growth % 2021-2022 | CAGR* % 2021-2026 | Total growth % 2021-2026 |
|---|---|---|---|
| Snacks Total | 8.1 | 4.6 | 25.2 |
| Confectionery | 6.9 | 3.7 | 20.1 |
| Chocolate Confectionery | 7.9 | 3.9 | 21.1 |
| Gum | 5.5 | 4.7 | 26.1 |
| Sugar Confectionery | 2.9 | 2.8 | 15.0 |
| Savoury Snacks | 9.8 | 5.3 | 29.3 |
| Nuts, Seeds and Trail Mixes | 11.5 | 9.9 | 60.3 |
| Salty Snacks | 9.0 | 4.6 | 25.1 |
| Savoury Biscuits | 11.9 | 2.5 | 13.3 |
| Popcorn | 11.7 | 5.5 | 30.8 |
| Pretzels | 12.9 | 5.5 | 30.4 |
| Meat Snacks | 9.9 | 6.2 | 35.4 |
| Seafood Snacks | 7.0 | 4.4 | 23.9 |
| Other Savoury Snacks | 8.2 | 3.6 | 19.2 |
| Sweet Biscuits, Snack Bars and Fruit Snacks | 9.0 | 4.8 | 26.2 |
| Fruit Snacks | 6.8 | 6.2 | 35.0 |
| Snack Bars | 8.8 | 4.9 | 27.1 |
| Sweet Biscuits | 9.6 | 4.4 | 24.0 |
|
Source: Euromonitor International, 2022 *CAGR: Compound annual growth rate |
|||
In terms of volume, meat snacks, and nuts, seeds and trail mixes lead the CAGR growth between 2016 and 2021, representing 7.9% and 6.0% respectively. Among gum, sugar confectionery, savoury biscuit and sweet biscuit whose CAGR growth decreased from 2016 to 2021, gum decreased the most at a CAGR of −5.3%.
| Category | 2016 | 2017 | 2018 | 2019 | 2020 | 2021 |
|---|---|---|---|---|---|---|
| Snacks Total | 1,863.6 | 1,862.5 | 1,864.0 | 1,875.9 | 1,958.1 | 1,921.6 |
| Confectionery | 713.2 | 715.0 | 718.7 | 723.4 | 720.5 | 719.1 |
| Chocolate Confectionery | 474.4 | 476.4 | 479.9 | 483.9 | 484.5 | 487.5 |
| Gum | 22.8 | 22.3 | 21.8 | 21.7 | 18.2 | 17.4 |
| Sugar Confectionery | 216.0 | 216.3 | 217.0 | 217.8 | 217.8 | 214.2 |
| Savoury Snacks | 599.3 | 599.1 | 593.8 | 600.1 | 661.8 | 647.1 |
| Nuts, Seeds and Trail Mixes | 49.0 | 51.0 | 53.8 | 56.6 | 66.1 | 65.6 |
| Salty Snacks | 337.5 | 335.6 | 338.6 | 343.8 | 380.1 | 368.3 |
| Savoury Biscuits | 175.6 | 173.2 | 160.9 | 158.5 | 171.0 | 168.0 |
| Popcorn | 8.8 | 9.6 | 9.8 | 10.0 | 10.5 | 10.3 |
| Pretzels | 9.0 | 9.1 | 9.2 | 9.2 | 10.4 | 10.1 |
| Meat Snacks | 7.6 | 8.0 | 8.4 | 8.6 | 9.7 | 11.1 |
| Seafood Snacks | 3.4 | 3.6 | 3.7 | 3.8 | 4.1 | 4.2 |
| Other Savoury Snacks | 8.6 | 9.0 | 9.4 | 9.6 | 9.9 | 9.6 |
| Sweet Biscuits,Snack Bars and Fruit Snacks | 551.1 | 548.4 | 551.5 | 552.4 | 575.8 | 555.4 |
| Fruit Snacks | 21.4 | 21.9 | 22.5 | 23.7 | 25.7 | 26.5 |
| Snack Bars | 47.6 | 50.8 | 54.1 | 56.5 | 55.2 | 55.9 |
| Sweet Biscuits | 482.0 | 475.7 | 474.8 | 472.2 | 494.9 | 473.0 |
| Source: Euromonitor International, 2022 | ||||||
| Category | Annual growth % 2020-2021 | CAGR* % 2016-2021 | Total growth % 2016-2021 |
|---|---|---|---|
| Snacks Total | −1.9 | 0.6 | 3.1 |
| Confectionery | −0.2 | 0.2 | 0.8 |
| Chocolate Confectionery | 0.6 | 0.5 | 2.8 |
| Gum | −4.4 | −5.3 | −23.7 |
| Sugar Confectionery | −1.7 | −0.2 | −0.8 |
| Savoury Snacks | −2.2 | 1.5 | 8.0 |
| Nuts, Seeds and Trail Mixes | −0.8 | 6.0 | 33.9 |
| Salty Snacks | −3.1 | 1.8 | 9.1 |
| Savoury Biscuits | −1.8 | −0.9 | −4.3 |
| Popcorn | −1.9 | 3.2 | 17.0 |
| Pretzels | −2.9 | 2.3 | 12.2 |
| Meat Snacks | 14.4 | 7.9 | 46.1 |
| Seafood Snacks | 2.4 | 4.3 | 23.5 |
| Other Savoury Snacks | −3.0 | 2.2 | 11.6 |
| Sweet Biscuits, Snack Bars and Fruit Snacks | −3.5 | 0.2 | 0.8 |
| Fruit Snacks | 3.1 | 4.4 | 23.8 |
| Snack Bars | 1.3 | 3.3 | 17.4 |
| Sweet Biscuits | −4.4 | −0.4 | −1.9 |
|
Source: Euromonitor International, 2022 *CAGR: Compound annual growth rate |
|||
It is forecast that savory biscuits will have a growth at a CAGR of 3.3%, reaching 142.8 thousand tonnes between 2021 and 2026, followed by sweet biscuits at a CAGR of 2.0%, reaching 429.1 thousand tonnes between 2021 and 2026.
| Category | 2022 | 2023 | 2024 | 2025 | 2026 |
|---|---|---|---|---|---|
| Snacks Total | 1,891.4 | 1,802.1 | 1,783.0 | 1,783.0 | 1,793.5 |
| Confectionery | 710.4 | 678.4 | 669.4 | 669.3 | 673.9 |
| Chocolate Confectionery | 483.1 | 458.2 | 451.8 | 451.9 | 455.5 |
| Gum | 17.8 | 18.2 | 18.6 | 18.7 | 18.5 |
| Sugar Confectionery | 209.4 | 202.0 | 199.0 | 198.8 | 199.9 |
| Savoury Snacks | 635.8 | 606.2 | 602.0 | 603.0 | 607.3 |
| Nuts, Seeds and Trail Mixes | 67.4 | 69.5 | 72.3 | 75.8 | 79.9 |
| Salty Snacks | 359.8 | 340.7 | 338.1 | 338.6 | 340.7 |
| Savoury Biscuits | 164.1 | 153.3 | 148.9 | 145.5 | 142.8 |
| Popcorn | 10.0 | 9.6 | 9.5 | 9.6 | 9.6 |
| Pretzels | 9.9 | 9.4 | 9.5 | 9.5 | 9.6 |
| Meat Snacks | 11.1 | 10.9 | 11.0 | 11.3 | 11.7 |
| Seafood Snacks | 4.1 | 4.0 | 4.0 | 4.1 | 4.2 |
| Other Savoury Snacks | 9.4 | 8.9 | 8.7 | 8.7 | 8.8 |
| Sweet Biscuits, Snack Bars and Fruit Snacks | 545.2 | 517.5 | 511.6 | 510.7 | 512.3 |
| Fruit Snacks | 27.1 | 28.1 | 29.0 | 29.9 | 30.7 |
| Snack Bars | 55.0 | 51.8 | 51.4 | 51.8 | 52.7 |
| Sweet Biscuits | 463.1 | 437.6 | 431.2 | 429.1 | 429.0 |
| Source: Euromonitor International, 2022 | |||||
| Category | Annual growth % 2021-2022 | CAGR* % 2021-2026 | Total growth % 2021-2026 |
|---|---|---|---|
| Snacks Total | −1.6 | 1.4 | −6.7 |
| Confectionery | −1.2 | 1.3 | −6.3 |
| Chocolate Confectionery | −0.9 | 1.4 | −6.6 |
| Gum | 2.3 | −1.2 | 6.3 |
| Sugar Confectionery | −2.2 | 1.4 | −6.7 |
| Savoury Snacks | −1.7 | 1.3 | −6.2 |
| Nuts, Seeds and Trail Mixes | 2.7 | −3.9 | 21.8 |
| Salty Snacks | −2.3 | 1.6 | −7.5 |
| Savoury Biscuits | −2.3 | 3.3 | −15.0 |
| Popcorn | −2.9 | 1.4 | −6.8 |
| Pretzels | −2.0 | 1.0 | −5.0 |
| Meat Snacks | 0.0 | −1.0 | 5.4 |
| Seafood Snacks | −2.4 | 0.0 | 0.0 |
| Other Savoury Snacks | −2.1 | 1.8 | −8.3 |
| Sweet Biscuits, Snack Bars and Fruit Snacks | −1.8 | 1.6 | −7.8 |
| Fruit Snacks | 2.3 | −2.9 | 15.8 |
| Snack Bars | −1.6 | 1.2 | −5.7 |
| Sweet Biscuits | −2.1 | 2.0 | −9.3 |
|
Source: Euromonitor International, 2022 *CAGR: Compound annual growth rate |
|||
Top company Mondelez International Inc's retail value was US$3.8 billion in 2021, respresenting 13.4% market share, followed by PepsiCo Inc (US$2.4 billion, market share: 8.6%) and Mars Inc (US$2.4 billion, market share 8.6% same as PepsiCo Inc).
| Company | Retail sales (US$ millions) | Market share (%) |
|---|---|---|
| Mondelez International Inc | 3,803.4 | 13.4 |
| PepsiCo Inc | 2,444.2 | 8.6 |
| Mars Inc | 2,438.1 | 8.6 |
| Nestlé SA | 1,660.9 | 5.8 |
| Unilever Group | 1,213.6 | 4.3 |
| Private Label | 4,882.9 | 17.1 |
| Others | 4,211.3 | 14.8 |
| Source: Euromonitor International, 2022 | ||
Example
Prawn Cocktail Flavoured Tapioca Snack

| Company | Northern Snack Foods |
|---|---|
| Brand | Skips |
| Category | Snacks |
| Sub-category | Cassava and other root-based snacks |
| Market | United Kingdom |
| Store name | Sainsbury's |
| Store type | Supermarket |
| Store address | Bournemouth BH8 9UW |
| Date published | December 2021 |
| Product source | Shopper |
| Launch type | New packaging |
| Price in local currency | £1.00 |
| Price in US dollars | 1.34 |
| Price in Euros | 1.19 |
Skips Prawn Cocktail Flavoured Tapioca Snack has been repackaged and now retails in a redesigned pack made with 40% less packaging and containing six 13.1 gram packs and featuring the Terracycle logo. This light and melty vegetarian product is cooked with 100% sunflower oil, provides 71 kilocalories per 13.1 gram pack and contains no artificial colours, flavours or MSG.
Germany
Market overview
Germany was the second lagest snack market in EU and saw growth at a CAGR of 3.4% during the 2016-2021 period, reaching total retail sales of US$21.2 billion in 2021. Popcorn grew the fastest at a CAGR of 7.9%, reaching US$74.5 million, followed by nuts, seeds and trail mixes at 7.8%, reaching US$1.8 billion between 2016 and 2021. Chocolate confectionery was the largest subcategory (US$9.4 billion in 2021) in terms of total retail value sales.
During the pandemic, as more German people tended to stay and work home more from 2020 to 2022, this has increased demand for larger snack pack sizes and multipacks. Germans consumed and are coming more snacks, with savoury snacks especially in retail volume sales during 2021 and 2022 (Euromonitor, 2022).
| Category | 2016 | 2017 | 2018 | 2019 | 2020 | 2021 |
|---|---|---|---|---|---|---|
| Snacks Total | 17,926.2 | 18,454.4 | 18,543.0 | 19,162.9 | 20,106.4 | 21,196.2 |
| Confectionery | 11,950.6 | 12,134.9 | 12,000.2 | 12,258.9 | 12,535.7 | 13,322.1 |
| Chocolate Confectionery | 7,962.5 | 8,186.2 | 8,183.3 | 8,407.8 | 8,733.0 | 9,391.6 |
| Gum | 713.6 | 699.7 | 688.8 | 695.7 | 626.0 | 630.9 |
| Sugar Confectionery | 3,274.5 | 3,249.1 | 3,128.0 | 3,155.5 | 3,176.6 | 3,299.6 |
| Savoury Snacks | 3,825.9 | 4,073.1 | 4,280.3 | 4,546.0 | 5,032.2 | 5,237.3 |
| Nuts, Seeds and Trail Mixes | 1,226.5 | 1,364.5 | 1,453.1 | 1,544.7 | 1,697.1 | 1,781.9 |
| Salty Snacks | 1,669.9 | 1,745.4 | 1,824.6 | 1,921.4 | 2,153.8 | 2,246.3 |
| Savoury Biscuits | 526.8 | 544.4 | 566.7 | 625.8 | 692.5 | 707.0 |
| Popcorn | 51.0 | 54.4 | 57.6 | 61.4 | 70.0 | 74.5 |
| Pretzels | 240.0 | 248.5 | 258.0 | 268.5 | 286.0 | 289.5 |
| Meat Snacks | 85.2 | 88.8 | 92.6 | 96.1 | 103.3 | 108.0 |
| Seafood Snacks | 3.8 | 4.0 | 4.2 | 4.4 | 4.8 | 5.0 |
| Other Savoury Snacks | 22.8 | 23.1 | 23.5 | 23.7 | 24.7 | 25.1 |
| Sweet Biscuits, Snack Bars and Fruit Snacks | 2,149.7 | 2,246.4 | 2,262.5 | 2,358.0 | 2,538.5 | 2,636.8 |
| Fruit Snacks | 94.8 | 102.6 | 108.7 | 114.1 | 121.2 | 126.1 |
| Snack Bars | 249.7 | 256.5 | 267.0 | 276.9 | 293.9 | 310.2 |
| Sweet Biscuits | 1,805.1 | 1,887.2 | 1,886.8 | 1,966.9 | 2,123.4 | 2,200.4 |
| Source: Euromonitor International, 2022 | ||||||
| Category | Annual growth % 2020-2021 | CAGR* % 2016-2021 | Total growth % 2016-2021 |
|---|---|---|---|
| Snacks Total | 5.4 | 3.4 | 18.2 |
| Confectionery | 6.3 | 2.2 | 11.5 |
| Chocolate Confectionery | 7.5 | 3.4 | 17.9 |
| Gum | 0.8 | −2.4 | −11.6 |
| Sugar Confectionery | 3.9 | 0.2 | 0.8 |
| Savoury Snacks | 4.1 | 6.5 | 36.9 |
| Nuts, Seeds and Trail Mixes | 5.0 | 7.8 | 45.3 |
| Salty Snacks | 4.3 | 6.1 | 34.5 |
| Savoury Biscuits | 2.1 | 6.1 | 34.2 |
| Popcorn | 6.4 | 7.9 | 46.1 |
| Pretzels | 1.2 | 3.8 | 20.6 |
| Meat Snacks | 4.5 | 4.9 | 26.8 |
| Seafood Snacks | 4.2 | 5.6 | 31.6 |
| Other Savoury Snacks | 1.6 | 1.9 | 10.1 |
| Sweet Biscuits, Snack Bars and Fruit Snacks | 3.9 | 4.2 | 22.7 |
| Fruit Snacks | 4.0 | 5.9 | 33.0 |
| Snack Bars | 5.5 | 4.4 | 24.2 |
| Sweet Biscuits | 3.6 | 4.0 | 21.9 |
|
Source: Euromonitor International, 2022 *CAGR: Compound annual growth rate |
|||
This growth trend will likely continue throughout the 2021-2026 period. The German snack market is forecast to grow at a CAGR of 3.3% and be valued at US$24.9 billion by 2026. Gum is forecast to grow the fastest at a CAGR of 6.1% between 2021 and 2026, reaching US$850.1 million in 2026.
| Category | 2022 | 2023 | 2024 | 2025 | 2026 |
|---|---|---|---|---|---|
| Snacks Total | 21,955.1 | 22,593.4 | 23,387.0 | 24,197.3 | 24,985.3 |
| Confectionery | 13,845.0 | 14,223.5 | 14,623.4 | 15,020.6 | 15,391.0 |
| Chocolate Confectionery | 9,732.8 | 9,951.7 | 10,191.1 | 10,447.0 | 10,691.7 |
| Gum | 649.7 | 761.9 | 799.8 | 828.3 | 850.1 |
| Sugar Confectionery | 3,462.4 | 3,509.9 | 3,632.6 | 3,745.3 | 3,849.2 |
| Savoury Snacks | 5,379.3 | 5,603.3 | 5,886.1 | 6,191.8 | 6,509.0 |
| Nuts, Seeds and Trail Mixes | 1,818.2 | 1,920.7 | 2,026.6 | 2,139.7 | 2,257.3 |
| Salty Snacks | 2,321.0 | 2,398.1 | 2,514.1 | 2,640.3 | 2,771.2 |
| Savoury Biscuits | 722.1 | 741.5 | 777.1 | 819.5 | 865.3 |
| Popcorn | 73.1 | 75.6 | 80.3 | 85.5 | 90.8 |
| Pretzels | 299.3 | 314.9 | 326.7 | 337.3 | 347.1 |
| Meat Snacks | 114.6 | 121.4 | 128.9 | 135.8 | 142.2 |
| Seafood Snacks | 5.4 | 5.7 | 6.0 | 6.2 | 6.4 |
| Other Savoury Snacks | 25.6 | 25.5 | 26.4 | 27.5 | 28.6 |
| Sweet Biscuits, Snack Bars and Fruit Snacks | 2,730.8 | 2,766.6 | 2,877.5 | 2,984.9 | 3,085.3 |
| Fruit Snacks | 131.5 | 133.6 | 141.7 | 148.1 | 153.9 |
| Snack Bars | 329.7 | 346.3 | 361.6 | 379.1 | 395.6 |
| Sweet Biscuits | 2,269.6 | 2,286.7 | 2,374.2 | 2,457.7 | 2,535.7 |
| Source: Euromonitor International, 2022 | |||||
| Category | Annual growth % 2021-2022 | CAGR* % 2021-2026 | Total growth % 2021-2026 |
|---|---|---|---|
| Snacks Total | 3.6 | 3.3 | 17.9 |
| Confectionery | 3.9 | 2.9 | 15.5 |
| Chocolate Confectionery | 3.6 | 2.6 | 13.8 |
| Gum | 3.0 | 6.1 | 34.7 |
| Sugar Confectionery | 4.9 | 3.1 | 16.7 |
| Savoury Snacks | 2.7 | 4.4 | 24.3 |
| Nuts, Seeds and Trail Mixes | 2.0 | 4.8 | 26.7 |
| Salty Snacks | 3.3 | 4.3 | 23.4 |
| Savoury Biscuits | 2.1 | 4.1 | 22.4 |
| Popcorn | −1.9 | 4.0 | 21.9 |
| Pretzels | 3.4 | 3.7 | 19.9 |
| Meat Snacks | 6.1 | 5.7 | 31.7 |
| Seafood Snacks | 8.0 | 5.1 | 28.0 |
| Other Savoury Snacks | 2.0 | 2.6 | 13.9 |
| Sweet Biscuits, Snack Bars and Fruit Snacks | 3.6 | 3.2 | 17.0 |
| Fruit Snacks | 4.3 | 4.1 | 22.0 |
| Snack Bars | 6.3 | 5.0 | 27.5 |
| Sweet Biscuits | 3.1 | 2.9 | 15.2 |
|
Source: Euromonitor International, 2022 *CAGR: Compound annual growth rate |
|||
In terms of volume, seafood snacks and popcorn led the CAGR growth between 2016 and 2021, representing 8.4% and 7.0% respectively. Only gum and sugar confectioney had a negative growth of CAGR: −3.4% and −0.5% respectively between 2016 and 2021.
| Category | 2016 | 2017 | 2018 | 2019 | 2020 | 2021 |
|---|---|---|---|---|---|---|
| Snacks Total | 1,815.4 | 1,843.4 | 1,827.9 | 1,882.1 | 1,972.4 | 2,018.5 |
| Confectionery | 1,074.4 | 1,075.1 | 1,048.1 | 1,065.7 | 1,089.3 | 1,121.9 |
| Chocolate Confectionery | 646.8 | 652.4 | 645.0 | 657.8 | 683.6 | 708.7 |
| Gum | 21.4 | 21.3 | 20.8 | 20.9 | 18.5 | 18.0 |
| Sugar Confectionery | 406.2 | 401.4 | 382.3 | 387.0 | 387.1 | 395.2 |
| Savoury Snacks | 414.0 | 432.1 | 449.6 | 477.8 | 523.6 | 529.2 |
| Nuts, Seeds and Trail Mixes | 61.4 | 65.5 | 69.4 | 73.5 | 80.1 | 83.6 |
| Salty Snacks | 148.8 | 155.6 | 161.7 | 169.0 | 188.0 | 192.5 |
| Savoury Biscuits | 135.7 | 140.4 | 145.4 | 159.5 | 175.0 | 173.3 |
| Popcorn | 5.0 | 5.3 | 5.6 | 5.9 | 6.7 | 7.0 |
| Pretzels | 55.5 | 57.5 | 59.3 | 61.4 | 64.8 | 63.7 |
| Meat Snacks | 5.7 | 5.9 | 6.2 | 6.3 | 6.8 | 7.0 |
| Seafood Snacks | 0.4 | 0.5 | 0.5 | 0.5 | 0.6 | 0.6 |
| Other Savoury Snacks | 1.5 | 1.6 | 1.6 | 1.5 | 1.6 | 1.6 |
| Sweet Biscuits, Snack Bars and Fruit Snacks | 327.0 | 336.2 | 330.2 | 338.6 | 359.5 | 367.4 |
| Fruit Snacks | 6.9 | 7.3 | 7.5 | 7.6 | 8.0 | 8.3 |
| Snack Bars | 19.9 | 19.8 | 20.2 | 20.5 | 21.6 | 22.3 |
| Sweet Biscuits | 300.2 | 309.1 | 302.5 | 310.4 | 329.8 | 336.8 |
| Source: Euromonitor International, 2022 | ||||||
| Category | Annual growth % 2020-2021 | CAGR* % 2016-2021 | Total growth % 2016-2021 |
|---|---|---|---|
| Snacks Total | 2.3 | 2.1 | 11.2 |
| Confectionery | 3.0 | 0.9 | 4.4 |
| Chocolate Confectionery | 3.7 | 1.8 | 9.6 |
| Gum | −2.7 | −3.4 | −15.9 |
| Sugar Confectionery | 2.1 | −0.5 | −2.7 |
| Savoury Snacks | 1.1 | 5.0 | 27.8 |
| Nuts, Seeds and Trail Mixes | 4.4 | 6.4 | 36.2 |
| Salty Snacks | 2.4 | 5.3 | 29.4 |
| Savoury Biscuits | −1.0 | 5.0 | 27.7 |
| Popcorn | 4.5 | 7.0 | 40.0 |
| Pretzels | −1.7 | 2.8 | 14.8 |
| Meat Snacks | 2.9 | 4.2 | 22.8 |
| Seafood Snacks | 0.0 | 8.4 | 50.0 |
| Other Savoury Snacks | 0.0 | 1.3 | 6.7 |
| Sweet Biscuits, Snack Bars and Fruit Snacks | 2.2 | 2.4 | 12.4 |
| Fruit Snacks | 3.8 | 3.8 | 20.3 |
| Snack Bars | 3.2 | 2.3 | 12.1 |
| Sweet Biscuits | 2.1 | 2.3 | 12.2 |
|
Source: Euromonitor International, 2022 *CAGR: Compound annual growth rate |
|||
It is forecast that gum has the biggest CAGR growth of 3.2%, 21.1 thousand tonnes between 2021 and 2026, followed by meat snacks at a CAGR of 1.9%, 7.7 thousand tonnes.
| Category | 2022 | 2023 | 2024 | 2025 | 2026 |
|---|---|---|---|---|---|
| Snacks Total | 1,976.6 | 1,946.4 | 1,950.8 | 1,965.0 | 1,982.8 |
| Confectionery | 1,107.5 | 1,090.3 | 1,088.2 | 1,090.1 | 1,093.3 |
| Chocolate Confectionery | 697.4 | 687.5 | 685.0 | 686.1 | 688.5 |
| Gum | 18.1 | 20.3 | 20.7 | 21.0 | 21.1 |
| Sugar Confectionery | 392.0 | 382.5 | 382.6 | 383.1 | 383.8 |
| Savoury Snacks | 513.7 | 507.2 | 511.6 | 521.1 | 533.2 |
| Nuts, Seeds and Trail Mixes | 80.4 | 81.3 | 82.9 | 85.1 | 87.6 |
| Salty Snacks | 187.6 | 184.4 | 185.0 | 187.7 | 191.7 |
| Savoury Biscuits | 167.4 | 163.6 | 165.5 | 169.4 | 174.4 |
| Popcorn | 6.5 | 6.4 | 6.6 | 6.8 | 7.0 |
| Pretzels | 62.6 | 62.2 | 62.2 | 62.4 | 62.7 |
| Meat Snacks | 7.1 | 7.2 | 7.4 | 7.5 | 7.7 |
| Seafood Snacks | 0.6 | 0.6 | 0.6 | 0.6 | 0.6 |
| Other Savoury Snacks | 1.5 | 1.5 | 1.5 | 1.5 | 1.5 |
| Sweet Biscuits, Snack Bars and Fruit Snacks | 355.4 | 348.9 | 351.0 | 353.8 | 356.3 |
| Fruit Snacks | 7.9 | 8.1 | 8.3 | 8.4 | 8.6 |
| Snack Bars | 22.2 | 22.0 | 22.1 | 22.5 | 22.9 |
| Sweet Biscuits | 325.3 | 318.8 | 320.6 | 322.8 | 324.8 |
| Source: Euromonitor International, 2022 | |||||
| Category | Annual growth % 2021-2022 | CAGR* % 2021-2026 | Total growth % 2021-2026 |
|---|---|---|---|
| Snacks Total | −2.1 | −0.4 | −1.8 |
| Confectionery | −1.3 | −0.5 | −2.5 |
| Chocolate Confectionery | −1.6 | −0.6 | −2.9 |
| Gum | 0.6 | 3.2 | 17.2 |
| Sugar Confectionery | −0.8 | −0.6 | −2.9 |
| Savoury Snacks | −2.9 | 0.2 | 0.8 |
| Nuts, Seeds and Trail Mixes | −3.8 | 0.9 | 4.8 |
| Salty Snacks | −2.5 | −0.1 | −0.4 |
| Savoury Biscuits | −3.4 | 0.1 | 0.6 |
| Popcorn | −7.1 | 0.0 | 0.0 |
| Pretzels | −1.7 | −0.3 | −1.6 |
| Meat Snacks | 1.4 | 1.9 | 10.0 |
| Seafood Snacks | 0.0 | 0.0 | 0.0 |
| Other Savoury Snacks | −6.3 | −1.3 | −6.3 |
| Sweet Biscuits, Snack Bars and Fruit Snacks | −3.3 | −0.6 | −3.0 |
| Fruit Snacks | −4.8 | 0.7 | 3.6 |
| Snack Bars | −0.4 | 0.5 | 2.7 |
| Sweet Biscuits | −3.4 | −0.7 | −3.6 |
|
Source: Euromonitor International, 2022 *CAGR: Compound annual growth rate |
|||
Ferrero and related parties' retail value was US$2.5 billion in 2021, respresenting 10.0% market share, followed by August Storck KG (US$1.6 billion, market share: 6.4%) and Mars Inc (US$1.5 billion, market share 6.0%).
| Company | Retail sales (US$ millions) | Market share (%) |
|---|---|---|
| Ferrero and related parties | 2,523.6 | 10.0 |
| August Storck KG | 1,606.6 | 6.4 |
| Mars Inc | 1,506.0 | 6.0 |
| Intersnack Group GmbH & Co KG | 1,202.0 | 4.8 |
| Mondelez International Inc | 1,237.1 | 4.9 |
| Private Label | 5,906.3 | 23.5 |
| Others | 2,717.2 | 10.8 |
| Source: Euromonitor International, 2022 | ||
Example
Sea Salt Flavour Lentil Chips

| Company | Cofresh Snack Foods |
|---|---|
| Manufacturer | Cofresh Snack Foods |
| Brand | Eat Real |
| Category | Snacks |
| Sub-category | Bean-Based snacks |
| Market | Germany |
| Location of manufacture | United Kingdom |
| Import Status | Imported product |
| Store name | REWE Center |
| Store type | Mass merchandise / hypermarket |
| Store address | Frankfurt am Main 60326 |
| Date published | September 2019 |
| Product source | Shopper |
| Launch type | New packaging |
| Price in local currency | €2.49 |
| Price in US dollars | 2.76 |
Eat Real Snack auf Linsenbasis (Sea Salt Flavour Lentil Chips) has been repackaged. The snack contains 40% less fat than regular potato crisps, with no added sugar, and is gluten free. This kosher product is suitable for vegans. It retails in an updated 113 gram pack bearing the Vegan and Gluten-Free Certified by Coeliac UK logos.
France
Market overview
France was the 3rd largest snack market in EU and saw growth at a CAGR of 2.3% during the 2016-2021 period, reaching total retail sales of US$17.4 billion in 2021. Other savoury snacks grew the fastest at a CAGR of 10.2% between 2016 and 2021, reaching US$5.2 million in 2021, followed by nuts, seeds and trail mixes at a CAGR of 6.3%, reaching US$973.1 million between 2016 and 2021. Gum was impacted the most by Covid-19 at a CAGR of −7.1% between 2016 and 2021. Chocolate confectionery was the largest subcategory (US$6.1 billion in 2021) in terms of total retail value sales.
The impact of rising prices, caused by inflation, petrol prices, wheat prices, and compounded by the negative financial hangover following the pandemic, is actually likely to benefit both some indulgent snacking products and basics alike (Euromonitor 2022).
| Category | 2016 | 2017 | 2018 | 2019 | 2020 | 2021 |
|---|---|---|---|---|---|---|
| Snacks Total | 15,560.5 | 15,938.9 | 16,281.3 | 16,386.6 | 16,783.8 | 17,403.5 |
| Confectionery | 7,373.5 | 7,474.8 | 7,543.0 | 7,590.0 | 7,567.6 | 7,882.2 |
| Chocolate Confectionery | 5,346.5 | 5,504.0 | 5,631.9 | 5,701.9 | 5,756.8 | 6,070.5 |
| Gum | 575.2 | 540.8 | 506.3 | 491.5 | 429.2 | 398.2 |
| Sugar Confectionery | 1,451.8 | 1,429.9 | 1,404.8 | 1,396.6 | 1,381.6 | 1,413.5 |
| Savoury Snacks | 2,956.7 | 3,116.2 | 3,255.7 | 3,309.4 | 3,475.3 | 3,684.9 |
| Nuts, Seeds and Trail Mixes | 716.8 | 772.0 | 836.9 | 854.4 | 904.9 | 973.1 |
| Salty Snacks | 1,319.1 | 1,406.2 | 1,475.1 | 1,514.2 | 1,609.1 | 1,718.2 |
| Savoury Biscuits | 828.7 | 843.9 | 847.1 | 841.2 | 858.0 | 885.6 |
| Popcorn | 39.1 | 40.3 | 41.9 | 43.7 | 45.9 | 48.5 |
| Pretzels | 42.0 | 42.4 | 42.8 | 43.4 | 44.1 | 45.5 |
| Meat Snacks | 7.8 | 8.0 | 8.2 | 8.4 | 8.5 | 8.8 |
| Other Savoury Snacks | 3.2 | 3.5 | 3.8 | 4.1 | 4.9 | 5.2 |
| Sweet Biscuits, Snack Bars and Fruit Snacks | 3,224.9 | 3,262.9 | 3,310.4 | 3,345.6 | 3,463.5 | 3,565.4 |
| Fruit Snacks | 463.9 | 494.8 | 525.1 | 544.8 | 575.3 | 617.1 |
| Snack Bars | 183.5 | 192.0 | 203.7 | 215.5 | 206.4 | 218.7 |
| Sweet Biscuits | 2,577.5 | 2,576.1 | 2,581.6 | 2,585.3 | 2,681.8 | 2,729.5 |
| Source: Euromonitor International, 2022 | ||||||
| Category | Annual growth % 2020-2021 | CAGR* % 2016-2021 | Total growth % 2016-2021 |
|---|---|---|---|
| Snacks Total | 3.7 | 2.3 | 11.8 |
| Confectionery | 4.2 | 1.3 | 6.9 |
| Chocolate Confectionery | 5.4 | 2.6 | 13.5 |
| Gum | −7.2 | −7.1 | −30.8 |
| Sugar Confectionery | 2.3 | −0.5 | −2.6 |
| Savoury Snacks | 6.0 | 4.5 | 24.6 |
| Nuts, Seeds and Trail Mixes | 7.5 | 6.3 | 35.8 |
| Salty Snacks | 6.8 | 5.4 | 30.3 |
| Savoury Biscuits | 3.2 | 1.3 | 6.9 |
| Popcorn | 5.7 | 4.4 | 24.0 |
| Pretzels | 3.2 | 1.6 | 8.3 |
| Meat Snacks | 3.5 | 2.4 | 12.8 |
| Other Savoury Snacks | 6.1 | 10.2 | 62.5 |
| Sweet Biscuits, Snack Bars and Fruit Snacks | 2.9 | 2.0 | 10.6 |
| Fruit Snacks | 7.3 | 5.9 | 33.0 |
| Snack Bars | 6.0 | 3.6 | 19.2 |
| Sweet Biscuits | 1.8 | 1.2 | 5.9 |
|
Source: Euromonitor International, 2022 *CAGR: Compound annual growth rate |
|||
This growth trend will likely continue throughout the 2021-2026 period. The French snack market is forecast to grow at a CAGR of 4.1% and be valued at US$21.2 billion by 2026. Other savoury snacks is forecast to grow the fastest at a CAGR of 10.8% between 2021 and 2026, reaching US$8.7 million in 2026.
| Category | 2022 | 2023 | 2024 | 2025 | 2026 |
|---|---|---|---|---|---|
| Snacks Total | 18,180.0 | 18,997.0 | 19,792.0 | 20,522.2 | 21,242.7 |
| Confectionery | 8,130.4 | 8,473.6 | 8,786.0 | 9,062.7 | 9,328.6 |
| Chocolate Confectionery | 6,287.0 | 6,589.6 | 6,873.1 | 7,128.1 | 7,375.6 |
| Gum | 379.7 | 367.9 | 357.7 | 348.7 | 339.9 |
| Sugar Confectionery | 1,463.7 | 1,516.1 | 1,555.2 | 1,585.8 | 1,613.1 |
| Savoury Snacks | 3,956.9 | 4,191.9 | 4,417.7 | 4,630.3 | 4,841.6 |
| Nuts, Seeds and Trail Mixes | 1,035.9 | 1,099.0 | 1,159.2 | 1,213.0 | 1,264.4 |
| Salty Snacks | 1,858.8 | 1,973.9 | 2,083.0 | 2,186.1 | 2,288.1 |
| Savoury Biscuits | 949.0 | 999.6 | 1,050.2 | 1,100.4 | 1,152.8 |
| Popcorn | 51.2 | 54.1 | 57.0 | 59.7 | 62.4 |
| Pretzels | 47.4 | 49.5 | 51.4 | 53.1 | 54.6 |
| Meat Snacks | 9.0 | 9.4 | 9.8 | 10.2 | 10.6 |
| Other Savoury Snacks | 5.7 | 6.3 | 7.0 | 7.8 | 8.7 |
| Sweet Biscuits, Snack Bars and Fruit Snacks | 3,763.7 | 3,893.6 | 4,041.7 | 4,173.5 | 4,300.0 |
| Fruit Snacks | 661.0 | 709.2 | 753.5 | 793.4 | 832.3 |
| Snack Bars | 224.7 | 237.4 | 250.5 | 263.5 | 276.7 |
| Sweet Biscuits | 2,878.1 | 2,946.9 | 3,037.8 | 3,116.7 | 3,191.0 |
| Source: Euromonitor International, 2022 | |||||
| Category | Annual growth % 2021-2022 | CAGR* % 2021-2026 | Total growth % 2021-2026 |
|---|---|---|---|
| Snacks Total | 4.5 | 4.1 | 22.1 |
| Confectionery | 3.1 | 3.4 | 18.4 |
| Chocolate Confectionery | 3.6 | 4.0 | 21.5 |
| Gum | −4.6 | −3.1 | −14.6 |
| Sugar Confectionery | 3.6 | 2.7 | 14.1 |
| Savoury Snacks | 7.4 | 5.6 | 31.4 |
| Nuts, Seeds and Trail Mixes | 6.5 | 5.4 | 29.9 |
| Salty Snacks | 8.2 | 5.9 | 33.2 |
| Savoury Biscuits | 7.2 | 5.4 | 30.2 |
| Popcorn | 5.6 | 5.2 | 28.7 |
| Pretzels | 4.2 | 3.7 | 20.0 |
| Meat Snacks | 2.3 | 3.8 | 20.5 |
| Other Savoury Snacks | 9.6 | 10.8 | 67.3 |
| Sweet Biscuits, Snack Bars and Fruit Snacks | 5.6 | 3.8 | 20.6 |
| Fruit Snacks | 7.1 | 6.2 | 34.9 |
| Snack Bars | 2.7 | 4.8 | 26.5 |
| Sweet Biscuits | 5.4 | 3.2 | 16.9 |
|
Source: Euromonitor International, 2022 *CAGR: Compound annual growth rate |
|||
In terms of volume, other savoury snacks lead the CAGR growth between 2016 and 2021, at a CAGR of 8.4%, reaching 0.3 thousand tonnes, followed by salty snacks (CAGR 3.9%, volume 177.3 thousand tonnes).
| Category | 2016 | 2017 | 2018 | 2019 | 2020 | 2021 |
|---|---|---|---|---|---|---|
| Snacks Total | 1,147.5 | 1,150.2 | 1,148.7 | 1,141.6 | 1,164.0 | 1,194.2 |
| Confectionery | 418.6 | 415.9 | 413.7 | 408.8 | 409.6 | 420.8 |
| Chocolate Confectionery | 270.9 | 272.5 | 272.2 | 270.9 | 275.2 | 286.3 |
| Gum | 14.6 | 14.0 | 13.3 | 12.6 | 11.4 | 10.4 |
| Sugar Confectionery | 133.2 | 129.3 | 128.3 | 125.3 | 123.1 | 124.0 |
| Savoury Snacks | 341.8 | 349.4 | 354.2 | 353.1 | 363.6 | 376.8 |
| Nuts, Seeds and Trail Mixes | 62.3 | 63.9 | 65.9 | 65.4 | 67.7 | 71.1 |
| Salty Snacks | 146.7 | 154.6 | 159.8 | 161.7 | 169.3 | 177.3 |
| Savoury Biscuits | 122.0 | 120.1 | 117.6 | 114.8 | 115.2 | 116.7 |
| Popcorn | 3.5 | 3.5 | 3.6 | 3.6 | 3.8 | 3.9 |
| Pretzels | 6.7 | 6.7 | 6.7 | 6.8 | 6.9 | 7.0 |
| Meat Snacks | 0.5 | 0.5 | 0.5 | 0.5 | 0.5 | 0.5 |
| Other Savoury Snacks | 0.2 | 0.2 | 0.2 | 0.3 | 0.3 | 0.3 |
| Sweet Biscuits, Snack Bars and Fruit Snacks | 387.1 | 384.9 | 380.8 | 379.7 | 390.8 | 396.6 |
| Fruit Snacks | 40.9 | 41.0 | 41.5 | 41.8 | 42.8 | 45.0 |
| Snack Bars | 11.8 | 12.2 | 12.7 | 13.2 | 12.4 | 13.0 |
| Sweet Biscuits | 334.5 | 331.7 | 326.6 | 324.7 | 335.6 | 338.6 |
| Source: Euromonitor International, 2022 | ||||||
| Category | Annual growth % 2020-2021 | CAGR* % 2016-2021 | Total growth % 2016-2021 |
|---|---|---|---|
| Snacks Total | 2.6 | 0.8 | 4.1 |
| Confectionery | 2.7 | 0.1 | 0.5 |
| Chocolate Confectionery | 4.0 | 1.1 | 5.7 |
| Gum | −8.8 | −6.6 | −28.8 |
| Sugar Confectionery | 0.7 | −1.4 | −6.9 |
| Savoury Snacks | 3.6 | 2.0 | 10.2 |
| Nuts, Seeds and Trail Mixes | 5.0 | 2.7 | 14.1 |
| Salty Snacks | 4.7 | 3.9 | 20.9 |
| Savoury Biscuits | 1.3 | −0.9 | −4.3 |
| Popcorn | 2.6 | 2.2 | 11.4 |
| Pretzels | 1.4 | 0.9 | 4.5 |
| Meat Snacks | 0.0 | 0.0 | 0.0 |
| Other Savoury Snacks | 0.0 | 8.4 | 50.0 |
| Sweet Biscuits, Snack Bars and Fruit Snacks | 1.5 | 0.5 | 2.5 |
| Fruit Snacks | 5.1 | 1.9 | 10.0 |
| Snack Bars | 4.8 | 2.0 | 10.2 |
| Sweet Biscuits | 0.9 | 0.2 | 1.2 |
|
Source: Euromonitor International, 2022 *CAGR: Compound annual growth rate |
|||
It is forecast that other savoury snacks has the biggest CAGR growth of 10.8% between 2021 and 2026, reaching 0.5 thousand tonnes, followed by fruit snacks with the CAGR growth: 3.4% between 2021 and 2026, reaching 53.3 thousand tonnes in 2026.
| Category | 2022 | 2023 | 2024 | 2025 | 2026 |
|---|---|---|---|---|---|
| Snacks Total | 1,211.9 | 1,225.1 | 1,240.3 | 1,253.8 | 1,265.9 |
| Confectionery | 425.5 | 428.6 | 430.8 | 432.2 | 432.6 |
| Chocolate Confectionery | 291.1 | 294.6 | 297.5 | 299.6 | 301.5 |
| Gum | 9.8 | 9.3 | 8.9 | 8.6 | 8.2 |
| Sugar Confectionery | 124.6 | 124.7 | 124.4 | 124.0 | 122.9 |
| Savoury Snacks | 388.5 | 398.8 | 409.2 | 419.1 | 428.9 |
| Nuts, Seeds and Trail Mixes | 73.8 | 76.1 | 78.3 | 80.2 | 82.0 |
| Salty Snacks | 184.3 | 190.3 | 196.3 | 202.0 | 207.5 |
| Savoury Biscuits | 118.4 | 120.2 | 122.1 | 124.2 | 126.5 |
| Popcorn | 4.0 | 4.2 | 4.3 | 4.4 | 4.5 |
| Pretzels | 7.1 | 7.2 | 7.3 | 7.4 | 7.5 |
| Meat Snacks | 0.5 | 0.5 | 0.5 | 0.5 | 0.5 |
| Other Savoury Snacks | 0.4 | 0.4 | 0.4 | 0.4 |
0.5 |
| Sweet Biscuits, Snack Bars and Fruit Snacks | 397.9 | 397.7 | 400.3 | 402.5 | 404.4 |
| Fruit Snacks | 47.0 | 48.8 | 50.5 | 51.9 | 53.3 |
| Snack Bars | 13.2 | 13.4 | 13.7 | 14.0 | 14.3 |
| Sweet Biscuits | 337.7 | 335.4 | 336.1 | 336.6 | 336.9 |
| Source: Euromonitor International, 2022 | |||||
| Category | Annual growth % 2021-2022 | CAGR* % 2021-2026 | Total growth % 2021-2026 |
|---|---|---|---|
| Snacks Total | 1.5 | 1.2 | 6.0 |
| Confectionery | 1.1 | 0.6 | 2.8 |
| Chocolate Confectionery | 1.7 | 1.0 | 5.3 |
| Gum | −5.8 | −4.6 | −21.2 |
| Sugar Confectionery | 0.5 | −0.2 | −0.9 |
| Savoury Snacks | 3.1 | 2.6 | 13.8 |
| Nuts, Seeds and Trail Mixes | 3.8 | 2.9 | 15.3 |
| Salty Snacks | 3.9 | 3.2 | 17.0 |
| Savoury Biscuits | 1.5 | 1.6 | 8.4 |
| Popcorn | 2.6 | 2.9 | 15.4 |
| Pretzels | 1.4 | 1.4 | 7.1 |
| Meat Snacks | 0.0 | 0.0 | 0.0 |
| Other Savoury Snacks | 33.3 | 10.8 | 66.7 |
| Sweet Biscuits, Snack Bars and Fruit Snacks | 0.3 | 0.4 | 2.0 |
| Fruit Snacks | 4.4 | 3.4 | 18.4 |
| Snack Bars | 1.5 | 1.9 | 10.0 |
| Sweet Biscuits | −0.3 | −0.1 | −0.5 |
|
Source: Euromonitor International, 2022 *CAGR: Compound annual growth rate |
|||
Top company Mondelez International Inc's retail value was US$2.7 billion in 2021, respresenting 15.2% market share, followed by Ferrero & related parties (US$1.8 billion, market share: 10.1%) and Nestlé SA (US$909.4 million, market share 5.1%).
| Company | Retail sales (US$ millions) | Market share (%) |
|---|---|---|
| Mondelez International Inc | 2,715.3 | 15.2 |
| Ferrero & related parties | 1,795.9 | 10.1 |
| Nestlé SA | 909.4 | 5.1 |
| Mars Inc | 860.4 | 4.8 |
| Unilever Group | 827.7 | 4.6 |
| Private Label | 2,617.5 | 14.7 |
| Others | 2,158.0 | 12.1 |
| Source: Euromonitor International, 2022 | ||
Example
Peanuts, Pumpkin Seeds, Cranberries & Cashews Aperitif Mix
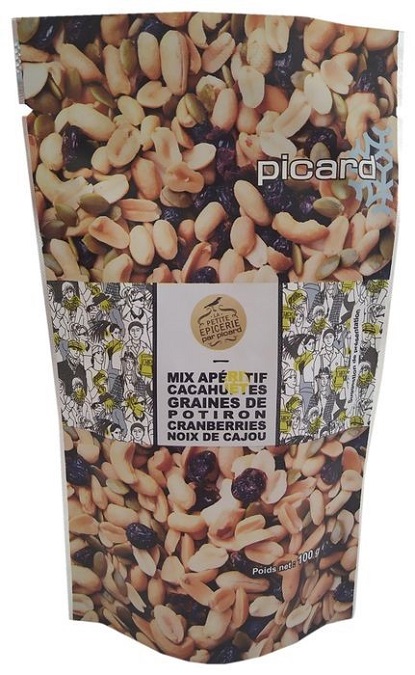
| Company | Picard |
|---|---|
| Brand | Picard La Petite Epicerie Par Picard |
| Category | Snacks |
| Sub-category | Snack mixes |
| Market | France |
| Location of manufacture | United Kingdom |
| Import Status | Imported product |
| Store name | Picard |
| Store type | Specialist Retailer |
| Store address | Les Pennes Mirabeau 13170 |
| Date published | June 2021 |
| Product source | Shopper |
| Launch type | New product |
| Price in local currency | €2.50 |
| Price in US dollars | 3.04 |
Picard La Petite Epicerie Par Picard Mix Apéritif Cacahuètes, Graines de Potiron, Cranberries et Noix de Cajou (Peanuts, Pumpkin Seeds, Cranberries & Cashews Aperitif Mix) is now available. The product comprises roasted and salted peanuts, pumpkin seeds, dried cranberries and roasted and salted cashew nuts. It retails in a 100 gram pack.
Italy
Market overview
Italy was the 4th largest market in EU. Between 2016 and 2021, the retail sales of snacks increased by a CAGR of 1.4% and was valued at US$13.8 billion in 2021. During this period, nuts, seeds and trail mixes led the retail sales growth with a CAGR of 5.6%, reaching 1.1 billion in 2021.
Snacks perceived as healthier options can still be considered a niche within the overall area of snacks in Italy, but the marketing and growth potential of these products is regarded as considerable (Euromonitor, 2022).
| Category | 2016 | 2017 | 2018 | 2019 | 2020 | 2021 |
|---|---|---|---|---|---|---|
| Snacks Total | 12,846.1 | 12,974.0 | 13,152.5 | 13,366.5 | 13,372.3 | 13,789.9 |
| Confectionery | 4,057.2 | 4,024.3 | 3,970.8 | 3,948.2 | 3,644.1 | 3,845.2 |
| Chocolate Confectionery | 2,305.8 | 2,310.9 | 2,287.9 | 2,289.7 | 2,198.2 | 2,349.3 |
| Gum | 540.5 | 520.3 | 498.2 | 480.3 | 386.7 | 400.8 |
| Sugar Confectionery | 1,211.0 | 1,193.1 | 1,184.7 | 1,178.2 | 1,059.2 | 1,095.1 |
| Savoury Snacks | 3,121.5 | 3,180.1 | 3,267.9 | 3,344.6 | 3,652.2 | 3,678.3 |
| Nuts, Seeds and Trail Mixes | 838.4 | 878.3 | 924.6 | 958.1 | 1,029.1 | 1,101.0 |
| Salty Snacks | 996.2 | 1,003.8 | 1,032.0 | 1,067.5 | 1,186.0 | 1,169.0 |
| Savoury Biscuits | 1,164.5 | 1,177.9 | 1,189.7 | 1,195.7 | 1,300.9 | 1,274.9 |
| Popcorn | 38.5 | 38.3 | 38.8 | 39.0 | 46.2 | 44.9 |
| Pretzels | 6.9 | 6.9 | 6.9 | 7.0 | 7.4 | 7.2 |
| Meat Snacks | 4.1 | 4.3 | 4.4 | 4.6 | 4.6 | 4.9 |
| Other Savoury Snacks | 72.9 | 70.5 | 71.5 | 72.7 | 77.9 | 76.5 |
| Sweet Biscuits, Snack Bars and Fruit Snacks | 2,603.8 | 2,657.7 | 2,742.3 | 2,838.9 | 3,035.6 | 3,069.0 |
| Fruit Snacks | 242.0 | 258.0 | 273.5 | 290.7 | 280.6 | 289.4 |
| Snack Bars | 262.3 | 262.7 | 281.2 | 304.4 | 274.9 | 288.3 |
| Sweet Biscuits | 2,099.5 | 2,137.0 | 2,187.7 | 2,243.8 | 2,480.1 | 2,491.4 |
| Source: Euromonitor International, 2022 | ||||||
| Category | Annual growth % 2020-2021 | CAGR* % 2016-2021 | Total growth % 2016-2021 |
|---|---|---|---|
| Snacks Total | 3.1 | 1.4 | 7.3 |
| Confectionery | 5.5 | −1.1 | −5.2 |
| Chocolate Confectionery | 6.9 | 0.4 | 1.9 |
| Gum | 3.6 | −5.8 | −25.8 |
| Sugar Confectionery | 3.4 | −2.0 | −9.6 |
| Savoury Snacks | 0.7 | 3.3 | 17.8 |
| Nuts, Seeds and Trail Mixes | 7.0 | 5.6 | 31.3 |
| Salty Snacks | −1.4 | 3.3 | 17.3 |
| Savoury Biscuits | −2.0 | 1.8 | 9.5 |
| Popcorn | −2.8 | 3.1 | 16.6 |
| Pretzels | −2.7 | 0.9 | 4.3 |
| Meat Snacks | 6.5 | 3.6 | 19.5 |
| Other Savoury Snacks | −1.8 | 1.0 | 4.9 |
| Sweet Biscuits, Snack Bars and Fruit Snacks | 1.1 | 3.3 | 17.9 |
| Fruit Snacks | 3.1 | 3.6 | 19.6 |
| Snack Bars | 4.9 | 1.9 | 9.9 |
| Sweet Biscuits | 0.5 | 3.5 | 18.7 |
|
Source: Euromonitor International, 2022 *CAGR: Compound annual growth rate |
|||
This growth trend will likely continue throughout the 2021-2026 period. The Italy snack market is forecast to grow at a CAGR of 4.9% and be valued at US$17.5 billion by 2026. Snack bars are forecast to grow the fastest at the CAGR of 7.7% between 2021 and 2026, reaching US$418.0 million in 2026, followed by fruit sancks (7.3%, US$411.7 million) and meat snacks (7.1%, US$6.9 million). It is forecast that savoury snacks will surpass confectionery in 2025 and 2026, reaching US$4.5 billion and US$4.7 billion respectively.
| Category | 2022 | 2023 | 2024 | 2025 | 2026 |
|---|---|---|---|---|---|
| Snacks Total | 14,742.9 | 15,434.6 | 16,183.3 | 16,898.2 | 17,552.5 |
| Confectionery | 4,082.9 | 4,211.5 | 4,376.3 | 4,521.6 | 4,631.1 |
| Chocolate Confectionery | 2,506.2 | 2,575.0 | 2,697.0 | 2,809.5 | 2,898.8 |
| Gum | 423.1 | 436.9 | 446.1 | 452.6 | 454.3 |
| Sugar Confectionery | 1,153.6 | 1,199.5 | 1,233.1 | 1,259.5 | 1,278.0 |
| Savoury Snacks | 3,910.4 | 4,130.1 | 4,332.8 | 4,540.1 | 4,741.7 |
| Nuts, Seeds and Trail Mixes | 1,173.9 | 1,250.8 | 1,316.0 | 1,386.1 | 1,458.2 |
| Salty Snacks | 1,242.8 | 1,321.7 | 1,403.5 | 1,486.3 | 1,565.0 |
| Savoury Biscuits | 1,357.4 | 1,415.5 | 1,466.4 | 1,516.4 | 1,563.2 |
| Popcorn | 46.2 | 48.2 | 49.8 | 51.2 | 52.3 |
| Pretzels | 7.4 | 7.7 | 8.0 | 8.3 | 8.6 |
| Meat Snacks | 5.2 | 5.6 | 6.0 | 6.4 | 6.9 |
| Other Savoury Snacks | 77.7 | 80.6 | 83.1 | 85.3 | 87.6 |
| Sweet Biscuits, Snack Bars and Fruit Snacks | 3,268.0 | 3,377.9 | 3,547.2 | 3,703.7 | 3,852.6 |
| Fruit Snacks | 313.8 | 330.1 | 358.6 | 385.3 | 411.7 |
| Snack Bars | 310.2 | 334.1 | 361.7 | 389.5 | 418.0 |
| Sweet Biscuits | 2,644.0 | 2,713.7 | 2,827.0 | 2,928.9 | 3,022.9 |
| Source: Euromonitor International, 2022 | |||||
| Category | Annual growth % 2021-2022 | CAGR* % 2021-2026 | Total growth % 2021-2026 |
|---|---|---|---|
| Snacks Total | 6.9 | 4.9 | 27.3 |
| Confectionery | 6.2 | 3.8 | 20.4 |
| Chocolate Confectionery | 6.7 | 4.3 | 23.4 |
| Gum | 5.6 | 2.5 | 13.3 |
| Sugar Confectionery | 5.3 | 3.1 | 16.7 |
| Savoury Snacks | 6.3 | 5.2 | 28.9 |
| Nuts, Seeds and Trail Mixes | 6.6 | 5.8 | 32.4 |
| Salty Snacks | 6.3 | 6.0 | 33.9 |
| Savoury Biscuits | 6.5 | 4.2 | 22.6 |
| Popcorn | 2.9 | 3.1 | 16.5 |
| Pretzels | 2.8 | 3.6 | 19.4 |
| Meat Snacks | 6.1 | 7.1 | 40.8 |
| Other Savoury Snacks | 1.6 | 2.7 | 14.5 |
| Sweet Biscuits, Snack Bars and Fruit Snacks | 6.5 | 4.7 | 25.5 |
| Fruit Snacks | 8.4 | 7.3 | 42.3 |
| Snack Bars | 7.6 | 7.7 | 45.0 |
| Sweet Biscuits | 6.1 | 3.9 | 21.3 |
|
Source: Euromonitor International, 2022 *CAGR: Compound annual growth rate |
|||
In terms of volume, nuts, seeds and trail mixes led the CAGR growth between 2016 and 2021, Nuts, seeds and trail mixes grew the fastest at CAGR of 5.3% between 2016 and 2021, reaching 80.0 thousand tonnes, followed by the fruit bars (CAGR: 4.4%, 22.0 thousand tonnes).
| Category | 2016 | 2017 | 2018 | 2019 | 2020 | 2021 |
|---|---|---|---|---|---|---|
| Snacks Total | 1,092.5 | 1,103.3 | 1,116.0 | 1,132.3 | 1,203.5 | 1,202.9 |
| Confectionery | 233.5 | 229.8 | 225.8 | 223.2 | 210.7 | 217.9 |
| Chocolate Confectionery | 129.2 | 127.7 | 125.7 | 124.9 | 123.5 | 128.6 |
| Gum | 11.9 | 11.6 | 11.1 | 10.7 | 8.8 | 9.0 |
| Sugar Confectionery | 92.5 | 90.5 | 89.0 | 87.6 | 78.3 | 80.3 |
| Savoury Snacks | 406.4 | 410.3 | 416.1 | 422.1 | 459.5 | 454.2 |
| Nuts, Seeds and Trail Mixes | 61.8 | 64.1 | 66.8 | 69.7 | 75.8 | 80.0 |
| Salty Snacks | 103.2 | 103.7 | 105.8 | 108.5 | 119.4 | 116.1 |
| Savoury Biscuits | 227.2 | 228.6 | 229.5 | 229.8 | 248.6 | 242.7 |
| Popcorn | 7.0 | 6.9 | 7.0 | 7.0 | 8.2 | 7.9 |
| Pretzels | 0.9 | 0.9 | 0.9 | 0.9 | 1.0 | 1.0 |
| Meat Snacks | 0.1 | 0.1 | 0.1 | 0.1 | 0.1 | 0.1 |
| Seafood Snacks | ||||||
| Other Savoury Snacks | 6.2 | 6.0 | 6.0 | 6.1 | 6.5 | 6.4 |
| Sweet Biscuits, Snack Bars and Fruit Snacks | 452.6 | 463.2 | 474.1 | 487.0 | 533.3 | 530.8 |
| Fruit Snacks | 17.7 | 18.8 | 20.1 | 21.3 | 21.6 | 22.0 |
| Snack Bars | 13.0 | 13.0 | 13.7 | 14.8 | 13.6 | 14.1 |
| Sweet Biscuits | 421.9 | 431.4 | 440.3 | 450.9 | 498.1 | 494.6 |
| Source: Euromonitor International, 2022 | ||||||
| Category | Annual growth % 2020-2021 | CAGR* % 2016-2021 | Total growth % 2016-2021 |
|---|---|---|---|
| Snacks Total | 0.0 | 1.9 | 10.1 |
| Confectionery | 3.4 | −1.4 | −6.7 |
| Chocolate Confectionery | 4.1 | −0.1 | −0.5 |
| Gum | 2.3 | −5.4 | −24.4 |
| Sugar Confectionery | 2.6 | −2.8 | −13.2 |
| Savoury Snacks | −1.2 | 2.2 | 11.8 |
| Nuts, Seeds and Trail Mixes | 5.5 | 5.3 | 29.4 |
| Salty Snacks | −2.8 | 2.4 | 12.5 |
| Savoury Biscuits | −2.4 | 1.3 | 6.8 |
| Popcorn | −3.7 | 2.4 | 12.9 |
| Pretzels | 0.0 | 2.1 | 11.1 |
| Meat Snacks | 0.0 | 0.0 | 0.0 |
| Other Savoury Snacks | −1.5 | 0.6 | 3.2 |
| Sweet Biscuits, Snack Bars and Fruit Snacks | −0.5 | 3.2 | 17.3 |
| Fruit Snacks | 1.9 | 4.4 | 24.3 |
| Snack Bars | 3.7 | 1.6 | 8.5 |
| Sweet Biscuits | −0.7 | 3.2 | 17.2 |
|
Source: Euromonitor International, 2022 *CAGR: Compound annual growth rate |
|||
It is forecast that fruit bars and snack bars had the biggest CAGR growth of 4.5% between 2021 and 2026, reaching 27.4 thousand tonnes and 17.6 thousand tonees respectively.
| Category | 2022 | 2023 | 2024 | 2025 | 2026 |
|---|---|---|---|---|---|
| Snacks Total | 1,220.0 | 1,239.1 | 1,259.3 | 1,278.7 | 1,298.7 |
| Confectionery | 220.2 | 221.9 | 223.4 | 224.5 | 224.9 |
| Chocolate Confectionery | 130.2 | 131.7 | 133.2 | 134.4 | 135.3 |
| Gum | 9.0 | 9.0 | 8.9 | 8.9 | 8.7 |
| Sugar Confectionery | 80.9 | 81.2 | 81.3 | 81.2 | 80.9 |
| Savoury Snacks | 460.8 | 468.1 | 476.1 | 484.5 | 494.0 |
| Nuts, Seeds and Trail Mixes | 82.8 | 85.2 | 87.3 | 89.3 | 91.5 |
| Salty Snacks | 117.8 | 120.2 | 123.2 | 126.6 | 130.3 |
| Savoury Biscuits | 244.8 | 247.1 | 249.9 | 252.9 | 256.3 |
| Popcorn | 8.0 | 8.1 | 8.2 | 8.2 | 8.3 |
| Pretzels | 1.0 | 1.0 | 1.0 | 1.0 | 1.0 |
| Meat Snacks | 0.1 | 0.1 | 0.1 | 0.1 | 0.1 |
| Other Savoury Snacks | 6.4 | 6.4 | 6.5 | 6.5 | 6.5 |
| Sweet Biscuits, Snack Bars and Fruit Snacks | 539.0 | 549.1 | 559.8 | 569.7 | 579.8 |
| Fruit Snacks | 22.8 | 23.9 | 25.0 | 26.2 | 27.4 |
| Snack Bars | 14.6 | 15.2 | 15.9 | 16.7 | 17.6 |
| Sweet Biscuits | 501.5 | 510.1 | 518.9 | 526.8 | 534.8 |
| Source: Euromonitor International, 2022 | |||||
| Category | Annual growth % 2021-2022 | CAGR* % 2021-2026 | Total growth % 2021-2026 |
|---|---|---|---|
| Snacks Total | 1.4 | 1.5 | 8.0 |
| Confectionery | 1.1 | 0.6 | 3.2 |
| Chocolate Confectionery | 1.2 | 1.0 | 5.2 |
| Gum | 0.0 | −0.7 | −3.3 |
| Sugar Confectionery | 0.7 | 0.1 | 0.7 |
| Savoury Snacks | 1.5 | 1.7 | 8.8 |
| Nuts, Seeds and Trail Mixes | 3.5 | 2.7 | 14.4 |
| Salty Snacks | 1.5 | 2.3 | 12.2 |
| Savoury Biscuits | 0.9 | 1.1 | 5.6 |
| Popcorn | 1.3 | 1.0 | 5.1 |
| Pretzels | 0.0 | 0.0 | 0.0 |
| Meat Snacks | 0.0 | 0.0 | 0.0 |
| Other Savoury Snacks | 0.0 | 0.3 | 1.6 |
| Sweet Biscuits, Snack Bars and Fruit Snacks | 1.5 | 1.8 | 9.2 |
| Fruit Snacks | 3.6 | 4.5 | 24.5 |
| Snack Bars | 3.5 | 4.5 | 24.8 |
| Sweet Biscuits | 1.4 | 1.6 | 8.1 |
|
Source: Euromonitor International, 2022 *CAGR: Compound annual growth rate |
|||
Top company Barilla Holding SpA's retail value was US$1.3 billion in 2021, respresenting 9.3% market share, followed by Ferrero & related parties (US$1.3 billion, market share: 8.9%) and Perfetti Van Melle Group (US$656.5 million, market share 4.7%).
| Company | Retail sales (US$ millions) | Market share (%) |
|---|---|---|
| Barilla Holding SpA | 1,310.1 | 9.3 |
| Ferrero & related parties | 1,252.6 | 8.9 |
| Perfetti Van Melle Group | 656.5 | 4.7 |
| Unilever Group | 595.8 | 4.2 |
| Nestlé SA | 504.6 | 3.6 |
| Private Label | 1,610.5 | 11.4 |
| Others | 2,507.3 | 17.8 |
| Source: Euromonitor International, 2022 | ||
Example
Black Pepper & Rosemary Baked Pea Snacks
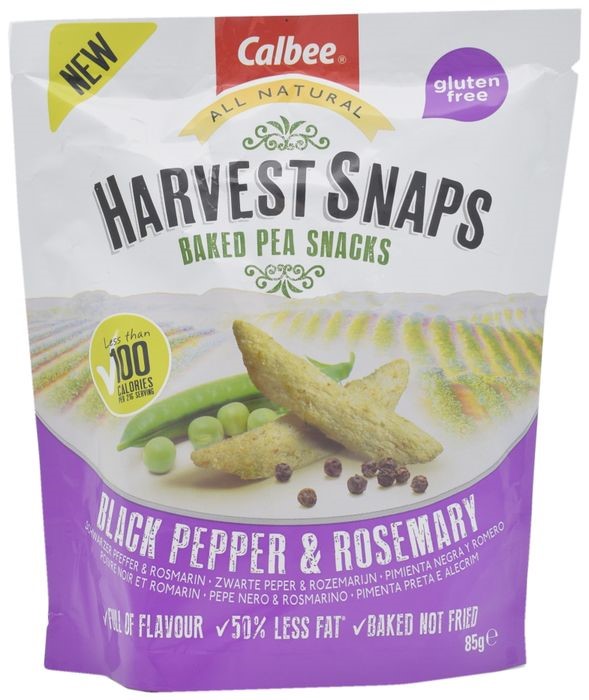
| Company | Calbee |
|---|---|
| Manufacturer | Calbee |
| Brand | Calbee Harvest Snaps |
| Category | Snacks |
| Sub-category | Bean-based snacks |
| Market | Italy |
| Location of manufacture | United Kingdom |
| Import Status | Imported product |
| Store name | Conad |
| Store type | Supermarket |
| Store address | Trentola Parete 81038 |
| Date published | December 2018 |
| Product source | Shopper |
| Launch type | New variety / range extension |
| Price in local currency | €2.49 |
| Price in US dollars | 2.84 |
Calbee Harvest Snaps Snack di Piselli e Riso Tostati con Pepe Nero e Rosmarino (Black Pepper & Rosemary Baked Pea Snacks) are now available. This all natural product comprises baked not fried pea and rice snack made from 72% whole green peas and seasoned with black pepper and rosemary, is said to be full of flavour, and contains 50% less fat compared to regular potato chips. It provides less than 100 calories per 21 gram serving, is gluten-free and suitable for vegans and vegetarians, and retails in an 85 gram pouch.
Spain
Market overview
Spain was the 5th lagest snack market in EU. The Spain snacks grew at a CAGR of 4.9% during the 2016-2021 period, reaching total retail sales of US$10.5 billion in 2021. Nuts, seeds and trail mixes grew the fastest at a CAGR of 9.5% between 2016 and 2021, reaching US$1.6 billion in 2021, followed by fruit snacks at CAGR of 7.7% between 2016 and 2021, reaching US$81.5 million in 2021.
In 2022, a new regulation came into force that outlaws advertising for unhealthy foods and beverages that is targeted at children and adolescents (aged 16 years and younger) on television, radio, social networks, websites, apps, cinema and newspapers. The snack categories affected by this are chocolate and sugar confectionery, energy bars and sweet biscuits (Euromonitor, 2022).
| Category | 2016 | 2017 | 2018 | 2019 | 2020 | 2021 |
|---|---|---|---|---|---|---|
| Snacks Total | 8,268.4 | 8,557.5 | 8,982.7 | 9,579.5 | 10,098.7 | 10,486.6 |
| Confectionery | 2,483.4 | 2,592.8 | 2,698.1 | 2,915.2 | 2,965.5 | 3,010.9 |
| Chocolate Confectionery | 1,261.3 | 1,329.7 | 1,386.9 | 1,548.7 | 1,627.6 | 1,682.5 |
| Gum | 293.8 | 299.7 | 305.8 | 312.7 | 286.5 | 269.2 |
| Sugar Confectionery | 928.3 | 963.5 | 1,005.5 | 1,053.8 | 1,051.4 | 1,059.2 |
| Savoury Snacks | 2,737.7 | 2,847.3 | 3,018.2 | 3,237.2 | 3,646.8 | 3,929.2 |
| Nuts, Seeds and Trail Mixes | 1,016.6 | 1,042.0 | 1,129.6 | 1,243.7 | 1,433.0 | 1,603.7 |
| Salty Snacks | 1,301.5 | 1,371.4 | 1,440.8 | 1,522.3 | 1,698.1 | 1,804.1 |
| Savoury Biscuits | 311.6 | 324.2 | 331.4 | 347.6 | 372.7 | 377.6 |
| Popcorn | 59.7 | 61.6 | 65.1 | 68.3 | 80.0 | 78.0 |
| Pretzels | 1.1 | 1.1 | 1.1 | 1.1 | 1.2 | 1.3 |
| Meat Snacks | 27.4 | 27.2 | 29.1 | 31.4 | 35.8 | 37.4 |
| Other Savoury Snacks | 19.9 | 19.7 | 21.1 | 22.7 | 25.9 | 27.0 |
| Sweet Biscuits, Snack Bars and Fruit Snacks | 1,373.8 | 1,380.4 | 1,436.1 | 1,479.0 | 1,532.1 | 1,524.1 |
| Fruit Snacks | 56.3 | 60.0 | 64.3 | 69.2 | 75.8 | 81.5 |
| Snack Bars | 124.6 | 123.2 | 124.4 | 124.2 | 120.7 | 129.4 |
| Sweet Biscuits | 1,192.8 | 1,197.2 | 1,247.3 | 1,285.5 | 1,335.5 | 1,313.2 |
| Source: Euromonitor International, 2022 | ||||||
| Category | Annual growth % 2020-2021 | CAGR* % 2016-2021 | Total growth % 2016-2021 |
|---|---|---|---|
| Snacks Total | 3.8 | 4.9 | 26.8 |
| Confectionery | 1.5 | 3.9 | 21.2 |
| Chocolate Confectionery | 3.4 | 5.9 | 33.4 |
| Gum | −6.0 | −1.7 | −8.4 |
| Sugar Confectionery | 0.7 | 2.7 | 14.1 |
| Savoury Snacks | 7.7 | 7.5 | 43.5 |
| Nuts, Seeds and Trail Mixes | 11.9 | 9.5 | 57.8 |
| Salty Snacks | 6.2 | 6.7 | 38.6 |
| Savoury Biscuits | 1.3 | 3.9 | 21.2 |
| Popcorn | −2.5 | 5.5 | 30.7 |
| Pretzels | 8.3 | 3.4 | 18.2 |
| Meat Snacks | 4.5 | 6.4 | 36.5 |
| Other Savoury Snacks | 4.2 | 6.3 | 35.7 |
| Sweet Biscuits, Snack Bars and Fruit Snacks | −0.5 | 2.1 | 10.9 |
| Fruit Snacks | 7.5 | 7.7 | 44.8 |
| Snack Bars | 7.2 | 0.8 | 3.9 |
| Sweet Biscuits | −1.7 | 1.9 | 10.1 |
|
Source: Euromonitor International, 2022 *CAGR: Compound annual growth rate |
|||
This growth trend will likely continue throughout the 2021-2026 period. The spain snack market is forecast to grow at a CAGR of 5.4% and be valued at US$13.7 billion by 2026. Nuts, seeds and trail mixes is forecast to grow the fastest at a CAGR of 8.7% between 2021 and 2026, reaching US$2.4 billion in 2026.
| Category | 2022 | 2023 | 2024 | 2025 | 2026 |
|---|---|---|---|---|---|
| Snacks Total | 11,048.5 | 11,794.8 | 12,426.3 | 13,052.4 | 13,663.8 |
| Confectionery | 3,135.9 | 3,342.7 | 3,516.5 | 3,685.7 | 3,847.2 |
| Chocolate Confectionery | 1,760.3 | 1,882.5 | 1,990.8 | 2,098.3 | 2,205.8 |
| Gum | 279.0 | 294.6 | 304.5 | 312.0 | 314.2 |
| Sugar Confectionery | 1,096.6 | 1,165.7 | 1,221.1 | 1,275.4 | 1,327.2 |
| Savoury Snacks | 4,194.1 | 4,498.2 | 4,755.4 | 5,011.6 | 5,262.4 |
| Nuts, Seeds and Trail Mixes | 1,772.5 | 1,948.2 | 2,106.8 | 2,270.4 | 2,434.4 |
| Salty Snacks | 1,882.1 | 1,982.1 | 2,056.8 | 2,125.6 | 2,187.5 |
| Savoury Biscuits | 389.8 | 408.4 | 423.9 | 439.8 | 456.8 |
| Popcorn | 81.1 | 86.2 | 90.1 | 93.7 | 97.2 |
| Pretzels | 1.4 | 1.4 | 1.6 | 1.6 | 1.7 |
| Meat Snacks | 38.9 | 41.6 | 43.9 | 46.1 | 48.2 |
| Other Savoury Snacks | 28.4 | 30.4 | 32.3 | 34.4 | 36.6 |
| Sweet Biscuits, Snack Bars and Fruit Snacks | 1,590.5 | 1,677.7 | 1,748.0 | 1,817.3 | 1,885.6 |
| Fruit Snacks | 88.8 | 97.4 | 105.1 | 112.3 | 119.2 |
| Snack Bars | 138.3 | 148.0 | 156.7 | 165.4 | 174.5 |
| Sweet Biscuits | 1,363.4 | 1,432.3 | 1,486.2 | 1,539.5 | 1,591.9 |
| Source: Euromonitor International, 2022 | |||||
| Category | Annual growth % 2021-2022 | CAGR* % 2021-2026 | Total growth % 2021-2026 |
|---|---|---|---|
| Snacks Total | 5.4 | 5.4 | 30.3 |
| Confectionery | 4.2 | 5.0 | 27.8 |
| Chocolate Confectionery | 4.6 | 5.6 | 31.1 |
| Gum | 3.6 | 3.1 | 16.7 |
| Sugar Confectionery | 3.5 | 4.6 | 25.3 |
| Savoury Snacks | 6.7 | 6.0 | 33.9 |
| Nuts, Seeds and Trail Mixes | 10.5 | 8.7 | 51.8 |
| Salty Snacks | 4.3 | 3.9 | 21.3 |
| Savoury Biscuits | 3.2 | 3.9 | 21.0 |
| Popcorn | 4.0 | 4.5 | 24.6 |
| Pretzels | 7.7 | 5.5 | 30.8 |
| Meat Snacks | 4.0 | 5.2 | 28.9 |
| Other Savoury Snacks | 5.2 | 6.3 | 35.6 |
| Sweet Biscuits, Snack Bars and Fruit Snacks | 4.4 | 4.3 | 23.7 |
| Fruit Snacks | 9.0 | 7.9 | 46.3 |
| Snack Bars | 6.9 | 6.2 | 34.9 |
| Sweet Biscuits | 3.8 | 3.9 | 21.2 |
|
Source: Euromonitor International, 2022 *CAGR: Compound annual growth rate |
|||
In terms of volume, nuts, seeds and trail mixes lead the CAGR growth between 2016 and 2021, representing 9.7%, reaching 223.1 thousand tonnes, followed by meat snacks (CAGR: 7.3%, 2.7 thousand tonnes in 2021) and other savoury snacks (7.2%, 1.7 thousand tonnes in 2021).
| Category | 2016 | 2017 | 2018 | 2019 | 2020 | 2021 |
|---|---|---|---|---|---|---|
| Snacks Total | 888.0 | 909.7 | 937.0 | 983.6 | 1,054.0 | 1,084.1 |
| Confectionery | 202.7 | 211.0 | 218.2 | 235.4 | 240.9 | 243.5 |
| Chocolate Confectionery | 98.7 | 102.4 | 104.7 | 116.4 | 125.5 | 127.9 |
| Gum | 9.7 | 9.9 | 10.0 | 10.2 | 9.2 | 8.6 |
| Sugar Confectionery | 94.3 | 98.7 | 103.4 | 108.7 | 106.2 | 107.0 |
| Savoury Snacks | 388.1 | 404.9 | 422.8 | 448.2 | 499.9 | 535.1 |
| Nuts, Seeds and Trail Mixes | 140.3 | 145.9 | 156.9 | 171.0 | 198.8 | 223.1 |
| Salty Snacks | 159.6 | 166.5 | 171.8 | 179.2 | 196.1 | 206.2 |
| Savoury Biscuits | 77.1 | 81.0 | 82.1 | 85.4 | 90.6 | 91.6 |
| Popcorn | 7.9 | 8.1 | 8.4 | 8.7 | 10.1 | 9.7 |
| Pretzels | 0.2 | 0.2 | 0.2 | 0.2 | 0.2 | 0.2 |
| Meat Snacks | 1.9 | 2.0 | 2.1 | 2.3 | 2.6 | 2.7 |
| Other Savoury Snacks | 1.2 | 1.2 | 1.3 | 1.4 | 1.6 | 1.7 |
| Sweet Biscuits, Snack Bars and Fruit Snacks | 297.2 | 293.8 | 296.0 | 300.0 | 313.2 | 305.5 |
| Fruit Snacks | 6.7 | 7.0 | 7.3 | 7.6 | 8.3 | 8.9 |
| Snack Bars | 7.7 | 7.5 | 7.4 | 7.2 | 6.9 | 7.3 |
| Sweet Biscuits | 282.9 | 279.3 | 281.3 | 285.1 | 298.0 | 289.4 |
| Source: Euromonitor International, 2022 | ||||||
| Category | Annual growth % 2020-2021 | CAGR* % 2016-2021 | Total growth % 2016-2021 |
|---|---|---|---|
| Snacks Total | 2.9 | 4.1 | 22.1 |
| Confectionery | 1.1 | 3.7 | 20.1 |
| Chocolate Confectionery | 1.9 | 5.3 | 29.6 |
| Gum | −6.5 | −2.4 | −11.3 |
| Sugar Confectionery | 0.8 | 2.6 | 13.5 |
| Savoury Snacks | 7.0 | 6.6 | 37.9 |
| Nuts, Seeds and Trail Mixes | 12.2 | 9.7 | 59.0 |
| Salty Snacks | 5.2 | 5.3 | 29.2 |
| Savoury Biscuits | 1.1 | 3.5 | 18.8 |
| Popcorn | −4.0 | 4.2 | 22.8 |
| Pretzels | 0.0 | 0.0 | 0.0 |
| Meat Snacks | 3.8 | 7.3 | 42.1 |
| Other Savoury Snacks | 6.2 | 7.2 | 41.7 |
| Sweet Biscuits, Snack Bars and Fruit Snacks | −2.5 | 0.6 | 2.8 |
| Fruit Snacks | 7.2 | 5.8 | 32.8 |
| Snack Bars | 5.8 | −1.1 | −5.2 |
| Sweet Biscuits | −2.9 | 0.5 | 2.3 |
|
Source: Euromonitor International, 2022 *CAGR: Compound annual growth rate |
|||
It is forecast that nuts, seeds and trail mixes has the biggest CAGR growth of 5.7% between 2021 and 2026, reaching 293.8 thousand tonnes, followed by fruit snacks (CAGR: 3.9%, 10.8 thousand tonnes).
| Category | 2022 | 2023 | 2024 | 2025 | 2026 |
|---|---|---|---|---|---|
| Snacks Total | 1,108.4 | 1,132.6 | 1,156.9 | 1,180.7 | 1,204.1 |
| Confectionery | 246.6 | 251.0 | 255.6 | 260.4 | 265.5 |
| Chocolate Confectionery | 130.1 | 132.8 | 135.4 | 138.3 | 141.3 |
| Gum | 8.8 | 8.9 | 9.0 | 8.9 | 8.8 |
| Sugar Confectionery | 107.7 | 109.3 | 111.2 | 113.3 | 115.4 |
| Savoury Snacks | 555.8 | 572.9 | 589.6 | 605.4 | 619.9 |
| Nuts, Seeds and Trail Mixes | 242.9 | 256.2 | 269.3 | 281.8 | 293.8 |
| Salty Snacks | 206.5 | 209.5 | 212.1 | 214.2 | 215.5 |
| Savoury Biscuits | 91.9 | 92.4 | 93.1 | 94.0 | 95.1 |
| Popcorn | 9.9 | 10.1 | 10.3 | 10.4 | 10.5 |
| Pretzels | 0.2 | 0.2 | 0.2 | 0.2 | 0.2 |
| Meat Snacks | 2.7 | 2.8 | 2.8 | 2.9 | 2.9 |
| Other Savoury Snacks | 1.7 | 1.7 | 1.8 | 1.9 | 1.9 |
| Sweet Biscuits, Snack Bars and Fruit Snacks | 306.0 | 308.7 | 311.7 | 314.9 | 318.7 |
| Fruit Snacks | 9.3 | 9.7 | 10.1 | 10.4 | 10.8 |
| Snack Bars | 7.5 | 7.7 | 7.9 | 8.2 | 8.4 |
| Sweet Biscuits | 289.2 | 291.3 | 293.7 | 296.3 | 299.5 |
| Source: Euromonitor International, 2022 | |||||
| Category | Annual growth % 2021-2022 | CAGR* % 2021-2026 | Total growth % 2021-2026 |
|---|---|---|---|
| Snacks Total | 2.2 | 2.1 | 11.1 |
| Confectionery | 1.3 | 1.7 | 9.0 |
| Chocolate Confectionery | 1.7 | 2.0 | 10.5 |
| Gum | 2.3 | 0.5 | 2.3 |
| Sugar Confectionery | 0.7 | 1.5 | 7.9 |
| Savoury Snacks | 3.9 | 3.0 | 15.8 |
| Nuts, Seeds and Trail Mixes | 8.9 | 5.7 | 31.7 |
| Salty Snacks | 0.1 | 0.9 | 4.5 |
| Savoury Biscuits | 0.3 | 0.8 | 3.8 |
| Popcorn | 2.1 | 1.6 | 8.2 |
| Pretzels | 0.0 | 0.0 | 0.0 |
| Meat Snacks | 0.0 | 1.4 | 7.4 |
| Other Savoury Snacks | 0.0 | 2.2 | 11.8 |
| Sweet Biscuits, Snack Bars and Fruit Snacks | 0.2 | 0.8 | 4.3 |
| Fruit Snacks | 4.5 | 3.9 | 21.3 |
| Snack Bars | 2.7 | 2.8 | 15.1 |
| Sweet Biscuits | −0.1 | 0.7 | 3.5 |
|
Source: Euromonitor International, 2022 *CAGR: Compound annual growth rate |
|||
Top company PepsiCo Inc's retail value was US$884.7 million in 2021, respresenting 8.2% market share, followed by Nestlé SA (US$708.4 million, market share: 6.6%) and Mondelez International Inc (US$534.6 million, market share 5.0%).
| Company | Retail sales (US$ millions) | Market share (%) |
|---|---|---|
| PepsiCo Inc | 884.7 | 8.2 |
| Nestlé SA | 708.4 | 6.6 |
| Mondelez International Inc | 534.6 | 5.0 |
| Unilever Group | 457.4 | 4.3 |
| Ferrero & related parties | 324.4 | 3.0 |
| Private Label | 3,479.1 | 32.4 |
| Others | 1,728.9 | 16.1 |
| Source: Euromonitor International, 2022 | ||
Example
Sour Cream and Chive Flavour Crisp Snack Biscuits
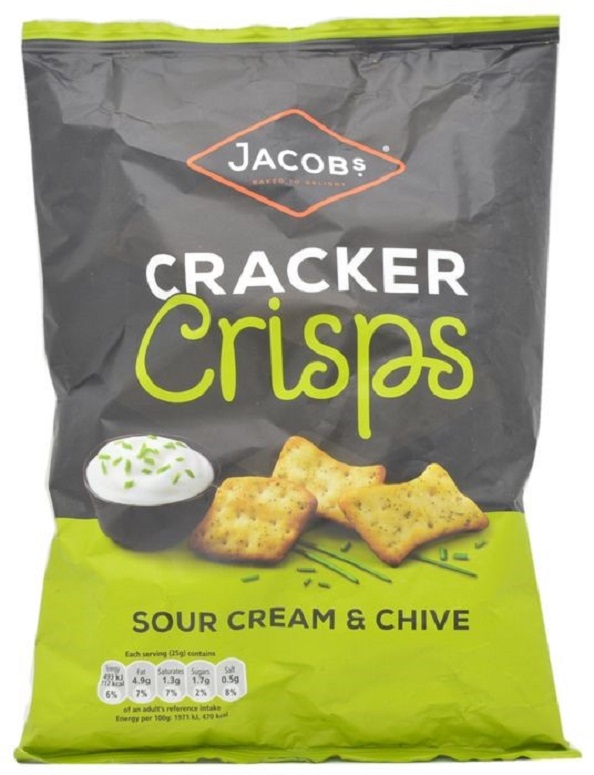
| Company | Jacob's Bakery |
|---|---|
| Manufacturer | Jacob's Bakery |
| Distributor | División Jasa |
| Brand | Jacob's Cracker Crisps |
| Category | Snacks |
| Sub-category | Wheat and other grain-based snacks |
| Market | Italy |
| Location of manufacture | United Kingdom |
| Import Status | Imported product |
| Store name | Carrefour |
| Store type | Supermarket |
| Store address | Las Rozas de Madrid 28232 |
| Date published | January 2017 |
| Product source | Shopper |
| Launch type | New variety / range extension |
| Price in local currency | €1.88 |
| Price in US dollars | 1.98 |
Jacob's Cracker Crisps Galletas Crema Agria y Cebollino (Sour Cream and Chive Flavour Crisp Snack Biscuits) are now available. They are described as irresistibly crunchy oven baked snacks with a generous seasoning of sour cream and chive flavour. This product is suitable for vegetarians, and contains no artificial colours, flavours or MSG. It retails in a 150 gram pack.
For more information
The Canadian Trade Commissioner Service:
International Trade Commissioners can provide Canadian industry with on-the-ground expertise regarding market potential, current conditions and local business contacts, and are an excellent point of contact for export advice.
More agri-food market intelligence:
International agri-food market intelligence
Discover global agriculture and food opportunities, the complete library of Global Analysis reports, market trends and forecasts, and information on Canada's free trade agreements.
Agri-food market intelligence service
Canadian agri-food and seafood businesses can take advantage of a customized service of reports and analysis, and join our email subscription service to have the latest reports delivered directly to their inbox.
More on Canada's agriculture and agri-food sectors:
Canada's agriculture sectors
Information on the agriculture industry by sector. Data on international markets. Initiatives to support awareness of the industry in Canada. How the department engages with the industry.
Resources
- Euromonitor International 2022
- Euromonitor International 2022:
- Snacks in the United Kingdom (July 2022)
- Snacks in France (July 2022)
- Snacks in Germany (July 2021)
- Snacks in Italy (July 2022)
- Snacks in Spain (July 2022)
- Mintel GDPD 2022
Sector Trend Analysis – Snacks in the European Union including the United Kingdom – Focus on top five markets
Global Analysis Report
Prepared by: Hongli Wang, Senior Market Analyst
© His Majesty the King in Right of Canada, represented by the Minister of Agriculture and Agri-Food (2023).
Photo credits
All photographs reproduced in this publication are used by permission of the rights holders.
All images, unless otherwise noted, are copyright His Majesty the King in Right of Canada.
To join our distribution list or to suggest additional report topics or markets, please contact:
Agriculture and Agri-Food Canada, Global Analysis1341 Baseline Rd, Tower 5, 3rd floor
Ottawa ON K1A 0C5
Canada
Email: aafc.mas-sam.aac@agr.gc.ca
The Government of Canada has prepared this report based on primary and secondary sources of information. Although every effort has been made to ensure that the information is accurate, Agriculture and Agri-Food Canada (AAFC) assumes no liability for any actions taken based on the information contained herein.
Reproduction or redistribution of this document, in whole or in part, must include acknowledgement of agriculture and agri-food Canada as the owner of the copyright in the document, through a reference citing AAFC, the title of the document and the year. Where the reproduction or redistribution includes data from this document, it must also include an acknowledgement of the specific data source(s), as noted in this document.
Agriculture and Agri-Food Canada provides this document and other report services to agriculture and food industry clients free of charge.