

Note: This report includes forecasting data that is based on baseline historical data.
Executive summary
Sweet spreads are a market grouping that includes honey, peanut and other nut butters, jams and preserves, chocolate, caramel or other spreads, and syrup. The United States (US) imported US$ 5.1 billion in sweet spreads from the world in 2022, which made it the leading importer of such products in that year, with three times as many imports as the next most important importer, Germany. The US's leading import partners were Mexico, Canada and Germany.
US$ 5.4 billion of sweet spreads were sold in US retail outlets in 2022, representing 704.5 million tonnes. The foodservice volume of sweet spreads was just under half of the retail volume. Growth is projected for both retail and foodservice sales through 2027.
Sweet spreads in the US tend to have consolidated market shares within their segments or subsegments thanks to high brand recognition. Private label products are nonetheless quite popular, and their popularity is increasing, with 4.9% compound annual growth rate (CAGR) from 2017 to 2022, compared to 3.8% for sweet spreads in general.
Between 2018 and 2022, 2,067 new sweet spread products were launched in the United States. Diet-adapted and natural products were the predominant new launch type. Private label products were an important source of new launches.
Trade performance
The United States imported US$ 5.1 billion in sweet spreads, honey, maple products and peanut butter in 2022, with a total volume of 1.5 billion kilograms (excluding the volume of molasses, measured in litres). The United States' three largest import partners were Mexico (US$ 1.2 billion), Canada (US$ 947 million) and Germany (US$ 291 million).
| HS code | Description | Value | Volume | Top import markets and value share in % | ||
|---|---|---|---|---|---|---|
| 1 | 2 | 3 | ||||
| Total - global imports | 5,076.2 | 1,510.4[a] | Mexico: 23.6 | Canada: 18.7 | Germany: 5.7 | |
| 170490 | Sugar confectionery not containing cocoa, including white chocolate | 2,852.9 | 866.2 | Mexico: 36.0 | Canada: 17.2 | Germany: 9.8 |
| 040900 | Natural honey | 795.1 | 205.7 | India: 27.7 | Argentina: 20.8 | Brazil: 14.1 |
| 200799 | Jams, jellies, marmalades, purées or pastes of fruit, non-homogenized | 566.0 | 258.4 | France: 17.2 | Chile: 16.7 | Canada: 10.8 |
| 170220 | Maple sugar, in solid form, and maple syrup | 293.0 | 44.6 | Canada: 100.0 | Germany: 0.0 | Mexico: 0.0 |
| 170310 | Cane molasses resulting from the extraction or refining of sugar | 202.8 | 679.9[b] | El Salvador: 22.0 | Guatemala: 15.4 | Nicaragua: 13.6 |
| 170290 | Sugars in solid form,(excluding cane or beet sugar, chemically pure sucrose, lactose, maple sugar, glucose, fructose, and syrups thereof) | 179.9 | 73.0 | Indonesia: 22.1 | Netherlands: 15.1 | Canada: 7.7 |
| 200811 | Peanut butter and other peanut preparations | 147.2 | 50.6 | Canada: 38.5 | Mexico: 36.2 | Argentina: 13.8 |
| 200710 | Jams, jellies, marmalades, purées or pastes of fruit, homogenized | 26.3 | 7.6 | Chile: 61.5 | Mexico: 21.5 | Colombia: 3.6 |
| 200791 | Citrus fruit jams, jellies, marmalades, purées or pastes | 13.2 | 4.4 | France: 32.2 | Canada: 13.8 | Poland: 13.3 |
|
Source: Global Trade Tracker, 2023 a: Excludes cane molasses b: Measured in millions of litres, not by weight |
||||||
Canada's reported exports of sweet spreads to the United States totaled US$ 978 million in 2022, representing 4.9% CAGR from 2018 to 2022. The leading export products were sugar confectionary (US$ 507 million in 2022), maple sugar and syrup (US$ 293 million in 2022), and non-homogenized jams and jellies (US$ 63 million in 2022).
| HS code | Description | 2018 | 2019 | 2020 | 2021 | 2022 | CAGR* % 2018-2022 |
|---|---|---|---|---|---|---|---|
| Total - exports to the United States | 807,986.5 | 743,071.6 | 745,945.7 | 834,110.3 | 978,444.7 | 4.9 | |
| 170490 | Sugar confectionery not containing cocoa, incl. white chocolate | 454,453.4 | 401,691.7 | 376,718.7 | 410,750.2 | 507,456.4 | 2.8 |
| 040900 | Natural honey | 48,859.0 | 25,773.7 | 14,867.3 | 14,306.4 | 30,040.8 | −11.5 |
| 200799 | Jams, jellies, marmalades, purées or pastes of fruit, non-homogenized | 38,663.1 | 43,858.9 | 53,148.9 | 50,804.8 | 63,070.7 | 13.0 |
| 170220 | Maple sugar, in solid form, and maple syrup | 193,205.5 | 200,951.7 | 226,644.9 | 278,011.7 | 292,929.8 | 11.0 |
| 170310 | Cane molasses resulting from the extraction or refining of sugar | 2,293.9 | 3,296.2 | 3,941.5 | 7,427.9 | 7,299.7 | 33.6 |
| 170290 | Sugars in solid form,(excl. cane or beet sugar, chemically pure sucrose, lactose, maple sugar, glucose, fructose, and syrups thereof) | 9,050.1 | 7,645.1 | 8,379.1 | 13,815.1 | 19,080.2 | 20.5 |
| 200811 | Peanut butter and other peanut preparations | 60,574.7 | 59,153.8 | 61,055.2 | 58,436.4 | 56,703.5 | −1.6 |
| 200710 | Jams, jellies, marmalades, purées or pastes of fruit, homogenized | 178.8 | 5.9 | 29.5 | 50.9 | 51.0 | −26.9 |
| 200791 | Citrus fruit jams, jellies, marmalades, purées or pastes | 708.0 | 694.7 | 1,160.6 | 506.8 | 1,812.7 | 26.5 |
|
Source: Global Trade Tracker, 2023 *CAGR: Compound Annual Growth Rate |
|||||||
Market sizes
Retail sales of sweet spreads in the United States grew in value by 3.8% CAGR from 2017 to 2022. All categories of products experienced growth, with honey having the highest growth among categories at 5.7%. Nut and seed-based spreads had the highest absolute growth over this period, at US$ 452.2 million.
The volume of sweet spreads sold in the United States experienced almost no growth between 2017 and 2022, which indicates that the growth in retail sales was driven by an increase in the value of products sold. The volume of jams and preserves sold actually shrank by 2.0% CAGR from 2017 to 2022. All other product categories increased slightly, with chocolate spreads having the highest growth rate at 1.3% CAGR (but low absolute growth).
| Category | 2017 | 2022 | CAGR* % 2017-2022 | 2023 | 2027 | CAGR* % 2022-2027 |
|---|---|---|---|---|---|---|
| Sweet spreads | 4,530.0 | 5,448.9 | 3.8 | 5,707.9 | 6,768.4 | 4.4 |
| Honey | 712.8 | 940.3 | 5.7 | 980.7 | 1,156.0 | 4.2 |
| Chocolate spreads | 424.9 | 551.9 | 5.4 | 580.4 | 663.7 | 3.8 |
| Jams and preserves | 1,063.4 | 1,175.7 | 2.0 | 1,240.6 | 1,408.3 | 3.7 |
| Nut and seed based spreads | 2,328.8 | 2,781.0 | 3.6 | 2,906.1 | 3,540.4 | 4.9 |
|
Source: Euromonitor International, 2023 *CAGR: Compound Annual Growth Rate |
||||||
| Category | 2017 | 2022 | CAGR* % 2017-2022 | 2023 | 2027 | CAGR* % 2022-2027 |
|---|---|---|---|---|---|---|
| Sweet spreads | 704.0 | 704.5 | 0.0 | 712.0 | 769.5 | 1.8 |
| Honey | 45.4 | 48.0 | 1.1 | 48.2 | 50.2 | 0.9 |
| Chocolate spreads | 42.9 | 45.8 | 1.3 | 46.6 | 47.7 | 0.8 |
| Jams and preserves | 209.8 | 197.6 | −1.2 | 201.6 | 207.3 | 1.0 |
| Nut and seed based spreads | 405.9 | 413.1 | 0.4 | 415.6 | 464.4 | 2.4 |
|
Source: Euromonitor International, 2023 *CAGR: Compound Annual Growth Rate |
||||||
The volume of foodservice sales of sweet spreads fell in the United States from 2017 to 2022, with the greatest decrease coming in 2020 with the COVID-19 pandemic. Partial recovery is forecasted through 2027, with growth being driven by jams and preserves. Chocolate spreads are the fastest-growing category, but they are not used extensively in foodservice.
| Category | 2017 | 2022 | CAGR* % 2017-2022 | 2023 | 2027 | CAGR* % 2022-2027 |
|---|---|---|---|---|---|---|
| Sweet spreads | 352.4 | 318.6 | −2.0 | 327.9 | 347.0 | 1.7 |
| Honey | 16.2 | 16.7 | 0.6 | 17.2 | 18.4 | 2.0 |
| Chocolate spreads | 0.8 | 1.0 | 4.5 | 1.2 | 1.5 | 7.9 |
| Jams and preserves | 298.0 | 262.8 | −2.5 | 270.4 | 285.2 | 1.6 |
| Nut and seed based spreads | 37.4 | 38.0 | 0.3 | 39.1 | 41.9 | 2.0 |
|
Source: Euromonitor International, 2023 *CAGR: Compound Annual Growth Rate |
||||||
Competitive landscape
The sweet spreads landscape in the United States is very concentrated: JM Smucker, the largest company, had a 34.5% market share thanks to its Jif (peanut butter) and Smucker's (fruit jam) brands. Private labels are fairly present, at 22.1% market share in 2022, and they have been increasing in popularity, with 4.9% CAGR in sales value from 2018 to 2022.
Each category of sweet spreads has a leading brand: Jif peanut butter leads nut and seed-based spreads (followed by Skippy), Smucker's is the leading jam or preserve brand, Nutella is the leading chocolate spread, and Sue Bee leads among honey brands.
| Company | 2017 | 2018 | 2019 | 2020 | 2021 | 2022 | CAGR* % 2017-2022 |
|---|---|---|---|---|---|---|---|
| Total | 100 | 100 | 100 | 100 | 100 | 100 | 3.8 |
| The JM Smucker Co | 30.8 | 31.6 | 32.4 | 32.3 | 34.2 | 34.5 | 6.1 |
| Hormel Foods Corp | 8.1 | 8.1 | 8.1 | 8.0 | 8.7 | 9.0 | 5.9 |
| Ferrero USA Inc | 6.6 | 6.6 | 6.6 | 6.5 | 7.5 | 7.6 | 6.8 |
| Sioux Honey Association | 4.0 | 4.3 | 4.5 | 4.9 | 4.6 | 4.5 | 6.3 |
| Justin's LLC | 2.3 | 2.6 | 3.0 | 3.0 | 3.1 | 3.0 | 9.2 |
| ConAgra Brands Inc | 3.9 | 3.6 | 3.2 | 2.9 | 3.1 | 3.0 | −1.6 |
| Andros Foods USA Inc | 2.2 | 2.3 | 2.4 | 2.5 | 2.6 | 2.4 | 5.9 |
| Welch Foods Inc | 3.4 | 3.3 | 3.2 | 3.2 | 2.8 | 2.4 | −3.1 |
| The Hain Celestial Group Inc | 1.9 | 1.7 | 1.6 | 1.4 | 1.5 | 1.3 | −3.6 |
| B & G Foods Inc | 0.9 | 0.9 | 0.9 | 0.8 | 0.8 | 0.8 | 0.3 |
| Private label | 20.9 | 21.5 | 22.3 | 21.8 | 21.5 | 22.1 | 4.9 |
| Others | 15.0 | 13.5 | 11.8 | 12.7 | 9.6 | 9.4 | −5.7 |
|
Source: Euromonitor International Limited, 2023, all rights reserved *CAGR: Compound Annual Growth Rate |
|||||||
| Brand | 2017 | 2018 | 2019 | 2020 | 2021 | 2022 | CAGR* % 2017-2022 |
|---|---|---|---|---|---|---|---|
| Total | 100 | 100 | 100 | 100 | 100 | 100 | 3.8 |
| Jif (JM Smucker Co) | 17.1 | 17.6 | 18.1 | 18.0 | 20.2 | 21.2 | 8.3 |
| Smucker's (JM Smucker Co) | 9.5 | 9.7 | 9.9 | 9.9 | 9.5 | 9.2 | 3.2 |
| Skippy (Hormel Foods Corp) | 8.1 | 8.1 | 8.1 | 8.0 | 8.7 | 9.0 | 5.9 |
| Nutella (Ferrero & related parties) | 6.6 | 6.6 | 6.6 | 6.5 | 7.5 | 7.6 | 6.8 |
| Sue Bee (Sioux Honey Association) | 4.0 | 4.3 | 4.5 | 4.9 | 4.6 | 4.5 | 6.3 |
| Justin's (Hormel Foods Corp) | 2.3 | 2.6 | 3.0 | 3.0 | 3.1 | 3.0 | 9.2 |
| Peter Pan (Post Holdings Inc)[1] | 3.9 | 3.6 | 3.2 | 2.9 | 3.1 | 3.0 | N/C |
| Bonne Maman (Andros SAS) | 2.2 | 2.3 | 2.4 | 2.5 | 2.6 | 2.4 | 5.9 |
| Welch's (National Grape Co-op Association Inc) | 3.0 | 2.9 | 2.8 | 2.9 | 2.5 | 2.1 | −3.2 |
| Maranatha (Hain Celestial Group) | 1.9 | 1.7 | 1.6 | 1.4 | 1.5 | 1.3 | −3.6 |
| Private label | 20.9 | 21.5 | 22.3 | 21.8 | 21.5 | 22.1 | 4.9 |
| Others | 20.5 | 19.1 | 17.5 | 18.2 | 15.2 | 14.6 | 4.0 |
|
Source: Euromonitor International Limited, 2023, all rights reserved *CAGR: Compound Annual Growth Rate 1: Peter Pan was manufactured by ConAgra prior to 2021. CAGR growth was not calculated due to this change. |
|||||||
Distribution channels
Most sweet spreads were sold through grocery stores in 2022, with 80.5% of sales by value, representing 95.5% of total offline retail sales. Retail E-commerce has grown significantly, however. 15.7% of sweet spread sales in the US occurred through E-commerce channels in 2022, up from 4.5% in 2017. The value of E-commerce retail sales increased by 33.2% CAGR between 2017 and 2022.
| Outlet Type | 2017 | 2018 | 2019 | 2020 | 2021 | 2022 | CAGR* % 2018-2022 |
|---|---|---|---|---|---|---|---|
| Total | 100 | 100 | 100 | 100 | 100 | 100 | 3.8 |
| Retail Offline | 95.5 | 94.7 | 91.9 | 86.9 | 84.9 | 84.3 | 1.2 |
| Grocery Retailers | 90.7 | 89.9 | 87.2 | 82.6 | 80.8 | 80.5 | 1.3 |
| Convenience Retail | 0.6 | 0.6 | 0.5 | 0.3 | 0.4 | 0.4 | −3.9 |
| Supermarkets | 51.3 | 50.2 | 48.1 | 45.6 | 44.9 | 43.7 | 0.5 |
| Hypermarkets | 22.1 | 22.3 | 21.9 | 20.9 | 20.7 | 22.7 | 4.3 |
| Discounters | 2.7 | 2.8 | 2.7 | 2.6 | 2.9 | 2.4 | 1.3 |
| Warehouse Clubs | 11.4 | 11.5 | 11.5 | 10.9 | 9.8 | 9.4 | −0.1 |
| Small Local Grocers | 2.6 | 2.6 | 2.4 | 2.2 | 2.0 | 1.9 | −2.6 |
| Non-Grocery Retailers | 4.8 | 4.8 | 4.7 | 4.3 | 4.1 | 3.8 | −0.9 |
| General Merchandise Stores | 4.0 | 4.0 | 4.0 | 3.8 | 3.6 | 3.2 | −0.5 |
| Health and Beauty Specialists | 0.8 | 0.7 | 0.7 | 0.5 | 0.5 | 0.6 | −3.2 |
| Retail E-Commerce | 4.5 | 5.3 | 8.1 | 13.1 | 15.1 | 15.7 | 33.2 |
|
Source: Euromonitor International, 2023 *CAGR: Compound Annual Growth Rate |
|||||||
New product launches
According to data from the Mintel Global New Products Database, 2,096 sweet spread products were launched in the United States between 2018 and 2022. These were predominantly nut spreads as well as jam (confitures) and fruit spreads. Kosher, allergy-adapted and gluten free products predominated, with over half of products being kosher, 41.6% having low, no or reduced allergens, and 40.4% being gluten free in 2022. Natural claims were the two next most popular claims, with 34.2% of products being labelled GMO-free and 31.7% being organic in 2022.
Private labels are driving new product launches. In 2021, the Lidl, Target and Kroger grocery store chains accounted for 60 of the 512 total product launches.
| Product attributes | Yearly launch count | ||||
|---|---|---|---|---|---|
| 2018 | 2019 | 2020 | 2021 | 2022 | |
| Yearly product launches | 290 | 350 | 543 | 512 | 401 |
| Top five categories | |||||
| Nut Spreads | 91 | 93 | 201 | 205 | 105 |
| Confiture and Fruit Spreads | 78 | 109 | 136 | 104 | 100 |
| Honey | 50 | 71 | 84 | 77 | 74 |
| Syrups | 45 | 47 | 67 | 65 | 79 |
| Chocolate Spreads | 16 | 23 | 38 | 52 | 37 |
| Top five claims | |||||
| Kosher | 161 | 192 | 271 | 226 | 203 |
| Low/No/Reduced Allergen | 107 | 138 | 244 | 209 | 167 |
| Gluten Free | 103 | 129 | 233 | 195 | 162 |
| GMO Free | 77 | 111 | 189 | 168 | 137 |
| Organic | 48 | 74 | 148 | 93 | 127 |
| Launches by price group (US dollars) | |||||
| 0.77 - 4.76 | 130 | 133 | 148 | 141 | 96 |
| 4.77 - 8.76 | 78 | 99 | 121 | 135 | 99 |
| 8.77 - 12.76 | 32 | 60 | 120 | 59 | 72 |
| 12.77 - 16.76 | 31 | 42 | 96 | 122 | 59 |
| 16.77 - 24.00 | 6 | 11 | 31 | 38 | 53 |
| Top five launch types | |||||
| New Variety/Range Extension | 107 | 113 | 218 | 180 | 152 |
| New Product | 75 | 138 | 175 | 192 | 113 |
| New Packaging | 95 | 84 | 124 | 114 | 116 |
| Relaunch | 13 | 15 | 26 | 23 | 19 |
| New Formulation | 0 | 0 | 0 | 3 | 1 |
| Top five flavours (including blend) | |||||
| Unflavoured/Plain | 48 | 65 | 74 | 67 | 54 |
| Peanut Butter | 32 | 26 | 60 | 56 | 19 |
| Maple/Maple (Syrup) | 14 | 11 | 26 | 25 | 39 |
| Almond Butter | 19 | 18 | 24 | 24 | 17 |
| Hazelnut | 11 | 15 | 16 | 25 | 15 |
| Top five companies | |||||
| Lidl | 8 | 4 | 1 | 29 | 26 |
| Better Living Brands | 12 | 18 | 16 | 2 | 8 |
| Kroger | 14 | 1 | 10 | 22 | 6 |
| Target | 4 | 13 | 16 | 9 | 6 |
| J.M. Smucker | 9 | 9 | 14 | 7 | 6 |
| Source: Mintel Global New Products Database, 2023, all rights reserved | |||||
Examples of new product launches
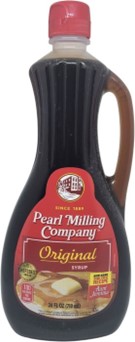
Original Syrup
Source: Mintel Global New Product Database, 2023, all rights reserved
| Company | Quaker Oats Company |
|---|---|
| Brand | Pearl Milling Company |
| Sub-category | Syrups |
| Market | United States |
| Store name | Publix |
| Store type | Supermarket |
| Date published | June 2023 |
| Product source | Shopper |
| Launch type | New packaging |
| Price in US dollars | 4.65 |
Pearl Milling Company Original Syrup has been repackaged, and retails in a newly designed 24 fluid ounce pack. Logos and certifications: Kosher.
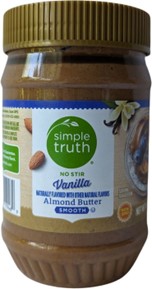
No Stir Smooth Vanilla Almond Butter
Source: Mintel Global New Product Database, 2023, all rights reserved
| Company | Kroger |
|---|---|
| Brand | Simple Truth Free From |
| Sub-category | Nut spreads |
| Market | United States |
| Store name | Fred Meyer |
| Store type | Supermarket |
| Date published | August 2023 |
| Product source | Shopper |
| Launch type | New variety / range extension |
| Price in US dollars | 5.79 |
Simple Truth Free From No Stir Smooth Vanilla Almond Butter is now available, and retails in a 16 ounce pack. Naturally flavored with other natural flavors, non GMO. Logos and certifications: Kosher
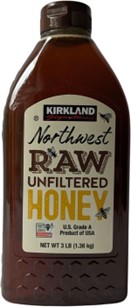
Northwest Raw Unfiltered Honey
Source: Mintel Global New Product Database, 2023, all rights reserved
| Company | Costco Wholesale |
|---|---|
| Brand | Kirkland Signature |
| Sub-category | Honey |
| Market | United States |
| Import status | Not imported |
| Store type | Club store |
| Date published | September 2023 |
| Product source | Shopper |
| Launch type | New variety / range extension |
| Price in US dollars | 13.49 |
Kirkland Signature Northwest Raw Unfiltered Honey is now available, and retails in a 3 pound pack. U.S. grade A. Logos and certifications: Kosher, True Source Certified.
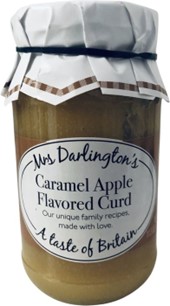
Caramel Apple Flavored Curd
Source: Mintel Global New Product Database, 2023, all rights reserved
| Company | Darlington & Daughters |
|---|---|
| Brand | Mrs Darlington's |
| Category | Sweet spreads |
| Sub-category | Confiture and fruit spreads |
| Market | United States |
| Location of manufacture | United Kingdom |
| Import status | Imported product |
| Store name | Cost Plus World Market |
| Store type | Supermarket |
| Date published | November 2022 |
| Product source | Shopper |
| Launch type | New variety / range extension |
| Price in US dollars | 7.99 |
Mrs Darlington's Caramel Apple Flavored Curd is now available, and retails in a 11.3 ounce pack. Claims: ethically sourced and sustainable palm and palm kernel oil.
For more information
The Canadian Trade Commissioner Service:
International Trade Commissioners can provide Canadian industry with on-the-ground expertise regarding market potential, current conditions and local business contacts, and are an excellent point of contact for export advice.
More agri-food market intelligence:
International agri-food market intelligence
Discover global agriculture and food opportunities, the complete library of Global Analysis reports, market trends and forecasts, and information on Canada's free trade agreements.
Agri-food market intelligence service
Canadian agri-food and seafood businesses can take advantage of a customized service of reports and analysis, and join our email subscription service to have the latest reports delivered directly to their inbox.
More on Canada's agriculture and agri-food sectors:
Canada's agriculture sectors
Information on the agriculture industry by sector. Data on international markets. Initiatives to support awareness of the industry in Canada. How the department engages with the industry.
For additional information on the Private Label Manufacturers Association's annual trade show, please contact:
Chris Bigall
Trade Commissioner
chris.bigall@international.gc.ca
Resources
- Euromonitor International, 2023
- Sweet Spreads in the US, Euromonitor International, December 2022
- Global Trade Tracker, 2023
- Mintel Global New Products Database, 2023
Sector Trend Analysis – Sweet spreads in the United States
Global Analysis Report
Prepared by: Alexandre Holm Perrault, Market Analyst
© His Majesty the King in Right of Canada, represented by the Minister of Agriculture and Agri-Food (2023).
Photo credits
All photographs reproduced in this publication are used by permission of the rights holders.
All images, unless otherwise noted, are copyright His Majesty the King in Right of Canada.
To join our distribution list or to suggest additional report topics or markets, please contact:
Agriculture and Agri-Food Canada, Global Analysis1341 Baseline Rd, Tower 5, 3rd floor
Ottawa ON K1A 0C5
Canada
Email: aafc.mas-sam.aac@agr.gc.ca
The Government of Canada has prepared this report based on primary and secondary sources of information. Although every effort has been made to ensure that the information is accurate, Agriculture and Agri-Food Canada (AAFC) assumes no liability for any actions taken based on the information contained herein.
Reproduction or redistribution of this document, in whole or in part, must include acknowledgement of agriculture and agri-food Canada as the owner of the copyright in the document, through a reference citing AAFC, the title of the document and the year. Where the reproduction or redistribution includes data from this document, it must also include an acknowledgement of the specific data source(s), as noted in this document.
Agriculture and Agri-Food Canada provides this document and other report services to agriculture and food industry clients free of charge.