

Note: This report includes forecasting data that is based on baseline historical data.
Executive summary
Confectionary sales grew 10.3% annually over 2019 to 2023 supported by the strong performance of chocolate confectionery. Post-pandemic, demand for chocolate confectionery was driven by the stronger return to celebratory and festive occasions.
Sugar confectionary sales growth has partly been driven by rising prices due to higher inflation and input costs.
High sugar content in confectionery is facing growing challenges in India, primarily due to increasingly health-conscious consumers. Some states in India have implemented or are considering implementing sugar taxes on sugary beverages and high-sugar foods. Given the high smoking rates in India, demand for gum is anticipated to remain fairly stable as smokers use gum to conceal tobacco odour.
India's food retail sector is divided into modern channels and traditional channels with traditional channels making up 81% of all offline retail. Over 2019 to 2023, ecommerce showed the highest growth in sales and is expected to continue growing at the expense of offline channels.
Most new confectionary products claims between 2019 to 2023 were vegetarian, environmentally based, and "no/low" claims, which suggests that consumers prefer ethical and healthy confectionary. Top flavours included plain, orange, and almond.
Market overview
Confectionary sales grew 10.3% annually over 2019 to 2023 supported by the strong performance of chocolate confectionery and with all categories seeing sales growing. Post-pandemic, demand for chocolate confectionery was driven by the stronger return to celebratory and festive occasions.
Sugar confectionary sales growth has partly been driven by rising prices due to higher inflation and input costs. With changing consumer demands, industry players are focusing on building premium portfolios by either introducing novel products or options with healthier claims to drive growth.
High sugar content in confectionery is facing growing challenges in India, primarily due to increasingly health-conscious consumers. Some states in India have implemented or are considering implementing sugar taxes on sugary beverages and high-sugar foods. In response, industry players are reformulating their products to reduce sugar content and exploring healthier alternatives to remain competitive in a market that is increasingly focused on health and wellbeing.
| Category | 2019 | 2023 | CAGR* % 2019-2023 | 2024 | 2028 | CAGR* % 2024-2028 |
|---|---|---|---|---|---|---|
| Confectionery | 5,594.6 | 8,277.4 | 10.3 | 9,062.5 | 12,434.5 | 8.2 |
| Chocolate confectionery | 1,484.4 | 2,429.8 | 13.1 | 2,720.4 | 4,018.4 | 10.2 |
| Chocolate pouches and bags | 152.1 | 250.6 | 13.3 | 287.6 | 458.0 | 12.3 |
| Boxed assortments | 73.7 | 123.5 | 13.8 | 139.5 | 222.1 | 12.3 |
| Chocolate with toys | 163.4 | 242.3 | 10.3 | 265.2 | 379.3 | 9.4 |
| Countlines | 418.2 | 707.6 | 14.1 | 788.4 | 1,109.0 | 8.9 |
| Tablets | 676.7 | 1,096.8 | 12.8 | 1,226.5 | 1,812.5 | 10.3 |
| Other chocolate confectionery | 0.3 | 9.1 | 138.9 | 13.2 | 37.5 | 29.9 |
| Gum | 218.7 | 257.9 | 4.2 | 268.3 | 301.6 | 3.0 |
| Bubble gum | 127.9 | 148.5 | 3.8 | 154.2 | 169.3 | 2.4 |
| Chewing gum | 90.7 | 109.4 | 4.8 | 114.1 | 132.4 | 3.8 |
| Sugar confectionery | 1,094.2 | 1,450.9 | 7.3 | 1,542.6 | 1,897.2 | 5.3 |
| Boiled sweets | 168.8 | 218.4 | 6.7 | 230.8 | 278.7 | 4.8 |
| Lollipops | 21.1 | 27.1 | 6.5 | 28.3 | 32.4 | 3.4 |
| Medicated confectionery | 91.1 | 118.6 | 6.8 | 124.2 | 144.7 | 3.9 |
| Mints | 127.6 | 152.8 | 4.6 | 159.8 | 185.8 | 3.8 |
| Pastilles, gummies, jellies and chews | 136.3 | 207.4 | 11.1 | 230.6 | 336.7 | 9.9 |
| Toffees, caramels and nougat | 549.4 | 726.7 | 7.2 | 768.8 | 918.9 | 4.6 |
|
Source: Euromonitor International, 2024 *CAGR: Compound annual growth rate |
||||||
| Brand (company) | 2018 | 2019 | 2020 | 2021 | 2022 | CAGR* % 2018-2022 |
|---|---|---|---|---|---|---|
| Cadbury Dairy Milk (Mondelez International Inc) | 455.3 | 462.0 | 537.6 | 650.6 | 804.4 | 15.3 |
| Cadbury (Mondelez International Inc) | 398.3 | 421.0 | 499.7 | 594.7 | 709.9 | 15.5 |
| Kit Kat (Nestlé SA) | 72.1 | 79.6 | 101.1 | 131.2 | 165.0 | 23.0 |
| Kinder (Ferrero & related parties) | 124.4 | 106.1 | 109.7 | 132.8 | 158.0 | 6.2 |
| Parle (Parle Products Pvt Ltd) | 122.8 | 129.7 | 139.0 | 148.2 | 157.6 | 6.4 |
| Munch (Nestlé SA) | 69.8 | 76.4 | 97.0 | 118.5 | 141.2 | 19.3 |
| Candyman (ITC Group) | 123.2 | 127.1 | 131.2 | 134.6 | 138.9 | 3.1 |
| Alpenliebe (Perfetti Van Melle Group) | 67.1 | 58.7 | 72.7 | 81.5 | 89.5 | 7.5 |
| Kismi (Parle Products Pvt Ltd) | 51.6 | 55.4 | 59.3 | 64.0 | 68.1 | 7.2 |
| Center Fruit (Perfetti Van Melle Group) | 63.9 | 55.3 | 61.4 | 65.3 | 68.0 | 1.6 |
| Others | 641.8 | 678.0 | 723.9 | 785.0 | 826.6 | 6.5 |
|
Source: Euromonitor International, 2024 *CAGR: Compound annual growth rate |
||||||
Chocolate confectionary
Within confectionary, chocolate confectionary sales grew fastest by 13.1% annually with sub category sales growth in double digits. Other chocolate confectionary is expected to grow fastest over 2024 to 2028 by 29.9% over the next five years. Higher demand for chocolate confectionery is supported by the rise in celebrations and gifting occasions combined with the fact that chocolate is emerging in India as a popular dessert to consume after meals. In addition, increasingly health-conscious consumers are favouring chocolate confectionery over sugar confectionary, due to perceptions of it being a healthier alternative to sugar confectionery.
According to Euromonitor, per capita consumption of chocolate confectionery in India in 2023 is only 7% of consumption in the U.S. and 10% of consumption in the UK. Generally, chocolate confectionery in India is primarily focused on gifting, festive and celebration occasions. The festive/gift giving season in India, which covers Durga Puja, Deepavali, Christmas and Onam, all falling in the third and fourth quarters of the year, is the time of year when chocolate and confectionery see a steep rise in sales.
Chocolate confectionery is gaining momentum with innovative new formats, flavours and textures. For example, to generate more regular consumption occasions, players are focusing on launching newer variants aimed at creating new positionings. For example, the Mondelez chocolate brand, Cadbury Dairy Milk Silk, enjoys strong brand equity in premium chocolate confectionery with the launch of a new variant, Ganache, in 2023 and positioned it as premium dessert. Ganache has origins in France, where it is considered a luxury dessert.
| Brand (company) | 2019 | 2020 | 2021 | 2022 | 2023 | CAGR* % 2019-2023 |
|---|---|---|---|---|---|---|
| Cadbury Dairy Milk (Mondelez International Inc) | 455.3 | 462.0 | 537.6 | 650.6 | 804.4 | 15.3 |
| Cadbury (Mondelez International Inc) | 323.3 | 339.7 | 411.2 | 498.6 | 605.7 | 17.0 |
| Kit Kat (Nestlé SA) | 72.1 | 79.6 | 101.1 | 131.2 | 165.0 | 23.0 |
| Kinder (Ferrero & related parties) | 124.4 | 106.1 | 109.7 | 132.8 | 158.0 | 6.2 |
| Munch (Nestlé SA) | 69.8 | 76.4 | 97.0 | 118.5 | 141.2 | 19.3 |
| Nestlé (Nestlé SA) | 42.3 | 44.0 | 49.7 | 56.8 | 63.8 | 10.8 |
| Snickers (Mars Inc) | 30.8 | 25.8 | 28.8 | 34.0 | 39.4 | 6.3 |
| Brookside (Hershey Co, The) | 18.3 | 18.3 | 21.1 | 24.0 | 26.7 | 9.9 |
| LuvIt (Global Consumer Products Pvt Ltd) | 18.6 | 20.3 | 22.1 | 24.2 | 26.2 | 8.9 |
| Amul (Gujarat Co-operative Milk Marketing Federation Ltd) | 16.8 | 17.9 | 19.6 | 22.9 | 26.1 | 11.6 |
| Others | 264.7 | 265.8 | 287.6 | 296.1 | 301.0 | 3.3 |
|
Source: Euromonitor International, 2024 *CAGR: Compound annual growth rate |
||||||
Sugar confectionary
Sugar confectionary sales increased by 3.6% annually over 2019 to 2023 with all categories seeing sales growth. Sales are expected to grow by 2.3% over 2024 to 2028. Sugar confectionary sales growth has partly been driven by rising prices due to higher inflation and input costs. With changing consumer demands, players are focusing on building premium portfolios by either introducing novel products or options with healthier claims to drive growth.
Toffees, caramels and nougat dominate sugar confectionary, representing almost half the category. Boiled sweets, mints, pastilles, gummies, jellies, and chews bring innovative alternatives in terms of product format, healthier alternative perspective and interesting flavours.
According to Euromonitor, mints with a functional positioning and healthier claims are expected to gain greater prominence over 2024 to 2028 as consumers become increasingly health-conscious. Mint-based sugar confectionery in India is increasingly formulated with functional ingredients such as vitamins, minerals, herbs, antioxidants, probiotics, and more. These ingredients are chosen for their potential health benefits, which can range from improved oral health and digestion to stress relief and energy enhancement. Functional mints are expected to gain greater resonance as disposable incomes in India are set to rise over 2024 to 2028.
Major players in mints are often associated with oral health, such as freshening breath and promoting dental hygiene. For example, Falero has introduced fruit-based chews, which are perceived as a healthier option compared to traditional toffees, which are often associated with high sugar content or artificial flavours. Falero's claim of using real fruit pulp and natural flavours appeals to consumers looking for healthier confectionery snacks, and thus pastilles, gummies, jellies, and chews is gaining prominence.
| Brand (company) | 2019 | 2020 | 2021 | 2022 | 2023 | CAGR* % 2019-2023 |
|---|---|---|---|---|---|---|
| Parle (Parle Products Pvt Ltd) | 122.8 | 129.7 | 139.0 | 148.2 | 157.6 | 6.4 |
| Candyman (ITC Group) | 123.2 | 127.1 | 131.2 | 134.6 | 138.9 | 3.1 |
| Cadbury (Mondelez International Inc) | 75.0 | 81.4 | 88.4 | 96.2 | 104.2 | 8.5 |
| Alpenliebe (Perfetti Van Melle Group) | 67.1 | 58.7 | 72.7 | 81.5 | 89.5 | 7.5 |
| Kismi (Parle Products Pvt Ltd) | 51.6 | 55.4 | 59.3 | 64.0 | 68.1 | 7.2 |
| Falero (Mapro Foods Pvt Ltd) | 42.0 | 46.2 | 53.1 | 60.4 | 67.0 | 12.4 |
| Mint-O (ITC Group) | 54.6 | 56.6 | 57.7 | 60.7 | 62.7 | 3.5 |
| Vicks (Procter & Gamble Co, The) | 43.3 | 45.8 | 49.0 | 52.3 | 55.4 | 6.4 |
| Eclairs (Nestlé SA) | 27.0 | 27.8 | 31.2 | 34.3 | 37.4 | 8.5 |
| Pulse (DS Group) | 26.2 | 25.3 | 30.1 | 33.2 | 36.4 | 8.6 |
| Others | 335.3 | 355.6 | 377.3 | 426.8 | 462.0 | 8.3 |
|
Source: Euromonitor International, 2024 *CAGR: Compound annual growth rate |
||||||
Gum
Gum sales increased by 4.2% annually over 2019 to 2023 with sales expected to grow by 3.0% annually over 2024 to 2028. In India, chewing gum and bubble gum traditionally have a strong correlation with the smoking population, as smokers use gum to conceal tobacco odour. Given the high smoking rates in the country, demand for gum is anticipated to remain fairly stable.
According to Euromonitor, high inflation, sugar and sweetner price volatility, energy price volatility, and supply chain disruptions have significantly impacted production costs and profitability of gum in India. This is expected to continue over 2024 to 2028. Givern that gum in India is highly dependent on volume sales, going forward, it is expected that major players will look to create premium flavours and new product formats to drive profits. However, the challenge is expected to be how to scale these higher value products, given the high price-sensitivity for the category.
The sale of oral care products designed for refreshment, including mouthwashes/dental rinses and mouth fresheners, is expected to grow steadily over the forecast period. These oral care products are gaining prominence with qualities such as portability, an array of appealing flavours, and are considered more suitable for use in office environments, where chewing gum might be regarded as impolite.
| Brand (company) | 2019 | 2020 | 2021 | 2022 | 2023 | CAGR* % 2019-2023 |
|---|---|---|---|---|---|---|
| Center Fruit (Perfetti Van Melle Group) | 63.9 | 55.3 | 61.4 | 65.3 | 68.0 | 1.6 |
| Center Fresh (Perfetti Van Melle Group) | 59.7 | 53.2 | 59.5 | 64.1 | 67.0 | 2.9 |
| Big Babol (Perfetti Van Melle Group) | 25.0 | 21.8 | 23.1 | 24.8 | 27.2 | 2.1 |
| Boomer (Mars Inc) | 13.3 | 12.9 | 14.2 | 15.3 | 16.0 | 4.7 |
| Happydent (Perfetti Van Melle Group) | 11.4 | 9.8 | 10.9 | 11.6 | 12.3 | 2.0 |
| Extra/Orbit (Mars Inc) | 4.0 | 3.9 | 4.0 | 4.1 | 4.5 | 3.0 |
| Bubbaloo (Mondelez International Inc) | 3.2 | 3.2 | 3.3 | 3.5 | 3.6 | 3.1 |
| Gumon (ITC Group) | 1.7 | 1.7 | 1.8 | 1.9 | 2.0 | 4.9 |
| Chlor-Mint (Perfetti Van Melle Group) | 1.6 | 1.4 | 1.6 | 1.8 | 1.9 | 3.5 |
| Candico (Candico India Ltd) | 1.6 | 1.6 | 1.6 | 1.7 | 1.7 | 0.6 |
| Others | 31.9 | 46.8 | 48.7 | 51.3 | 52.2 | 13.1 |
|
Source: Euromonitor International, 2024 *CAGR: Compound annual growth rate |
||||||
Retail channels
India's food retail sector is divided into modern channels (hypermarkets, supermarkets, cash and carry stores, and e-retail) and traditional channels (Kirana stores, mobile pushcarts, kiosks, and independent vendors) with traditional channels making up 81% of all offline retail.
Over 2019 to 2023, ecommerce showed the highest sales growth and is expected to continue growing at the expense of offline channels. Offline channels, which accounted for almost 100% of total sales in 2023, experienced a 9.7% annual increase in sales, while ecommerce saw a 53.4% annual increase in sales. Super and hypermarkets were the fastest growing offline channel at 11.7% annually over 2019 to 2023.
Due to more stringent health and safety regulations, leading to higher demand for hygienic and sanitised outlets, packaged products and digital payments, traditional outlets were negatively impacted during the pandemic. This shift towards modern formats is expected to continue over the forecast period.
| Outlet type | 2019 | 2020 | 2021 | 2022 | 2023 | CAGR* % 2019-2023 |
|---|---|---|---|---|---|---|
| Retail Ooffline | 2,774.6 | 2,816.7 | 3,139.6 | 3,553.8 | 4,012.7 | 9.7 |
| Grocery retailers | 2,717.0 | 2,756.4 | 3,073.4 | 3,480.8 | 3,934.0 | 9.7 |
| Convenience retail | 24.1 | 24.3 | 27.2 | 30.6 | 34.2 | 9.1 |
| Convenience stores | 13.4 | 14.2 | 15.3 | 16.7 | 18.1 | 7.7 |
| Forecourt retailers | 10.6 | 10.1 | 11.9 | 13.8 | 16.1 | 10.8 |
| Supermarkets | 166.3 | 169.8 | 193.1 | 223.3 | 258.7 | 11.7 |
| Hypermarkets | 157.9 | 164.3 | 186.5 | 214.2 | 245.4 | 11.7 |
| Food/drink/tobacco specialists | 115.0 | 112.1 | 118.6 | 130.2 | 141.1 | 5.2 |
| Small local grocers | 2,253.9 | 2,285.8 | 2,548.1 | 2,882.6 | 3,254.8 | 9.6 |
| Non-grocery retailers | 57.6 | 60.3 | 66.2 | 73.0 | 78.6 | 8.1 |
| Health and beauty specialists | 57.6 | 60.3 | 66.2 | 73.0 | 78.6 | 8.1 |
| Retail E-commerce | 22.7 | 38.0 | 63.8 | 95.6 | 126.0 | 53.4 |
| Total | 2,797.3 | 2,854.7 | 3,203.5 | 3,649.5 | 4,138.6 | 10.3 |
|
Source: Euromonitor International, 2024 *CAGR: Compound annual growth rate |
||||||
New product launches
A total of 2,551 new confectionary products were introduced over 2019 to 2023. Most claims were vegetarian, environmentally based, and "no/low" claims, which suggests that consumers prefer ethical and healthy confectionary. Top flavours included plain, orange, and almond.
| Product attributes | Number of new products by year | Total | ||||
|---|---|---|---|---|---|---|
| 2019 | 2020 | 2021 | 2022 | 2023 | ||
| Yearly product launches | 654 | 508 | 412 | 430 | 547 | 2,551 |
| Top 10 claims | ||||||
| Vegetarian | 611 | 483 | 384 | 405 | 532 | 2,415 |
| Social Media | 79 | 93 | 75 | 90 | 113 | 450 |
| Ethical - Environmentally Friendly Product | 48 | 38 | 83 | 92 | 111 | 372 |
| No Additives/Preservatives | 65 | 58 | 55 | 58 | 73 | 309 |
| Free from Added/Artificial Preservatives | 48 | 45 | 44 | 37 | 62 | 236 |
| Premium | 67 | 45 | 34 | 34 | 52 | 232 |
| Ethical - Environmentally Friendly Package | 39 | 25 | 44 | 34 | 79 | 221 |
| Ethical - Recycling | 32 | 20 | 41 | 33 | 69 | 195 |
| Ethical - Human | 42 | 14 | 59 | 27 | 50 | 192 |
| Ethical - Sustainable (Habitat/Resources) | 27 | 16 | 59 | 29 | 54 | 185 |
| Top 10 companies | ||||||
| Mondelez | 57 | 28 | 54 | 38 | 43 | 220 |
| Nestlé | 42 | 20 | 21 | 22 | 34 | 139 |
| Perfetti Van Melle | 38 | 20 | 21 | 12 | 20 | 111 |
| Hershey | 8 | 18 | 10 | 10 | 18 | 64 |
| Mars International | 16 | 5 | 12 | 14 | 14 | 61 |
| ITC | 19 | 3 | 1 | 6 | 18 | 47 |
| Ferrero | 12 | 4 | 5 | 11 | 14 | 46 |
| Dugar Overseas | 7 | 5 | 3 | 7 | 15 | 37 |
| Karachi Bakery | 4 | 4 | 7 | 5 | 5 | 25 |
| Bliss Chocolates | 7 | 16 | 0 | 0 | 1 | 24 |
| Top 5 flavours (including blend) | ||||||
| Unflavoured/Plain | 129 | 105 | 69 | 83 | 103 | 489 |
| Flavours Unavailable | 25 | 28 | 25 | 21 | 43 | 142 |
| Orange/Sweet Orange | 39 | 23 | 16 | 14 | 25 | 117 |
| Almond | 15 | 21 | 23 | 15 | 18 | 92 |
| Strawberry | 37 | 18 | 8 | 11 | 18 | 92 |
| Top 5 ingredients | ||||||
| White Sugar (Food) | 519 | 398 | 318 | 330 | 453 | 2,018 |
| Emulsifiers | 336 | 243 | 204 | 215 | 279 | 1,277 |
| Glucose Syrup (Food) | 248 | 164 | 161 | 177 | 180 | 930 |
| Cocoa Powder (Food) | 216 | 186 | 127 | 157 | 204 | 890 |
| Cocoa Fat (Food) | 227 | 201 | 152 | 144 | 155 | 879 |
| Launch types | ||||||
| New Packaging | 238 | 176 | 172 | 142 | 228 | 956 |
| New Product | 237 | 163 | 134 | 155 | 155 | 844 |
| New Variety/Range Extension | 128 | 139 | 84 | 112 | 142 | 605 |
| Relaunch | 47 | 29 | 21 | 21 | 22 | 140 |
| New Formulation | 4 | 1 | 1 | 0 | 0 | 6 |
| Top 5 package types | ||||||
| Flexible | 352 | 215 | 259 | 308 | 359 | 1,493 |
| Carton | 99 | 104 | 29 | 5 | 9 | 246 |
| Flexible stand-up pouch | 37 | 28 | 27 | 30 | 37 | 159 |
| Tub | 33 | 25 | 14 | 21 | 38 | 131 |
| Tray | 21 | 22 | 25 | 28 | 29 | 125 |
| Location of manufacturer | ||||||
| Not Specified | 445 | 364 | 298 | 269 | 353 | 1,729 |
| India | 120 | 102 | 90 | 148 | 151 | 611 |
| Germany | 13 | 9 | 6 | 2 | 3 | 33 |
| Switzerland | 11 | 4 | 1 | 0 | 9 | 25 |
| Malaysia | 9 | 4 | 5 | 2 | 2 | 22 |
| Source: Mintel GNPD, 2024 | ||||||
New product examples
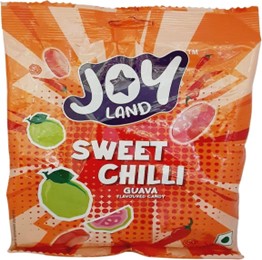
Sweet Chilli Guava Flavoured Candy
| Company | Reliance Retail |
|---|---|
| Manufacturer | Kayempee Foods |
| Brand | Joy Land |
| Category | Sugar and gum confectionary |
| Sub-category | Boiled sweets |
| Market | India |
| Location of manufacture | India |
| Date published | December 2023 |
| Launch type | New variety / range extension |
| Price in US dollars | 0.40 |
Reliance Joy Land Sweet Chilli Guava Flavoured Candy retails in a 154 gram pack with 44 3.5 g units. - Sugar boiled confectionery - Logos and certifications: Vegetarian green dot, FSSAI
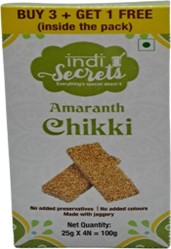
Amaranth Chikki
| Company | Innovative Retail Concepts |
|---|---|
| Manufacturer | Sirimiri Nutrition Food Products |
| Brand | Indi Secrets |
| Category | Sugar and gum confectionary |
| Sub-category | Toffees, caramels and nougat |
| Market | India |
| Location of manufacture | India |
| Store name | BigBasket |
| Store type | Internet / mail order |
| Date published | December 2023 |
| Launch type | New variety / range extension |
| Price in US dollars | 0.68 |
Indi Secrets Amaranth Chikki retails in a 100 gram pack containing four 25 gram packets. - No added preservative or added colours - Made with delicious melt jaggery and dainty little amaranth seeds - Crunchy, sweet and wholesome - Logos and certifications: Vegetarian green dot, FSSAI, Clean India Proud Participant.
Paan & Mint Flavoured Candy

| Manufacturer | CandyVille Confections and Foods |
|---|---|
| Brand | CandyVille Mint Mello |
| Category | Sugar and gum confectionary |
| Sub-category | Standard and power mints |
| Market | India |
| Location of manufacture | India |
| Store name | Amazon.in |
| Store type | Internet / mail order |
| Date published | November 2023 |
| Product source | Shopper |
| Launch type | New product |
| Price in US dollars | 3.23 |
CandyVille Mint Mello Paan & Mint Flavoured Candy retails in a 340 gram pack of which 283 gram + 57 gram free. - Candy pack- 20% extra - Sugar boiled confectionery - Logos and certification: Vegetarian green dot, Fssai
For more information
The Canadian Trade Commissioner Service:
International Trade Commissioners can provide Canadian industry with on-the-ground expertise regarding market potential, current conditions and local business contacts, and are an excellent point of contact for export advice.
More agri-food market intelligence:
International agri-food market intelligence
Discover global agriculture and food opportunities, the complete library of Global Analysis reports, market trends and forecasts, and information on Canada's free trade agreements.
Agri-food market intelligence service
Canadian agri-food and seafood businesses can take advantage of a customized service of reports and analysis, and join our email subscription service to have the latest reports delivered directly to their inbox.
More on Canada's agriculture and agri-food sectors:
Canada's agriculture sectors
Information on the agriculture industry by sector. Data on international markets. Initiatives to support awareness of the industry in Canada. How the department engages with the industry.
For additional information on upcoming trade shows, please contact:
Ben Berry, Deputy Director
Trade Show Strategy and Delivery
Agriculture and agri-food Canada
ben.berry@agr.gc.ca
Resources
- Euromonitor International:
- Chocolate confectionary in India (October 2023)
- Gum in India (October 2023)
- Sugar confectionary in India (October 2023)
- Retail in India (March 2023)
- Snacks in India (October 2023)
- Mintel Global New Products Database, 2024
Sector Trends Analysis – Confectionary trends in India
Global Analysis Report
Prepared by: Kris Clipsham, Market Analyst
© His Majesty the King in Right of Canada, represented by the Minister of Agriculture and Agri-Food (2024).
Photo credits
All photographs reproduced in this publication are used by permission of the rights holders.
All images, unless otherwise noted, are copyright His Majesty the King in Right of Canada.
To join our distribution list or to suggest additional report topics or markets, please contact:
Agriculture and Agri-Food Canada, Global Analysis1341 Baseline Rd, Tower 5, 3rd floor
Ottawa ON K1A 0C5
Canada
Email: aafc.mas-sam.aac@agr.gc.ca
The Government of Canada has prepared this report based on primary and secondary sources of information. Although every effort has been made to ensure that the information is accurate, Agriculture and Agri-Food Canada (AAFC) assumes no liability for any actions taken based on the information contained herein.
Reproduction or redistribution of this document, in whole or in part, must include acknowledgement of agriculture and agri-food Canada as the owner of the copyright in the document, through a reference citing AAFC, the title of the document and the year. Where the reproduction or redistribution includes data from this document, it must also include an acknowledgement of the specific data source(s), as noted in this document.
Agriculture and Agri-Food Canada provides this document and other report services to agriculture and food industry clients free of charge.