

Note: This report includes forecasting data that is based on baseline historical data.
Executive summary
In 2022, Japan imported a total of US$1.3 billion (189.5 thousand tonnes) of plant-based and animal protein ingredients from the world. The top global suppliers of these protein ingredients to Japan were the United States (22.8%), New Zealand (21.8%), and Germany (11.9%) in 2022. While, Japan imported a total of US$11.6 million (2.8 thousand tonnes) from Canada (15th largest value market) over the year.
The market size in terms of volume sales for non-animal derived proteins in Japan accounted for 41.1 thousand tonnes in 2022, while animal derived proteins totaled 64.9 thousand tonnes. Demand for plant-based protein products with the highest market share was for soy protein concentrate (63.3%), followed by soy protein isolate (27.9%), gluten (6.9%), vegetable proteins (1.7%), and pea protein (0.2%). In general, these plant-based protein ingredients were found in staple packaged food categories such as processed meat, instant noodle cups, tofu and derivatives, chilled meat and seafood substitutes, baked good (packaged flat bread, cakes); cooking ingredients and meals: ready meals, salad dressings; pet dog and cat food; snacks: potato/pulse/bread chips, protein energy bars; and dairy products and alternatives: plant-based milk drinks (incl. soy milk, powder special baby formula, powder milk.
Products in Japan with a high source of protein ingredients (animal or non-animal derived) registered total packaged food sales of US$589.1 million and plant-based products (US$948.2 million) in 2022. Food categories that contain the highest source of protein ingredients included staple foods such as processed meat, seafood and alternatives to meat (incl. tofu and derivatives) at a sales value of US$184.3 million, instant noodles (US$96.9 million), and baked bread goods (US$95.6 million). Top plant-based product categories included plant-based milk (US$785.4), dairy free yogurt (US$39.9 million), and ready meals (US$35.9 million) in 2022.
In Japan, meat and seafood alternatives have continued to see significant growth driven by the ongoing pre-pandemic healthy eating trend - leading to more Japanese consumers trying out these plant-based substitutes for the first time. Positive nutritional claims for added/high protein are appearing more among plant-based food categories - where high protein content is the most important feature that consumers seek for in health dietary attributes within plant-based drinks throughout the Asia Pacific (APAC) region.
Global market overview and trends in the Asia Pacific
Globally, new plant-based, vegan and vegetarian product developments or launches have been growing not only in the food and beverage sector with 66.7% of claims in 2022 and a growth of 3.1% (2015 to 2021), while such plant-based claims are also becoming popular in the consumer health (50%), and the beauty and personal care segments (74.6%) by a growth of 8.3%. Plant-based eating and alternative proteins has been steadily rising (accelerated by the COVID-19 pandemic) amongst most countries.Footnote 1
Health benefits are the main reason for consuming plant-based diets and are mostly found in the plant-based meat substitutes and dairy milk alternatives food categories. Flexitarianism is a major driver for growth in the meatless category with consumers trying to either limit their meat intake (23%) or follow a plant-based diet (15%); while other motivations to a lesser extent over health reasoning includes climate change, sustainability, environmental, and animal rights/welfare concerns.Footnote 2 Consumers in the APAC region, find that positive nutritional quality claims such as 'added/high protein' content is the most important feature when purchasing plant-based drinks - as cited by nearly half of responders (48%) at a sample size of 2,936 users.Footnote 3
Plant-based innovation is now reaching all food segments like ingredient replacements in categories such as fish and seafood, cheese, sugar and chocolate confectionery, sauces, dressings and condiments, prepared baby food, and ready meals etc. Although, plant-based alternatives are deemed to be healthier compared to their dairy/meat counterparts, the segment must continue to scientifically prove and to protect its "health halo" (not overestimate the healthfulness of their claims) by keeping labels transparent and easy to understand its ingredients through simple, clean benefit claims.Footnote 2
As the segment finds its place in the retail market, claims often used to differentiate its products and pull in more consumers include lab cultivated (pushed by regulatory bodies), animal free (preferred naming nomenclature), and more recently trying to battle the right to advertise as "natural" to compete with consumer concerns possibly found in real meat products such as toxins (mercury) and microplastics, antibiotics, added hormones, along with sustainability (overfishing). This natural claim is mostly used in plant-based beverages to market those products with natural ingredients and focus on top consumer trend claims such as those that have limited or no added sugar (sweetened instead with natural Stevia, Monkfruit, Allulose), free from preservatives, all natural, no artificial sweeteners, good for heart health, no added salt/fat/transfat or hydrogenated oils etc.Footnote 2
According to a health and nutrition survey (n=6,083) in 2022, Euromonitor states that the challenge that the plant-based segment faces is that 30% of global consumers report that not enjoying the taste is a reason for not consuming plant-based dairy alternatives. In the past, soy beverages more for consumers with lactose intolerance did not taste good, however, there are new better tasting options like oat plant-based milks, boosting the segment further and improvements to the quality (possibly health) and natural taste are being addressed through precision fermentation for dairy-free and cell-cultivated meat and seafood products.Footnote 2 Precision-fermented proteins are being developed at a record pace but manufacturers must deliver tangible consumer-facing benefits to match those offered by plant-based alternatives.
To further drive the plant-based, vegan or vegetarian segment, next steps are working towards having more big foodservice companies to take-on these products and help propel the trend towards bringing plant-based products to a more general consumer base. Yum! BrandsFootnote 4 (KFC: Beyond Fried Chicken, Pizza Hut, Taco Bell etc.) were the first International brand to bring meat alternatives to consumers on a wide scale. Burger King pledges to reduce its meat consumption by 50% in the UK by 2030.Footnote 5 While, full-service restaurants (FSRs) are trying to introduce new plant-based options that help vary their menu items, follow healthy eating trends and push wider green initiatives.Footnote 2
Trade overview
In 2022, Japan imported a total of US$1.3 billion (189.5 thousand tonnes) of plant-based and animal protein ingredients from the world (consisting of protein concentrates/substances, peptones and their derivatives, milk and egg or other albumins/albuminates, pea/bean/lentil or vegetable powder, whey proteins and wheat gluten, along with food preparations - that could include plant-based burgers, patties, sausages). This import value has been increasing at a CAGR of 15.1%, especially for pea/bean/lentil or other vegetable powder (56.2%), milk albumin, >80% proteins (28.7%) and caseinates and other casein derivatives (19.2%) between 2018 and 2022. During this time period, egg albumin (excluding dried) registered a significant decline of 65.9%, followed by vegetable protein concentrates containing ≥80% protein, in containers (−11.3%), and peptones and its derivatives; hide powder (−2.2%).
The top global suppliers of plant-based and protein ingredients to Japan were the United States (22.8%), New Zealand (21.8%), and Germany (11.9%) in 2022. While, Japan imported a total of US$11.6 million (2.8 thousand tonnes) from Canada over the year.
| Country | 2018 | 2019 | 2020 | 2021 | 2022 | CAGR* % 2018-2022 |
|---|---|---|---|---|---|---|
| Total - global suppliers | 737.4 | 748.2 | 797.6 | 953.0 | 1,294.7 | 15.1 |
| 1. United States | 142.2 | 129.8 | 157.6 | 199.8 | 294.7 | 20.0 |
| 2. New Zealand | 163.0 | 180.9 | 191.3 | 215.3 | 282.5 | 14.7 |
| 3. Germany | 61.8 | 65.2 | 67.4 | 110.5 | 153.6 | 25.6 |
| 4. China | 70.0 | 77.7 | 80.1 | 91.3 | 111.3 | 12.3 |
| 5. Netherlands | 48.5 | 53.3 | 58.8 | 63.0 | 85.1 | 15.1 |
| 6. Australia | 68.5 | 51.6 | 56.4 | 63.9 | 74.5 | 2.1 |
| 7. Denmark | 40.4 | 38.6 | 39.4 | 45.4 | 58.7 | 9.8 |
| 8. France | 30.9 | 28.4 | 29.3 | 32.2 | 38.8 | 5.9 |
| 9. Italy | 20.2 | 23.3 | 19.2 | 21.7 | 36.8 | 16.2 |
| 10. Thailand | 24.7 | 27.3 | 27.4 | 26.9 | 29.9 | 4.8 |
| Subtotal - top 10 suppliers | 670.2 | 676.0 | 726.9 | 869.9 | 1,166.0 | 14.8 |
| Canada (15th) | 9.5 | 7.6 | 6.8 | 5.7 | 11.6 | 5.0 |
|
Source: Global trade tracker, 2023 *CAGR: Compound Annual Growth Rate |
||||||
| Country | 2018 | 2019 | 2020 | 2021 | 2022 | CAGR* % 2018-2022 |
|---|---|---|---|---|---|---|
| Total - global suppliers | 165,129 | 161,072 | 163,854 | 175,408 | 189,466 | 3.5 |
| 1. United States | 42,884 | 32,619 | 38,186 | 35,381 | 40,498 | −1.4 |
| 2. China | 20,588 | 22,964 | 23,321 | 25,432 | 28,298 | 8.3 |
| 3. New Zealand | 21,927 | 22,548 | 22,171 | 24,647 | 25,394 | 3.7 |
| 4. Germany | 14,149 | 14,258 | 14,167 | 19,239 | 20,733 | 10.0 |
| 5. Australia | 23,540 | 18,104 | 19,073 | 20,729 | 20,423 | −3.5 |
| 6. Netherlands | 7,861 | 9,466 | 10,105 | 9,126 | 9,221 | 4.1 |
| 7. France | 7,603 | 6,630 | 6,803 | 5,962 | 6,285 | −4.6 |
| 8. Italy | 3,482 | 5,453 | 4,630 | 4,584 | 5,434 | 11.8 |
| 9. Poland | 316 | 1,821 | 4,277 | 6,078 | 5,273 | 102.1 |
| 10. Denmark | 4,912 | 4,966 | 5,181 | 4,709 | 4,645 | −1.4 |
| Subtotal - top 10 suppliers | 147,262 | 138,829 | 147,914 | 155,887 | 166,204 | 3.1 |
| Canada (12th) | 2,959 | 2,134 | 2,081 | 1,602 | 2,846 | −1.0 |
|
Source: Global trade tracker, 2023 *CAGR: Compound Annual Growth Rate |
||||||
| HS Code | Description | 2018 | 2019 | 2020 | 2021 | 2022 | CAGR* % 2018-2022 |
|---|---|---|---|---|---|---|---|
| Total - imports from the world | 737.4 | 748.2 | 797.6 | 953.0 | 1,294.7 | 15.1 | |
| 350400 | Subtotal: Peptones and other protein substances and its derivatives, nowhere else specified | 251.3 | 274.5 | 295.7 | 335.9 | 373.4 | 10.4 |
| 35040029 | Proteins and its derivatives, nowhere else specified | 134.6 | 167.6 | 181.4 | 193.3 | 223.0 | 13.5 |
| 35040021 | Vegetable proteins and its derivatives | 62.6 | 63.8 | 68.1 | 92.4 | 100.9 | 12.7 |
| 35040010 | Peptones and its derivatives; hide powder | 54.1 | 43.1 | 46.2 | 50.1 | 49.4 | −2.2 |
| 350220 | Milk albumin, >80% proteins by weight (including concentrates of 2 or more whey proteins) | 126.4 | 126.5 | 149.8 | 217.4 | 346.8 | 28.7 |
| 040410 | Whey and modified whey proteins | 85.3 | 85.6 | 87.7 | 98.4 | 133.2 | 11.8 |
| 350190 | Caseinates and other casein derivatives | 65.4 | 73.6 | 71.5 | 89.3 | 131.9 | 19.2 |
| 350211 | Egg albumin, dried (for example, sheets, scales, flakes, powders) | 68.3 | 62.6 | 59.6 | 68.1 | 131.2 | 17.7 |
| 350110 | Casein | 34.7 | 33.0 | 37.6 | 39.1 | 56.9 | 13.1 |
| 110900 | Wheat gluten, whether or not dried | 48.4 | 40.0 | 41.2 | 46.1 | 53.5 | 2.5 |
| 210610 | Subtotal: Protein concentrates and textured protein substances | 42.8 | 39.0 | 39.2 | 42.5 | 49.1 | 3.5 |
| 210610222 | Vegetable protein, not containing added sugar, nowhere else specified | 21.2 | 21.0 | 21.8 | 26.2 | 35.4 | 13.7 |
| 210610221 | Vegetable protein concentrates containing by weight not less than 80% protein, in containers for retail sale by weight of 500 grams or less, no added sugar | 21.2 | 17.9 | 16.5 | 15.1 | 13.2 | −11.3 |
| 210610229/ 211/ 140/ 120/ 219 | Protein concentrates and textured protein substances (excluding vegetable protein and concentrates) | 0.379 | 0.080 | 0.916 | 1.3 | 0.576 | 11.1 |
| 210690296 | Other food preparations[1] of hydrolyzed vegetable protein, nowhere else specified (no added sugar) | 8.1 | 7.8 | 7.5 | 7.6 | 8.6 | 1.3 |
| 350290 | Other albumins, albuminates and its derivatives (excluding egg and milk albumins) | 4.1 | 3.8 | 6.7 | 6.7 | 7.5 | 16.2 |
| 110610 | Flour, meal and powder of peas, beans, lentils and the other dried leguminous vegetables of heading 0713 | 0.446 | 0.548 | 1.0 | 1.8 | 2.7 | 56.2 |
| 350219 | Egg albumin, excluding dried | 2.1 | 1.1 | 0.0 | 0.084 | 0.0 | −65.9 |
|
Source: Global trade tracker, 2023 *CAGR: Compound Annual Growth Rate 1: Other food preparations, nowhere else specified - All plant-based meat products would be classified under HS 210690, that is, burgers, patties, sausages, yet also includes other various food preparations, nowhere else specified. The other food preparations of hydrolyzed vegetable protein (HS:210690296) sub-category seems to best fit the description that would track these plant-based products. |
|||||||
| HS Code | Description | 2018 | 2019 | 2020 | 2021 | 2022 | CAGR* % 2018-2022 |
|---|---|---|---|---|---|---|---|
| Total - imports from the world | 165,132 | 161,073 | 163,852 | 175,407 | 189,464 | 3.5 | |
| 040410 | Whey and modified whey proteins | 54,542 | 51,710 | 50,154 | 49,348 | 54,750 | 0.1 |
| 350400 | Subtotal: Peptones and other protein substances and its derivatives, nowhere else specified | 36,076 | 38,604 | 40,866 | 44,025 | 44,875 | 5.6 |
| 35040021 | Vegetable proteins and its derivatives | 19,285 | 20,252 | 21,123 | 24,323 | 24,305 | 6.0 |
| 35040029 | Proteins and its derivatives, nowhere else specified | 12,932 | 15,307 | 16,577 | 16,290 | 16,989 | 7.1 |
| 35040010 | Peptones and its derivatives; hide powder | 3,860 | 3,045 | 3,166 | 3,411 | 3,581 | −1.9 |
| 350220 | Milk albumin, >80% proteins by weight (including concentrates of 2 or more whey proteins) | 16,272 | 16,019 | 19,729 | 26,264 | 28,789 | 15.3 |
| 110900 | Wheat gluten, whether or not dried | 23,505 | 19,877 | 20,690 | 22,268 | 22,277 | −1.3 |
| 210610 | Subtotal: Protein concentrates and textured protein substances | 7,916 | 7,854 | 7,917 | 8,561 | 10,805 | 8.1 |
| 210610222 | Vegetable protein, not containing added sugar, nowhere else specified | 7,100 | 7,092 | 7,091 | 7,741 | 9,936 | 8.8 |
| 210610221 | Vegetable protein concentrates containing by weight not less than 80% protein, in containers for retail sale by weight of 500 grams or less, no added sugar | 773 | 756 | 737 | 692 | 818 | 1.4 |
| 210610229/ 211/140/120/ 219 | Protein concentrates and textured protein substances (excluding vegetable protein and concentrates) | 44 | 6 | 89 | 128 | 51 | 3.8 |
| 350211 | Egg albumin, dried (for example, sheets, scales, flakes, powders) | 9,629 | 10,141 | 9,438 | 9,239 | 10,682 | 2.6 |
| 350190 | Caseinates and other casein derivatives | 8,020 | 8,919 | 7,877 | 8,568 | 8,927 | 2.7 |
| 350110 | Casein | 5,056 | 4,616 | 4,660 | 4,444 | 4,802 | −1.3 |
| 210690296 | Other food preparations[1] of hydrolyzed vegetable protein, nowhere else specified (no added sugar) | 1,961 | 2,030 | 1,944 | 1,862 | 2,059 | 1.2 |
| 110610 | Flour, meal and powder of peas, beans, lentils and the other dried leguminous vegetables of heading 0713 | 381 | 444 | 566 | 748 | 1,424 | 39.0 |
| 350290 | Other albumins, albuminates and its derivatives (excluding egg and milk albumins) | 6 | 7 | 11 | 13 | 52 | 71.6 |
| 350219 | Egg albumin, excluding dried | 1,768 | 852 | − | 67 | 22 | −66.6 |
|
Source: Global trade tracker, 2023 *CAGR: Compound Annual Growth Rate 1: Other food preparations, nowhere else specified - All plant-based meat products would be classified under HS 210690, that is, burgers, patties, sausages, yet also includes other various food preparations, nowhere else specified. The other food preparations of hydrolyzed vegetable protein (HS:210690296) sub-category seems to best fit the description that would track these plant-based products. |
|||||||
Canada's performance
Canada was Japan's 15th largest supplier for plant-based and protein ingredients at a value of Can$15.1 million (2.8 thousand tonnes) in 2022. Japan's imports from Canada have increased by a CAGR value of 5.1% (2018 to 2022). Top plant-based or protein ingredients that Canada supplied to Japan were wheat gluten, whether or not dried (HS:110900) at Can$11.3 million, followed by whey and modified whey proteins (HS:040410) at Can$1.7 million; peptones and other protein substances and their derivatives, nowhere else specified (n.e.s.) (HS:350400) at Can$1.3 million; and vegetable protein, not containing added sugar, nowhere else specified (HS:210610222) at Can$605.9 million in 2022.
Protein concentrates and textured protein substances other than vegetable preparations and protein concentrates (≥80%) (HS:210610211) spiked in 2022, registering a high growth by a CAGR of 142.6% since 2018; along with increases in whey and modified whey proteins (+122.2%), and other food preparations of hydrolyzed vegetable protein, nowhere else specified (+54.5%). Meanwhile, decreases occurred in dried egg albumin in sheets, scales, flakes or powder (−24.9%) and for pea/bean/lentil or other vegetable powder (−18.1%) between 2018 and 2022.
| HS Code | Description | 2018 | 2019 | 2020 | 2021 | 2022 | CAGR* % 2018-2022 |
|---|---|---|---|---|---|---|---|
| Total - imports from Canada | 12,370.3 | 10,039.5 | 9,084.1 | 7,086.8 | 15,093.0 | 5.1 | |
| 110900 | Wheat gluten, whether or not dried | 10,396.4 | 7,729.7 | 7,611.9 | 5,594.0 | 11,254.4 | 2.0 |
| 040410 | Whey and modified whey proteins | 70.4 | 0.0 | 145.7 | 0.0 | 1,715.4 | 122.2 |
| 350400 | Peptones and other protein substances and their derivatives, nowhere else specified | 1,208.0 | 1,456.9 | 854.6 | 1,175.3 | 1,298.7 | 1.8 |
| 210610 | Subtotal: Protein concentrates and textured protein substances | 433.5 | 420.1 | 318.2 | 296.7 | 803.3 | 16.7 |
| 210610222 | Vegetable protein, not containing added sugar, nowhere else specified | 427.8 | 420.1 | 318.2 | 296.7 | 605.9 | 9.1 |
| 210610211 | Protein concentrates and textured protein substances (excluding vegetable protein preparations ≥30% natural milk constituents and protein concentrates ≥80%) | 5.7 | 0.0 | 0.0 | 0.0 | 197.4 | 142.6 |
| 210690296 | Other food preparations[1] of hydrolyzed vegetable protein, nowhere else specified (no added sugar) | 2.8 | 11.0 | 7.6 | 11.4 | 15.8 | 54.5 |
| 110610 | Flour, meal and powder of peas, beans, lentils and the other dried leguminous vegetables of heading 0713 | 0.0 | 9.7 | 0.0 | 6.5 | 5.4 | −18.1 |
| 350290 | Other albumins, albuminates and its derivatives (excluding egg and milk albumins) | 0.0 | 0.0 | 0.0 | 2.9 | 0.0 | |
| 350211 | Egg albumin, dried (for example, sheets, scales, flakes, powders) | 259.3 | 412.0 | 146.2 | 0.0 | 0.0 | −24.9 |
|
Source: Global trade tracker, 2023 *CAGR: Compound Annual Growth Rate 1: Other food preparations, nowhere else specified - All plant-based meat products would be classified under HS 210690, that is, burgers, patties, sausages, yet also includes other various food preparations, nowhere else specified. The other food preparations of hydrolyzed vegetable protein (HS:210690296) sub-category seems to best fit the description that would track these plant-based products. |
|||||||
| HS Code | Description | 2018 | 2019 | 2020 | 2021 | 2022 | CAGR* % 2018-2022 |
|---|---|---|---|---|---|---|---|
| Total - imports from Canada | 2,959.0 | 2,134.0 | 2,081.5 | 1,602.0 | 2,845.6 | −1.0 | |
| 110900 | Wheat gluten, whether or not dried | 2,774.2 | 1,985.0 | 1,905.7 | 1,506.5 | 2,031.7 | −7.5 |
| 040410 | Whey and modified whey proteins | 54.0 | 0.0 | 100.0 | 0.0 | 689.9 | 89.1 |
| 210610 | Subtotal: Protein concentrates and textured protein substances | 62.0 | 50.9 | 40.2 | 38.4 | 79.1 | 6.3 |
| 210610222 | Vegetable protein, not containing added sugar, nowhere else specified | 61.8 | 50.9 | 40.2 | 38.4 | 74.8 | 4.9 |
| 210610211 | Protein concentrates and textured protein substances preparations 30%≥79% natural milk constituents (excluding vegetable protein concentrates) | 0.2 | 0.0 | 0.0 | 0.0 | 4.2 | 126.9 |
| 350400 | Peptones and other protein substances and their derivatives, nowhere else specified | 46.0 | 67.3 | 24.8 | 54.4 | 43.0 | −1.7 |
| 110610 | Flour, meal and powder of peas, beans, lentils and the other dried leguminous vegetables of heading 0713 | 0.0 | 3.5 | 0.0 | 2.2 | 1.4 | −27.0 |
| 210690296 | Other food preparations[1] of hydrolyzed vegetable protein, nowhere else specified (no added sugar) | 0.2 | 0.6 | 0.4 | 0.6 | 0.6 | 36.1 |
| 350211 | Egg albumin, dried (for example, sheets, scales, flakes, powders) | 22.7 | 26.7 | 10.4 | 0.0 | 0.0 | −100.0 |
|
Source: Global trade tracker, 2023 *CAGR: Compound Annual Growth Rate 1: Other food preparations, nowhere else specified - All plant-based meat products would be classified under HS 210690, that is, burgers, patties, sausages, yet also includes other various food preparations, nowhere else specified. The other food preparations of hydrolyzed vegetable protein (HS:210690296) sub-category seems to best fit the description that would track these plant-based products. |
|||||||
Market sizes
In 2022, the market size of animal derived protein ingredients in Japan registered a volume of 64.9 thousand tonnes (61.2%), equivalent to an historical volume sales CAGR of −0.7% (2017-2022) and a forecast CAGR of 0.2% (2022-2027) set to reach 65.7 thousand tonnes by 2027. In 2022, the majority of the animal derived protein market consisted of 48.5% of caseinates (31.5 thousand tonnes), followed by 17.9% of whey protein concentrate (11.6 thousand tonnes), 17.1% of gelatin (11.1 thousand tonnes), 8.2% of milk protein concentrates (5.3 thousand tonnes), and 5.1% of egg whites (3.3 thousand tonnes); smaller market sizes being milk protein isolates, caseins, whey protein isolate, hydrolysed keratins, and albumin. Historically, volume sales of all animal derived protein ingredients in Japan registered either low growth or slight declines with CAGRs falling between −4.4% and 1.7%.
| Category | 2017 | 2022 | CAGR* % 2017-2022 | 2023 | 2027 | CAGR* % 2022-2027 |
|---|---|---|---|---|---|---|
| Total - animal derived proteins | 67,143.2 | 64,925.5 | −0.7 | 65,229.0 | 65,683.7 | 0.2 |
| Albumin | 0.5 | 0.4 | −4.4 | 0.4 | 0.4 | 0.0 |
| Casein | 807.1 | 798.7 | −0.2 | 801.9 | 809.7 | 0.3 |
| Caseinates | 32,938.0 | 31,475.4 | −0.9 | 31,526.4 | 31,336.2 | −0.1 |
| Egg white | 3,578.7 | 3,286.7 | −1.7 | 3,340.9 | 3,521.5 | 1.4 |
| Gelatin | 11,001.3 | 11,133.5 | 0.2 | 11,257.5 | 11,665.5 | 0.9 |
| Milk protein concentrate | 5,406.6 | 5,346.0 | −0.2 | 5,368.6 | 5,429.2 | 0.3 |
| Milk protein isolate | 883.8 | 810.7 | −1.7 | 826.9 | 888.4 | 1.8 |
| Whey protein concentrate | 12,036.2 | 11,599.7 | −0.7 | 11,638.0 | 11,567.8 | −0.1 |
| Whey protein isolate | 490.9 | 474.3 | −0.7 | 468.3 | 465.0 | −0.4 |
| Hydrolysed keratins | 65.4 | 71.0 | 1.7 | 71.4 | 72.8 | 0.5 |
|
Source: Euromonitor International, 2023 *CAGR: Compound Annual Growth Rate |
||||||
In 2022, demand in Japan for animal derived protein ingredients in terms of volume (containing a total protein breakdown of 65.4%) was highest within packaged food categories such as dairy products at a protein breakdown of 29.9% (19.4 thousand tonnes), especially for protein found in yogurt and sour milk at 24.9% within its category. Snacks were the second highest category in demand for animal derived protein ingredients at 19% (12.3 thousand tonnes), mostly within sugar confectionery products at 15% within the snack category in 2022. Cooking ingredients and meals were the next in demand over the year at 13.1% (8.5 thousand tonnes) mostly within the ready meals sub-category at 11.7%, followed by staple foods at a total of 3.4% (2.2 thousand tonnes) mostly for baked cake goods accounting for 2.1% of animal derived protein ingredients.
| Category | Data type | 2017 | 2022 | CAGR* % 2017-2022 | 2023 | 2027 | CAGR* % 2022-2027 |
|---|---|---|---|---|---|---|---|
| Total - packaged food (animal derived proteins) | Total volume | 43,776.1 | 42,478.1 | −0.6 | 42,705.1 | 43,525.0 | 0.5 |
| % breakdown | 65.2 | 65.4 | 0.1 | 65.5 | 66.3 | 0.3 | |
| Snacks: | Total volume | 12,270.0 | 12,323.8 | 0.1 | 12,476.4 | 12,978.3 | 1.0 |
| % breakdown | 18.3 | 19.0 | 0.8 | 19.1 | 19.8 | 0.8 | |
| Chocolate confectionery | Total volume | 932.5 | 880.4 | −1.1 | 888.9 | 908.0 | 0.6 |
| % breakdown | 1.4 | 1.4 | 0.0 | 1.4 | 1.4 | 0.0 | |
| Sugar confectionery | Total volume | 9,404.5 | 9,727.8 | 0.7 | 9,828.6 | 10,162.2 | 0.9 |
| % breakdown | 14.0 | 15.0 | 1.4 | 15.1 | 15.5 | 0.7 | |
| Ice cream and frozen yogurt | Total volume | 54.3 | 49.6 | −1.8 | 49.9 | 50.8 | 0.5 |
| % breakdown | 0.1 | 0.1 | 0.0 | 0.1 | 0.1 | 0.0 | |
| Frozen desserts | Total volume | 1,371.5 | 1,113.9 | −4.1 | 1,155.2 | 1,297.7 | 3.1 |
| % breakdown | 2.0 | 1.7 | −3.2 | 1.8 | 2.0 | 3.3 | |
| Savoury biscuits and salty snacks | Total volume | 485.2 | 528.3 | 1.7 | 530.0 | 535.4 | 0.3 |
| % breakdown | 0.7 | 0.8 | 2.7 | 0.8 | 0.8 | 0.0 | |
| Protein/energy bars | Total volume | 19.4 | 21.0 | 1.6 | 21.1 | 21.4 | 0.4 |
| Sweet filled biscuits | Total volume | 2.5 | 2.7 | 1.6 | 2.7 | 2.7 | 0.0 |
| Dairy products and alternatives: | Total volume | 20,415.4 | 19,389.8 | −1.0 | 19,392.2 | 19,476.2 | 0.1 |
| % breakdown | 30.4 | 29.9 | −0.3 | 29.7 | 29.7 | −0.1 | |
| Baby milk formula | Total volume | 520.7 | 420.8 | −4.2 | 392.7 | 350.4 | −3.6 |
| % breakdown | 0.8 | 0.6 | −5.6 | 0.6 | 0.5 | −3.6 | |
| Processed cheese (excluding spreadable) | Total volume | 960.0 | 992.1 | 0.7 | 1,018.2 | 1,113.8 | 2.3 |
| % breakdown | 1.4 | 1.5 | 1.4 | 1.6 | 1.7 | 2.5 | |
| Yogurt and sour milk | Total volume | 16,936.8 | 16,145.9 | −1.0 | 16,172.2 | 16,271.8 | 0.2 |
| % breakdown | 25.2 | 24.9 | −0.2 | 24.8 | 24.8 | −0.1 | |
| Other dairy (chilled desserts, coffee whiteners, condensed milk, fresh cheese and quark) | Total volume | 1,997.9 | 1,830.9 | −1.7 | 1,809.2 | 1,740.3 | −1.0 |
| % breakdown | 3.0 | 2.8 | −1.4 | 2.8 | 2.6 | −1.5 | |
| Cooking ingredients and meals: | Total volume | 8,617.2 | 8,529.7 | −0.2 | 8,555.4 | 8,620.9 | 0.2 |
| % breakdown | 12.8 | 13.1 | 0.5 | 13.1 | 13.1 | 0.0 | |
| Ready meals | Total volume | 7,707.8 | 7,615.0 | −0.2 | 7,643.2 | 7,713.4 | 0.3 |
| % breakdown | 11.5 | 11.7 | 0.3 | 11.7 | 11.7 | 0.0 | |
| Bouillon - liquid stocks and fonds | Total volume | 151.3 | 163.5 | 1.6 | 161.7 | 157.3 | −0.8 |
| % breakdown | 0.2 | 0.3 | 8.4 | 0.2 | 0.2 | −7.8 | |
| Chilled soup | Total volume | 119.8 | 116.9 | −0.5 | 118.5 | 122.6 | 1.0 |
| % breakdown | 0.2 | 0.2 | 0.0 | 0.2 | 0.2 | 0.0 | |
| Dips and mayonnaise | Total volume | 127.1 | 128.7 | 0.3 | 131.0 | 135.9 | 1.1 |
| % breakdown | 0.2 | 0.2 | 0.0 | 0.2 | 0.2 | 0.0 | |
| Other sauces, dressings and condiments | Total volume | 511.2 | 505.7 | −0.2 | 501.1 | 491.8 | −0.6 |
| % breakdown | 0.8 | 0.8 | 0.0 | 0.8 | 0.7 | −2.6 | |
| Staple foods: | Total volume | 2,473.5 | 2,234.8 | −2.0 | 2,281.0 | 2,449.5 | 1.9 |
| % breakdown | 3.7 | 3.4 | −1.7 | 3.5 | 3.7 | 1.7 | |
| Baked cake goods | Total volume | 1,475.9 | 1,332.3 | −2.0 | 1,358.5 | 1,450.5 | 1.7 |
| % breakdown | 2.2 | 2.1 | −0.9 | 2.1 | 2.2 | 0.9 | |
| Chilled processed meat | Total volume | 879.8 | 806.8 | −1.7 | 823.0 | 884.5 | 1.9 |
| % breakdown | 1.3 | 1.2 | −1.6 | 1.3 | 1.3 | 1.6 | |
| Processed frozen potatoes | Total volume | 117.8 | 95.6 | −4.1 | 99.4 | 114.4 | 3.7 |
| % breakdown | 0.2 | 0.1 | −12.9 | 0.2 | 0.2 | 14.9 | |
|
Source: Euromonitor, 2023 *CAGR: Compound Annual Growth Rate |
|||||||
In 2022, the market size of plant-based protein ingredients (non-animal derived) in Japan registered a volume of 41.1 thousand tonnes (38.8%), equivalent to an historical volume sales CAGR of −0.3% (2017-2022) and a forecast CAGR of 0.9% (2022-2027) set to reach 42.9 thousand tonnes by 2027. In 2022, 63.3% of non-animal derived protein ingredients consisted of soy protein concentrate (26.1 thousand tonnes), followed by 27.9% of soy protein isolate (11.5 thousand tonnes), 6.9% of gluten (2.8 thousand tonnes), 1.7% of vegetable proteins (695.7 tonnes), and 0.2% pea protein (64.8 tonnes). Historically, volume sales of pea protein has been increasing with the largest compound growth of 12% with soy protein isolate (−1.9%) and vegetable proteins (−0.2%) declining over the same period, while gluten (0.3%) and soy protein concentrate (0.3%) registered low growth. Noting that protein hydrolysates (6.0 thousand tonnes) and other proteins (3.8 thousand tonnes) were not included in the protein ingredients total since these categories may not necessarily be all inclusively non-animal derived. However, typically these proteins do come from plant, pulse or cereal sources.
| Category | 2017 | 2022 | CAGR* % 2017-2022 | 2023 | 2027 | CAGR* % 2022-2027 |
|---|---|---|---|---|---|---|
| Total - non-animal derived proteins[1] | 41,803.6 | 41,145.6 | −0.3 | 41,483.3 | 42,931.6 | 0.9 |
| Gluten | 2,781.8 | 2,828.0 | 0.3 | 2,838.9 | 2,873.2 | 0.3 |
| Pea protein | 36.8 | 64.8 | 12.0 | 71.3 | 92.6 | 7.4 |
| Soy protein concentrate | 25,653.5 | 26,065.4 | 0.3 | 26,198.1 | 26,882.4 | 0.6 |
| Soy protein isolate | 12,630.5 | 11,491.7 | −1.9 | 11,676.6 | 12,378.3 | 1.5 |
| Vegetable proteins | 701.1 | 695.7 | −0.2 | 698.4 | 705.2 | 0.3 |
| Protein hydrolysates[1] | 5,959.9 | 6,018.3 | 0.2 | 6,054.9 | 6,168.2 | 0.5 |
| Other proteins[1] | 3,620.2 | 3,821.7 | 1.1 | 3,825.1 | 3,832.5 | 0.1 |
|
Source: Euromonitor International, 2023 *CAGR: Compound Annual Growth Rate 1: Non-animal derived proteins - Note that this category is not all inclusive since non-animal derived proteins may be used in the more ambiguous categories 'Hydrolysed Keratins,' 'Protein Hydrolysates' and 'Other Proteins' (not including in total volume). Typically, however, these proteins come from plant, pulse or cereal sources. |
||||||
In 2022, demand in Japan for plant-based protein ingredients in terms of volume (containing a total protein breakdown of 84.3%) was highest within packaged food categories such as staple food products at a protein breakdown of 51.1% (21.0 thousand tonnes), especially for added protein found in processed poultry/red meat at 37.3%, instant noodle cups at 13.2%, and tofu and derivatives (1.9%) within its category. Cooking ingredients and meals were the second highest category in demand for non-animal derived protein ingredients at 18.8% (7.8 thousand tonnes), specifically protein found in ready meals (6.5%). Pet dog and cat food were next in demand at 15.7% (6.4 thousand tonnes). The snacks category followed at 11.6% (4.8 thousand tonnes) for protein energy bars. Lastly, was the dairy products and alternatives category at 2.7% (1.1 thousand tonnes) mostly for protein found in plant-based soy milk products (2.3%) in 2022.
| Category | Data type | 2017 | 2022 | CAGR* % 2017-2022 | 2023 | 2027 | CAGR* % 2022-2027 |
|---|---|---|---|---|---|---|---|
| Total - packaged food (non-animal derived proteins) | Total volume | 34,897.1 | 34,681.3 | −0.1 | 35,137.5 | 36,983.4 | 1.3 |
| % breakdown | 83.5 | 84.3 | 0.2 | 84.7 | 86.1 | 0.4 | |
| Snacks: | Total volume | 4,426.7 | 4,787.2 | 1.6 | 4,810.5 | 4,885.0 | 0.4 |
| % breakdown | 10.6 | 11.6 | 1.8 | 11.6 | 11.4 | −0.3 | |
| Salty potato/pulse/bread/chips | Total volume | 6.4 | 6.9 | 1.5 | 6.9 | 7.0 | 0.3 |
| Protein energy bars | Total volume | 4,420.4 | 4,780.4 | 1.6 | 4,803.6 | 4,878.0 | 0.4 |
| % breakdown | 10.6 | 11.6 | 1.8 | 11.6 | 11.4 | −0.3 | |
| Dairy products and alternatives: | Total volume | 876.6 | 1,111.7 | 4.9 | 1,148.1 | 1,278.9 | 2.8 |
| % breakdown | 2.1 | 2.7 | 5.2 | 2.8 | 3.0 | 2.1 | |
| Powder special baby milk formula | Total volume | 109.1 | 107.1 | −0.4 | 106.6 | 105.4 | −0.3 |
| % breakdown | 0.3 | 0.3 | 0.0 | 0.3 | 0.2 | −7.8 | |
| Powder milk drinks | Total volume | 4.1 | 3.8 | −1.5 | 3.7 | 3.7 | −0.5 |
| Plant-based milk products (including soy drinks) | Total volume | 763.3 | 1,000.8 | 5.6 | 1,037.7 | 1,169.8 | 3.2 |
| % breakdown | 1.8 | 2.3 | 5.0 | 2.4 | 2.6 | 2.5 | |
| Cooking ingredients and meals: | Total volume | 7,727.7 | 7,751.2 | 0.1 | 7,700.0 | 7,829.1 | 0.2 |
| % breakdown | 18.5 | 18.8 | 0.3 | 18.6 | 18.2 | −0.6 | |
| Ready meals | Total volume | 2,507.9 | 2,672.1 | 1.3 | 2,660.6 | 2,636.8 | −0.3 |
| % breakdown | 6.0 | 6.5 | 1.6 | 6.4 | 6.1 | −1.3 | |
| Salad dressings | Total volume | 5,219.9 | 5,079.1 | −0.5 | 5,039.3 | 5,192.3 | 0.4 |
| Staple foods: | Total volume | 21,866.0 | 21,031.2 | −0.8 | 21,478.9 | 22,990.4 | 1.8 |
| % breakdown | 52.3 | 51.1 | −0.5 | 51.8 | 53.6 | 1.0 | |
| Baked good (packaged flat bread, cakes) | Total volume | 219.8 | 227.0 | 0.6 | 229.5 | 237.8 | 0.9 |
| % breakdown | 0.5 | 0.6 | 3.7 | 0.6 | 0.6 | 0.0 | |
| Chilled meat and seafood substitutes | Total volume | 0.8 | 289.4 | 224.8 | 419.5 | 766.4 | 21.5 |
| Instant noodle cups | Total volume | 5,257.0 | 5,445.8 | 0.7 | 5,463.7 | 5,520.7 | 0.3 |
| % breakdown | 12.6 | 13.2 | 0.9 | 13.2 | 12.9 | −0.5 | |
| Processed meat (poultry, red meat) | Total volume | 15,494.3 | 14,273.5 | −1.6 | 14,565.1 | 15,640.6 | 1.8 |
| % breakdown | 39.2 | 37.3 | −1.0 | 38.1 | 40.1 | 1.5 | |
| Tofu and derivatives | Total volume | 894.2 | 795.5 | −2.3 | 801.2 | 825.0 | 0.7 |
| % breakdown | 2.1 | 1.9 | −2.0 | 1.9 | 1.9 | 0.0 | |
| Pet - dog and cat food: | Total volume | 6,888.7 | 6,445.7 | −1.3 | 6,327.1 | 5,929.3 | −1.7 |
| % breakdown | 16.5 | 15.7 | −1.0 | 15.3 | 13.8 | −2.5 | |
|
Source: Euromonitor, 2023 *CAGR: Compound Annual Growth Rate |
|||||||
Retail sales
Meat and seafood substitutes was the best performing category in Japan in 2022, with retail value sales rising by 31% in current terms to JPY4.2 billion. Despite this growth, processed meat and seafood is set to see a retail volume decline, due to unit price increases of imported meat (especially for beef) and rising energy and shipping costs due to the steep rise in the price of crude oil. As a result, consumption of processed meat and seafood have reduced with consumers shifting more to affordable options, such as fresh food or other staple food products in 2022. Nevertheless, meat and seafood alternatives have continued to see significant growth driven by the ongoing pre-pandemic healthy eating trend. Japanese consumers believe that plant-based products are generally considered healthier, whereby more time spent in the home during COVID-19 has led to more consumers trying out meat and seafood substitutes for the first time, supporting growth in this segment.Footnote 6
High in protein food products
Products with a high source of protein ingredients (animal or non-animal derived) registered total sales of US$97.5 million in 2022. Generally, products that contain the highest source of protein ingredients included staple foods such as processed meat, seafood and alternatives to meat (including tofu and derivatives) at a sales value of US$184.3 million, instant noodles (US$96.9 million), and baked bread goods (US$95.6 million). Other high in protein products included dairy products and plant-based milk drinks (including cheese, dairy desserts) at a value of US$80.9 million, savoury/salty/trail mixes/meat/seafood snacks (US$60.8 million), and sweet biscuits, snack bars and fruit snacks (US$31.9 million) in 2022. Over the historical period (2019 to 2022), the highest sales growth category for high in protein food products was for instant noodles at a CAGR of 64.9%, followed by baked bread goods (55.1%). During this time, the highest drops in sales value were found within the baby milk formula category at a CAGR of −27%, along with dairy products and plant-based milk drinks (−14.2%).
| Category | 2019 | 2020 | 2021 | 2022 |
|---|---|---|---|---|
| High in protein snacks | 90.4 | 100.8 | 96.1 | 97.5 |
| Sweet biscuits, snack bars and fruit snacks | 44.8 | 43.5 | 32.8 | 31.9 |
| Confectionery | 5.2 | 6.0 | 4.8 | 4.9 |
| Savoury, salty, nut and seeds (trail mixes), meat or seafood snacks | 40.4 | 51.4 | 58.6 | 60.8 |
| High in protein dairy products and alternatives | 130.2 | 137.6 | 101.2 | 81.6 |
| Baby milk formula | 1.8 | 1.6 | 1.5 | 0.7 |
| Dairy and plant-based milk drinks (including cheese, dairy desserts) | 128.3 | 136.0 | 99.7 | 80.9 |
| High protein cooking ingredients and meals | 22.9 | 19.3 | 14.5 | 22.7 |
| Ready meals | 20.2 | 16.4 | 12.4 | 20.7 |
| Nut and seed based spreads | 2.7 | 2.9 | 2.1 | 2.0 |
| High protein staple foods | 180.9 | 226.7 | 303.8 | 387.3 |
| Baked goods (bread) | 25.6 | 56.2 | 94.9 | 95.6 |
| Breakfast cereals | 5.9 | 6.4 | 5.0 | 4.4 |
| Processed fruit and vegetables | 6.0 | 6.3 | 5.9 | 6.1 |
| Processed meat, seafood and alternatives to meat (including tofu and derivatives) | 121.7 | 133.6 | 129.1 | 184.3 |
| Rice, pasta and noodles | 21.6 | 24.2 | 68.9 | 96.9 |
| Total - high protein packaged food products | 424.4 | 484.4 | 515.6 | 589.1 |
| Source: Euromonitor International, 2023 | ||||
| Category | Annual growth % 2022/2021 | CAGR* % 2019-2022 | Total growth % 2019-2022 |
|---|---|---|---|
| High in protein snacks | 1.5 | 2.6 | 7.9 |
| Sweet biscuits, snack bars and fruit snacks | −2.7 | −10.7 | −28.8 |
| Confectionery | 2.1 | −2.0 | −5.8 |
| Savoury, salty, nut and seeds (trail mixes), meat or seafood snacks | 3.8 | 14.6 | 50.5 |
| High in protein dairy products and alternatives | −19.4 | −14.4 | −37.3 |
| Baby milk formula | −53.3 | −27.0 | −61.1 |
| Dairy and plant-based milk drinks (including cheese, milk drinks, dairy desserts) | −18.9 | −14.2 | −36.9 |
| High protein cooking ingredients and meals | 56.6 | −0.3 | −0.9 |
| Ready meals | 66.9 | 0.8 | 2.5 |
| Nut and seed based spreads | −4.8 | −9.5 | −25.9 |
| High protein staple foods | 27.5 | 28.9 | 114.1 |
| Baked goods (bread) | 0.7 | 55.1 | 273.4 |
| Breakfast cereals | −12.0 | −9.3 | −25.4 |
| Processed fruit and vegetables | 3.4 | 0.6 | 1.7 |
| Processed meat, seafood and alternatives to meat (including tofu and derivatives) | 42.8 | 14.8 | 51.4 |
| Rice, pasta and noodles | 40.6 | 64.9 | 348.6 |
| Total - high protein packaged food products | 11.6 | 14.3 | 38.8 |
|
Source: Euromonitor International, 2023 *CAGR: Compound Annual Growth Rate |
|||
| Category | 2022 | 2023 | 2024 | 2025 | 2026 | 2027 |
|---|---|---|---|---|---|---|
| High in protein snacks | 97.5 | 122.8 | 148.8 | 177.5 | 205.3 | 226.3 |
| Sweet biscuits, snack bars and fruit snacks | 31.9 | 36.0 | 40.7 | 45.6 | 50.7 | 55.9 |
| Confectionery | 4.9 | 8.0 | 12.0 | 16.3 | 20.5 | 24.8 |
| Savoury, salty, nut and seeds (trail mixes), meat or seafood snacks | 60.8 | 78.9 | 96.1 | 115.6 | 134.1 | 145.6 |
| High in protein dairy products and alternatives | 81.6 | 76.7 | 73.4 | 71.1 | 71.1 | 75.3 |
| Baby milk formula | 0.7 | 0.6 | 0.5 | 0.4 | 0.2 | 0.1 |
| Dairy and plant-based milk drinks (including cheese, milk drinks, dairy desserts) | 80.9 | 76.1 | 72.9 | 70.8 | 70.8 | 75.2 |
| High protein cooking ingredients and meals | 22.7 | 24.2 | 25.6 | 26.5 | 27.4 | 28.0 |
| Ready meals | 20.7 | 22.0 | 23.3 | 24.0 | 24.7 | 25.2 |
| Nut and seed based spreads | 2.0 | 2.2 | 2.3 | 2.5 | 2.7 | 2.8 |
| High protein staple foods | 387.3 | 463.2 | 532.5 | 600.5 | 669.6 | 734.7 |
| Baked goods (bread) | 95.6 | 108.6 | 120.1 | 130.1 | 137.9 | 145.1 |
| Breakfast cereals | 4.4 | 5.9 | 7.3 | 8.7 | 10.1 | 11.5 |
| Processed fruit and vegetables | 6.1 | 7.7 | 8.7 | 9.7 | 10.7 | 11.7 |
| Processed meat, seafood and alternatives to meat (including tofu and derivatives) | 184.3 | 253.4 | 317.1 | 380.0 | 446.3 | 508.7 |
| Rice, pasta and noodles | 96.9 | 87.5 | 79.2 | 72.0 | 64.8 | 57.8 |
| Total - high protein packaged food products | 589.1 | 686.9 | 780.3 | 875.6 | 973.4 | 1,064.3 |
| Source: Euromonitor International, 2023 | ||||||
| Category | Annual growth % 2023/2022 | CAGR* % 2022-2027 | Total growth % 2022-2027 |
|---|---|---|---|
| High in protein snacks | 10.2 | 18.3 | 132.1 |
| Sweet biscuits, snack bars and fruit snacks | 10.3 | 11.9 | 75.2 |
| Confectionery | 21.0 | 38.3 | 406.1 |
| Savoury, salty, nut and seeds (trail mixes), meat or seafood snacks | 8.6 | 19.1 | 139.5 |
| High in protein dairy products and alternatives | 5.9 | −1.6 | −7.7 |
| Baby milk formula | −50.0 | −32.2 | −85.7 |
| Dairy and plant-based milk drinks (including cheese, milk drinks, dairy desserts) | 6.2 | −1.5 | −7.0 |
| High protein cooking ingredients and meals | 2.2 | 4.3 | 23.3 |
| Ready meals | 2.0 | 4.0 | 21.7 |
| Nut and seed based spreads | 3.7 | 7.0 | 40.0 |
| High protein staple foods | 9.7 | 13.7 | 89.7 |
| Baked goods (bread) | 5.2 | 8.7 | 51.8 |
| Breakfast cereals | 13.9 | 21.2 | 161.4 |
| Processed fruit and vegetables | 9.3 | 13.9 | 91.8 |
| Processed meat, seafood and alternatives to meat (including tofu and derivatives) | 14.0 | 22.5 | 176.0 |
| Rice, pasta and noodles | −10.8 | −9.8 | −40.4 |
| Total - high protein packaged food products | 12.6 | 9.3 | 80.7 |
|
Source: Euromonitor International, 2023 *CAGR: Compound Annual Growth Rate |
|||
Plant-based food products
Plant-based food products registered total sales of US$948.2 million in 2022. Generally, plant-based dairy products registered the highest sales value in Japan at a total of US$825.4 million - consisting of plant-based milk (95.2%) and dairy free yogurt (4.8%). Plant-based cooking ingredients and meals brought sales of US$74.3 million - mostly for its ready meals (48.3%) and sauces, dips and condiments (48%) food categories in 2022. Plant-based snacks registered the third largest sales at a value of US$35.9 million - mostly for its savoury, salty, nut and seeds, meat or seafood snacks (61%); followed by plant-based dairy products and alternatives (US$11.2 million) - mostly for its drinking milk products (99.1%); and lastly plant-based stable foods (US$1.4 million) for its breakfast cereals (85.7%) and pasta (14.3%) in 2022.
Over the historical period (2019 to 2022), the highest sales growths for plant-based food products were within the plant-based snack cateogry at a CAGR of 53.6%, followed by plant-based cooking ingredients and meals (11.8%), and plant-based dairy products and alternatives (11.4%). Plant-based staple foods such as breakfast cereals and pasta are expected to be the highest growing category by a CAGR of 30% between 2022 to 2027.
| Category | 2019 | 2020 | 2021 | 2022 |
|---|---|---|---|---|
| Plant-based snacks | 9.9 | 11.3 | 11.5 | 35.9 |
| Sweet biscuits, snack bars and fruit snacks | 2.0 | 4.5 | 4.5 | 6.6 |
| Confectionery | 1.4 | 1.2 | 1.7 | 7.5 |
| Savoury, salty, nut and seeds (trail mixes), meat or seafood snacks | 6.4 | 5.6 | 5.2 | 21.9 |
| Plant-based dairy | 802.0 | 855.3 | 840.9 | 825.4 |
| Milk | 769.2 | 815.9 | 798.8 | 785.4 |
| Yogurt | 32.7 | 39.4 | 42.1 | 39.9 |
| Plant-based dairy products and alternatives | 8.1 | 9.4 | 10.4 | 11.2 |
| Prepared baby food | 0.1 | |||
| Drinking milk products | 8.1 | 9.4 | 10.4 | 11.1 |
| Plant-based cooking ingredients and meals | 53.1 | 55.6 | 59.2 | 74.3 |
| Ready meals | 29.1 | 24.4 | 24.3 | 35.9 |
| Sauces, dips and condiments | 21.6 | 27.5 | 31.6 | 35.7 |
| Sweet spreads (including honey, nut and seed based) | 2.4 | 3.7 | 3.2 | 2.7 |
| Plant-based staple foods | 1.3 | 1.5 | 1.7 | 1.4 |
| Breakfast cereals | 1.1 | 1.1 | 1.4 | 1.2 |
| Pasta | 0.2 | 0.4 | 0.3 | 0.2 |
| Total - plant-based packaged food products | 874.4 | 933.1 | 923.7 | 948.2 |
| Source: Euromonitor International, 2023 | ||||
| Category | Annual growth % 2022/2021 | CAGR* % 2019-2022 | Total growth % 2019-2022 |
|---|---|---|---|
| Plant-based snacks | 212.2 | 53.6 | 262.6 |
| Sweet biscuits, snack bars and fruit snacks | 46.7 | 48.9 | 230.0 |
| Confectionery | 341.2 | 75.0 | 435.7 |
| Savoury, salty, nut and seeds (trail mixes), meat or seafood snacks | 321.2 | 50.7 | 242.2 |
| Plant-based dairy | −1.8 | 1.0 | 2.9 |
| Milk | −1.7 | 0.7 | 2.1 |
| Yogurt | −5.2 | 6.9 | 22.0 |
| Plant-based dairy products and alternatives | 7.7 | 11.4 | 38.3 |
| Prepared baby food | |||
| Drinking milk products | 6.7 | 11.1 | 37.0 |
| Plant-based cooking ingredients and meals | 25.5 | 11.8 | 39.9 |
| Ready meals | 47.7 | 7.3 | 23.4 |
| Sauces, dips and condiments | 13.0 | 18.2 | 65.3 |
| Sweet spreads (including honey, nut and seed based) | −15.6 | 4.0 | 12.5 |
| Plant-based staple foods | −17.6 | 2.5 | 7.7 |
| Breakfast cereals | −14.3 | 2.9 | 9.1 |
| Pasta | −33.3 | 0.0 | 0.0 |
| Total - plant-based packaged food products | 2.7 | 2.7 | 8.4 |
|
Source: Euromonitor International, 2023 *CAGR: Compound Annual Growth Rate |
|||
| Category | 2022 | 2023 | 2024 | 2025 | 2026 | 2027 |
|---|---|---|---|---|---|---|
| Plant-based snacks | 35.9 | 37.4 | 40.4 | 42.0 | 44.9 | 47.4 |
| Sweet biscuits, snack bars and fruit snacks | 6.6 | 6.6 | 7.0 | 6.9 | 6.9 | 6.9 |
| Confectionery | 7.5 | 11.3 | 14.5 | 17.9 | 21.2 | 24.4 |
| Savoury, salty, nut and seeds (trail mixes), meat or seafood snacks | 21.9 | 19.6 | 18.9 | 17.2 | 16.7 | 16.1 |
| Plant-based dairy | 825.4 | 839.3 | 861.4 | 874.6 | 889.0 | 903.6 |
| Milk | 785.4 | 798.2 | 818.3 | 829.8 | 842.3 | 855.1 |
| Yogurt | 39.9 | 41.0 | 43.1 | 44.8 | 46.7 | 48.5 |
| Plant-based dairy products and alternatives | 11.2 | 14.9 | 18.1 | 20.7 | 23.2 | 25.5 |
| Prepared baby food | 0.1 | 0.2 | 0.2 | 0.2 | 0.2 | 0.2 |
| Drinking milk products | 11.1 | 14.7 | 17.9 | 20.6 | 23.0 | 25.3 |
| Plant-based cooking ingredients and meals | 74.3 | 94.1 | 107.6 | 120.6 | 135.9 | 149.3 |
| Ready meals | 35.9 | 46.2 | 55.0 | 63.6 | 72.2 | 81.0 |
| Sauces, dips and condiments | 35.7 | 44.8 | 49.2 | 53.4 | 59.8 | 64.2 |
| Sweet spreads (including honey, nut and seed based) | 2.7 | 3.0 | 3.3 | 3.6 | 3.8 | 4.1 |
| Plant-based staple foods | 1.4 | 2.1 | 2.9 | 3.6 | 4.4 | 5.2 |
| Breakfast cereals | 1.2 | 1.9 | 2.6 | 3.4 | 4.1 | 4.9 |
| Pasta | 0.2 | 0.2 | 0.2 | 0.2 | 0.3 | 0.3 |
| Total - plant-based packaged food products | 948.2 | 987.8 | 1,030.4 | 1,061.5 | 1,097.4 | 1,131.0 |
| Source: Euromonitor International, 2023 | ||||||
| Category | Annual growth % 2023/2022 | CAGR* % 2022-2027 | Total growth % 2022-2027 |
|---|---|---|---|
| Plant-based snacks | 5.6 | 5.7 | 32.0 |
| Sweet biscuits, snack bars and fruit snacks | 0.0 | 0.9 | 4.5 |
| Confectionery | 15.1 | 26.6 | 225.3 |
| Savoury, salty, nut and seeds (trail mixes), meat or seafood snacks | −3.6 | −6.0 | −26.5 |
| Plant-based dairy | 1.6 | 1.8 | 9.5 |
| Milk | 1.5 | 1.7 | 8.9 |
| Yogurt | 3.9 | 4.0 | 21.6 |
| Plant-based dairy products and alternatives | 9.9 | 17.9 | 127.7 |
| Prepared baby food | 0.0 | 14.9 | 100.0 |
| Drinking milk products | 10.0 | 17.9 | 127.9 |
| Plant-based cooking ingredients and meals | 9.9 | 15.0 | 100.9 |
| Ready meals | 12.2 | 17.7 | 125.6 |
| Sauces, dips and condiments | 7.4 | 12.5 | 79.8 |
| Sweet spreads (including honey, nut and seed based) | 7.9 | 8.7 | 51.9 |
| Plant-based staple foods | 18.2 | 30.0 | 271.4 |
| Breakfast cereals | 19.5 | 32.5 | 308.3 |
| Pasta | 0.0 | 8.4 | 50.0 |
| Total - plant-based packaged food products | 3.6 | 3.1 | 19.3 |
|
Source: Euromonitor International, 2023 *CAGR: Compound Annual Growth Rate |
|||
Competitive landscape
In 2022, packaged food top companies (brands) for animal/non-animal derived high in protein ingredients products in Japan included the Sanko Seika Co. Ltd. (Sanko) at a market share of 8.9% (US$8.7 million) in the snacks category; Hida Alimentacion SA (Hida) at 30.1% (US$24.6 million) in the dairy products and alternatives category; Reborne Pte Ltd. (Xndo) at 20.8% (US$4.7 million) in the cooking ingredients and meals category; and Nissin Foods Holdings Co. Ltd. (Nissin, Soba) at 19.7% (US$76.3 million) in the staple foods category.
| Category | Company | Top brand(s) | Retail sales (US$ million) | Market share % in 2022 |
|---|---|---|---|---|
| Snacks | Sanko Seika Company Ltd. | Sanko | 8.7 | 8.9 |
| Morinaga and Company Ltd. | Morinaga | 5.7 | 5.8 | |
| Link Snacks Inc. | Jack Link's | 4.3 | 4.4 | |
| Total - high in protein snacks | 97.5 | 100.0 | ||
| Dairy products and alternatives | Hida Alimentacion SA | Hida | 24.6 | 30.1 |
| Marusanai Company Ltd. | Marusan | 12.3 | 15.1 | |
| Meiji Holdings Company Ltd. | Meiji | 10.2 | 12.5 | |
| Total - high in protein dairy products and alternatives | 81.6 | 100.0 | ||
| Cooking ingredients and meals | Reborne Pte Ltd. | Xndo | 4.7 | 20.8 |
| De Burg Groep BV | Burg | 3.1 | 13.7 | |
| Ezaki Glico Company Ltd. | Sunao | 1.6 | 6.9 | |
| Total - high in protein cooking ingredients and meals | 22.7 | 100.0 | ||
| Staple foods | Nissin Foods Holdings Co. Ltd. | Nissin, Soba | 76.3 | 19.7 |
| Mestemacher GmbH | Mestemacher | 50.2 | 13.0 | |
| Prima Meat Packers Ltd. | Prima Ham | 25.6 | 6.6 | |
| Private label | Private label | 1.1 | 0.3 | |
| Total - high in protein staple foods | 387.3 | 100.0 | ||
| Source: Euromonitor International, 2023 | ||||
In 2022, packaged food top companies (brands) for plant-based products in Japan included Select AS (Signature) at a market share of 17.7% (US$6.4 million) in the snacks category; Marusanai Company Ltd. (Marusan) at 21.4% (US$2.4 million) in the dairy products and alternatives category; Sokensha Company Ltd. (Sokensha) at 28.4% (US$21.2 million) in the cooking ingredients and meals category; and Nature's Path Foods Inc. (Nature's Path) at 42.5% (US$0.6 million) in the staple foods category.
| Category | Company | Top brand(s) | Retail sales (US$ million) | Market share %in 2022 |
|---|---|---|---|---|
| Snacks | Select AS | Signature | 6.4 | 17.7 |
| MWA Comercio De Produtos Alimenticios Ltda | Natural Life | 1.5 | 4.2 | |
| Link Snacks Inc. | Jack Link's | 1.5 | 4.1 | |
| Total - plant-based snacks | 35.9 | 100.0 | ||
| Dairy products and alternatives | Marusanai Company Ltd. | Marusan | 2.4 | 21.4 |
| Danone, Groupe | Alpro, Provamel | 1.5 | 13.1 | |
| Cereal Base CEBA AB | Oatly | 1.0 | 9.3 | |
| Total - plant-based dairy products and alternatives | 11.2 | 100.0 | ||
| Cooking ingredients and meals | Sokensha Company Ltd. | Sokensha | 21.1 | 28.4 |
| Kagome Company Ltd. | Kagome | 17.2 | 23.1 | |
| Moranbong Company Ltd. | Moranbong | 6.3 | 8.4 | |
| Total - plant-based cooking ingredients and meals | 74.3 | 100.0 | ||
| Staple foods | Nature's Path Foods Inc. | Nature's Path | 0.6 | 42.5 |
| Barilla Holding SpA | Barilla | 0.2 | 15.0 | |
| Total - plant-based staple foods | 1.4 | 100.0 | ||
| Source: Euromonitor International, 2023 | ||||
New product launches
Mintel indicated that there were 1,203 new high in protein or plant-based food (787), drink (303), pet food (102), and health (11) products launched in Japan's grocery retailer outlets (including new variety/range extension, packaging, formulation or relaunched) between the period of January 2018 and August 4th, 2023: which consisted of 24.4% claims suitable for plant-based (294) and 79.3% of high/added protein (954) products.
Note: each product can contain more than one of these claims
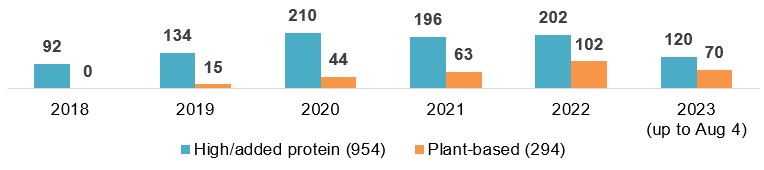
Description of above image
| 2018 | 2019 | 2020 | 2021 | 2022 | 2023 (up to August 4) | Total | |
|---|---|---|---|---|---|---|---|
| High/added protein | 92 | 134 | 210 | 196 | 202 | 120 | 954 |
| Plant-based | 0 | 15 | 44 | 63 | 102 | 70 | 294 |
Source: Mintel, 2023
Meat substitute launches in Asia with meat and poultry flavours are surging ahead in the retail market. Asian consumers are interested in reducing their meat intake mostly as a dietary staple, and many want to enjoy the same meat-like taste and texture of meat. Asian consumers are also keen on having a diverse range of meat flavour-inspired options (including fauna - dark fruit, light tannins wine flavours), along with infused flavours like pairing umami vegetables and seaweed with plant-based meat substitutes.Footnote 7
The APAC region seek health dietary attributes, which are linked to longevity and disease prevention. Meat substitute brands are highlighting high protein, low/no/reduced cholesterol content, added fibre and other better-for-you or nutritional beneficial claims; while reducing artificial ingredients. Consumers in India are increasingly conscious of the nutritional value of what they eat, whereby 38% (sample size= 3,000) believe that eating a plant-based diet can help to reduce the risk of diseases.Footnote 7
Leading parent companies launching plant-based or high/added protein food and drink products (1,257) in Japan between Q3-2022 and Q3-2023 were Meiji (47), Morinaga and Co. (26), Kagome (17), NatureLab (14), Ezaki Glico (11), and Kameda Seika (10). New brands appearing for the first time launched in the Japanese market within the last 6 months, included Cycle.me (milk chocolate crunch with protein), Melodian Mini (almond milk creamer), Morinaga Partheno (Greek yogurt with Muscat sauce) and Innocent (chocolate banana flavoured cricket soy protein).
Top categories for plant-based or high/added protein claims in Japan were processed fish, meat and egg products (+900%), bakery (+600%), ready-to-drink products (+200%), meals and meal centres (+175%), dairy (+150%), breakfast cereals (+50%), desserts and ice cream (+50%), and nutritional drinks and other beverages (31%) between Q3-2022 and Q3-2023. While declining categories included sauces and seasonings (−56%) and snacks (−50%). New baby food ingredients appearing within the last 12 months included chloride, ferrous citrate, molasses, vanilla sugar, celery concentrate, beetroot juice concentrate, yellow curry paste, and toffee nut flavour. The fastest growing flavours in these products were curry (+400%), cocoa/cacao (+300%), and chocolate, milk, cheese, tea (each at +200%) between Q3-2021 and Q3-2023.
Top claims and claim combinations used most often in the last three months for high/added and/or plant-based protein food and beverage (not including pet food) product launches included high/added protein, ethical - environmentally friendly package and sustainable habitat/resources, vitamin/mineral fortified, plant based, and low/no/reduced fat. Top growing plant-based and high in protein claims were free from added/artificial flavourings (+400%), low/no/reduced calories (+267%), low/no/reduced allergen (+200%), on-the-go (+200%), and dairy free (+150%) between Q2-2022 and Q2-2023. Meanwhile during the same period, declining claims by −100% were maternal, organic, and caffeine free, followed by free from added/artificial preservatives (−75%) or no additives/preservatives (−67%).
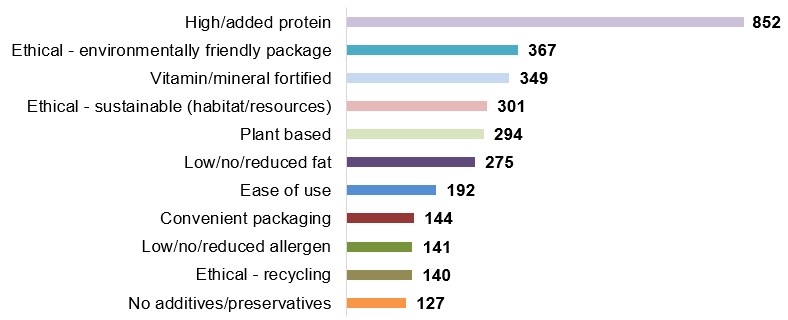
Description of above image
- High/added protein: 852
- Ethical - environmentally friendly package: 367
- Vitamin/mineral fortified: 349
- Ethical - sustainable (habitat/resources): 301
- Plant based: 294
- Low/no/reduced fat: 275
- Ease of use: 192
- Convenient packaging: 144
- Low/no/reduced allergen: 141
- Ethical - recycling: 140
- No additives/preservatives: 127
Source: Mintel, 2023
Total item count (excluding pet food): 1,101
| Product attributes | Yearly launch - item count | ||||||
|---|---|---|---|---|---|---|---|
| 2018 | 2019 | 2020 | 2021 | 2022 | 2023 | Total | |
| Yearly product launches | 70 | 124 | 234 | 232 | 268 | 173 | 1,101 |
| Top launch types | |||||||
| New variety/range extension | 28 | 53 | 73 | 102 | 101 | 65 | 422 |
| New product | 16 | 24 | 82 | 52 | 91 | 62 | 327 |
| Relaunch | 16 | 25 | 61 | 60 | 61 | 39 | 262 |
| New packaging | 10 | 22 | 18 | 18 | 15 | 7 | 90 |
| Top sub-categories | |||||||
| Nutritional and meal replacement drinks | 28 | 35 | 49 | 38 | 48 | 39 | 237 |
| Spoonable yogurt | 21 | 34 | 29 | 27 | 16 | 16 | 143 |
| Snack/cereal/energy bars | 4 | 6 | 27 | 21 | 22 | 16 | 96 |
| Fish products | 2 | 6 | 11 | 13 | 10 | 6 | 48 |
| Plant based drinks (dairy alternatives) | 0 | 5 | 12 | 9 | 10 | 8 | 44 |
| Top five companies / parent | |||||||
| Morinaga and Company/Milk Industry/Seika | 26 | 34 | 57 | 45 | 32 | 32 | 226 |
| Meiji | 31 | 33 | 56 | 33 | 38 | 19 | 210 |
| Aeon | 6 | 7 | 29 | 15 | 12 | 5 | 74 |
| Asahi Group Foods | 8 | 20 | 39 | 18 | 13 | 11 | 109 |
| Groupe Danone | 8 | 9 | 13 | 4 | 5 | 5 | 44 |
| Top five brands | |||||||
| Meiji-Savas/Tanpact/The Greek Yogurt | 19 | 27 | 41 | 16 | 23 | 12 | 138 |
| Morinaga-Partheno Girisha Yogurt/In Bar/In Protein | 1 | 10 | 13 | 19 | 12 | 12 | 67 |
| Topvalu (Vegetive) | 5 | 4 | 24 | 13 | 12 | 3 | 61 |
| Natural Lawson | 0 | 3 | 2 | 4 | 7 | 5 | 21 |
| Luna Ísey Skyr | 0 | 0 | 7 | 7 | 5 | 1 | 20 |
| Import status (if reported) | |||||||
| Not imported | 25 | 25 | 48 | 51 | 28 | 39 | 216 |
| Imported | 1 | 3 | 8 | 6 | 13 | 10 | 41 |
| Location of manufacture | |||||||
| Japan | 25 | 25 | 48 | 51 | 28 | 39 | 216 |
| Thailand | 0 | 2 | 0 | 2 | 3 | 3 | 10 |
| China | 0 | 0 | 0 | 0 | 4 | 3 | 7 |
| France | 1 | 0 | 1 | 2 | 0 | 2 | 6 |
| Greece | 0 | 0 | 0 | 1 | 3 | 1 | 5 |
| Canada (10) | 0 | 0 | 0 | 0 | 1 | 0 | 1 |
| Top five flavours (including blend) | |||||||
| Unflavoured/plain | 19 | 30 | 63 | 63 | 44 | 39 | 258 |
| Chocolate | 4 | 6 | 11 | 8 | 8 | 9 | 46 |
| Cocoa/cacao | 2 | 4 | 14 | 8 | 2 | 4 | 34 |
| Strawberry | 2 | 5 | 8 | 7 | 5 | 3 | 30 |
| Yogurt | 2 | 6 | 8 | 2 | 5 | 3 | 26 |
| Top package types | |||||||
| Flexible (stand-up pouch/sachet) | 27 | 54 | 124 | 119 | 155 | 104 | 583 |
| Tub | 21 | 40 | 58 | 47 | 49 | 34 | 249 |
| Carton | 9 | 27 | 37 | 34 | 39 | 22 | 168 |
| Tray | 5 | 0 | 5 | 16 | 7 | 3 | 36 |
| Bottle | 2 | 1 | 6 | 6 | 9 | 7 | 31 |
| Source: Mintel; Global New Product Database, 2023 | |||||||
Examples of new products
Milk Chocolate Crunch with Protein
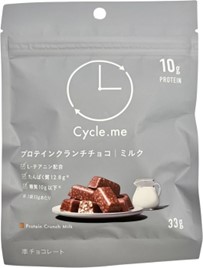
Source: Mintel, 2023
| Company / distributor | Cleat |
|---|---|
| Brand | Cycle.me |
| Sub-category | Chocolate confectionery |
| Market | Japan |
| Related claims | High / added protein |
| Related ingredients | Soybean proteins (domestic), vegetable oils |
| Store name | 7-Eleven, Suginami-ku, Tokyo 166-0002 |
| Store type | Convenient store |
| Date published | July 2023 |
| Launch type | New product |
| Price in US dollars | 1.54 |
This product retails in a 33 gram pack. Contains L-theanine and 12.8 grams protein. Has less than 10 gram of sugar. Bite-sized, crunchy chocolates with protein. Launched on June 20, 2023, only available at 7-Eleven. Also, available in white or dark chocolate protein bars.
Chocolate Banana Flavoured Cricket Soy Protein
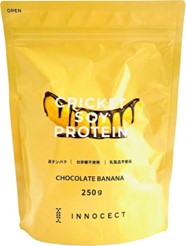
Source: Mintel, 2023
| Company / distributor | Odd Future |
|---|---|
| Brand | Innocent |
| Category | Nutritional and meal replacement drinks |
| Market | Japan |
| Related claims | Low / no / allergen, high/ added protein, Convenient packaging, dairy free |
| Related ingredients | Chinese soybean protein, dietary inulin, cricket powder, fish collagen |
| Store name | Innocent |
| Store type | Internet / mail order |
| Date published | July 2023 |
| Launch type | New product |
| Price in US dollars | 19.04 |
This product retails in a 250 gram pack. High in protein, and made without white sugar or dairy. Preparation instructions are on the pack. Resealable pack bear s a table comparing with cows how much protein per 100 gram the product provides and how much greenhouse gas emissions it produces. Launched on July 1, 2023, only available in some retailers and online.
Chinese-Style Rice & Mapo Aubergine
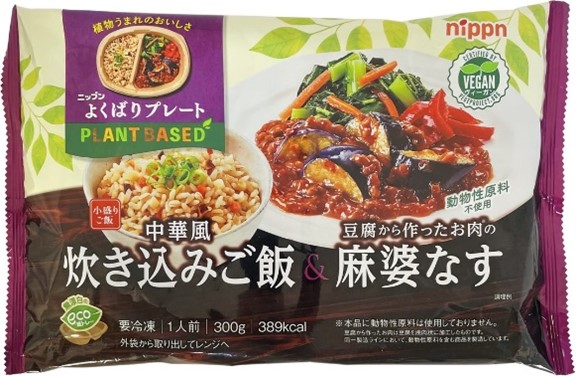
Source: Mintel, 2023
| Company / manufacturer | Nippn Corporation / Flour Milles |
|---|---|
| Brand | Nippn Yokubari Plate Plant Based |
| Category | Meals and meal centers, prepared meals |
| Market | Japan, not imported |
| Related claims | Microwaveable, vegan/ no animal ingredients, plant based |
| Store name / location | Ito Yokado, Hachiouji-shi, Tokyo |
| Store type | Supermarket |
| Date published | May 2023 |
| Launch type | New product |
| Price in US dollars | 2.69 |
This product retails in a 300 gram pack. Free from animal ingredients. Feature tofu. Serve one. Microwaveable. Pack comes with an environmentally unbleached paper tray, and is partly printed with botanical biomass ink. Launched on March 1 2023, open-priced.
Butter Chicken Curry
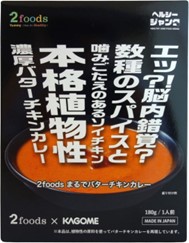
Source: Mintel, 2023
| Company / manufacturer | Kagome |
|---|---|
| Brand | 2 Foods x Kagome |
| Category | Meals and meal centers, prepared meals |
| Market | Japan, not imported |
| Related claims | Microwaveable, cobranded, ease of use, plant based |
| Store name | Yodobashi Online Store |
| Store type | Internet / mail order |
| Date published | May 2023 |
| Launch type | New product |
| Price in US dollars | 4.35 |
This product retails in a 180 gram pack. Authentic plant-based rich butter chicken curry made with a variety of spices and chewy soy chicken. Serves one. Made by simmering soy meat that has richness and sweetness, and has a texture similar to chicken. Contains 150 gram worth of vegetables. Supervised by 2food. Ready to eat. Can be microwaved or boiled. Launched on April 4, 2023, open-priced.
For more information
The Canadian Trade Commissioner Service:
International Trade Commissioners can provide Canadian industry with on-the-ground expertise regarding market potential, current conditions and local business contacts, and are an excellent point of contact for export advice.
More agri-food market intelligence:
International agri-food market intelligence
Discover global agriculture and food opportunities, the complete library of Global Analysis reports, market trends and forecasts, and information on Canada's free trade agreements.
Agri-food market intelligence service
Canadian agri-food and seafood businesses can take advantage of a customized service of reports and analysis, and join our email subscription service to have the latest reports delivered directly to their inbox.
More on Canada's agriculture and agri-food sectors:
Canada's agriculture sectors
Information on the agriculture industry by sector. Data on international markets. Initiatives to support awareness of the industry in Canada. How the department engages with the industry.
For additional information on the Hi Japan (Functional Food and Health Ingredients) - 2023 Trade show held in Tokyo from October 4-6, please contact:
Alex Chen
Trade Commissioner (Agriculture and Food)
The Embassy of Canada to Japan
Government of Canada
jpn.commerce@international.gc.ca
Resources
- Euromonitor International | January 2023. Presentation: The Evolution of Plant Base – Eating and Beyond
- Euromonitor International | November 2022. Country Report: Processed meat, seafood and alternatives to meat in Japan
- Euromonitor | March 2022. Plant-Based Eating and Alternative Proteins in Middle East and Africa
- Euromonitor, 2023. Presentation: The Evolution of Plant Base – Eating and Beyond
- Mintel Global New Products Database, 2023
- Mintel | October 2022. A year of innovation in meat substitutes and eggs: Asia
- Walji, Amrin. Mintel | A year of innovation in plant-based drinks, yogurt & ice cream, 2023
Sector Trends Analysis – Plant-based protein food and drink trends in Japan
Global Analysis Report
Prepared by: Erin-Ann Chauvin, Senior Market Analyst
© His Majesty the King in Right of Canada, represented by the Minister of Agriculture and Agri-Food (2023).
Photo credits
All photographs reproduced in this publication are used by permission of the rights holders.
All images, unless otherwise noted, are copyright His Majesty the King in Right of Canada.
To join our distribution list or to suggest additional report topics or markets, please contact:
Agriculture and Agri-Food Canada, Global Analysis1341 Baseline Rd, Tower 5, 3rd floor
Ottawa ON K1A 0C5
Canada
Email: aafc.mas-sam.aac@agr.gc.ca
The Government of Canada has prepared this report based on primary and secondary sources of information. Although every effort has been made to ensure that the information is accurate, Agriculture and Agri-Food Canada (AAFC) assumes no liability for any actions taken based on the information contained herein.
Reproduction or redistribution of this document, in whole or in part, must include acknowledgement of agriculture and agri-food Canada as the owner of the copyright in the document, through a reference citing AAFC, the title of the document and the year. Where the reproduction or redistribution includes data from this document, it must also include an acknowledgement of the specific data source(s), as noted in this document.
Agriculture and Agri-Food Canada provides this document and other report services to agriculture and food industry clients free of charge.