

Note: This report includes forecasting data that is based on baseline historical data.
Executive summary
The United States (U.S.) meals and soups market was valued at US$63.3 billion in 2023, rising 9.1% annually over 2019-2023, partly induced by pandemic stay at home restrictions.
Between 2019 and 2023, the three fastest growing categories were food kits (17.1%), prepared salads (10.9%), and pizza (7.2%).
Under food kits, meal kits saw the fastest growth at 28.0% annually over 2019 to 2023 with chilled lunch kits and quick recipe kits seeing single digit growth.
The convenience of meal kits, especially during the pandemic, gave delivery meal kits a massive boost, with HelloFresh and Home Chef benefiting the most. Post pandemic sales growth is slower for the overall category; with inflationary trends impacting ingredient prices and consumer spending habits.
Sales growth of meals and soups is expected to slow to 3.9% annually over 2024 to 2028 due to reduced consumption to near pre-pandemic per capita levels.
Ready meals and soups sales are sold mainly in retail offline at supermarket and hypermarkets with around 80% market share, which have been effective at engaging consumer trust on value proposition and brand identity.
From 2019 to 2023, 5,620 ready meals and soups were launched in the U.S. The most popular product claim was microwavable (2,937 products from 2019 to 2023). Other popular claims include ethical, no/low claims, and free from.
Market size
The U.S. meals and soups market was valued at US$63.3 billion in 2023, rising 9.1% annually over 2019 to 2023, partly induced by pandemic stay at home restrictions. The top three categories in sales are ready meals (US$27.9 billion), food kits (US$12.6 billion) and prepared salads (US$9.8 billion). Between 2019 and 2023, the three fastest growing categories were food kits (17.1%), prepared salads (10.9%), and pizza (7.2%).
According to Euromonitor, over 2024 to 2028, sales growth of meals and soups is expected to slow to 3.9% annually as reduced consumption nears pre-pandemic per capita levels and inflation impacting ingredient prices and consumer spending habits. Post pandemic shifting social norms has given rise to a "grazing" consumption trend, which makes is making snacking and convenience more popular, which requires minimal preparation, such as specifically charcuterie style offerings in chilled lunch kits and newer single-serve products in frozen ready meals.
With respect to competition, Nestlé, HelloFresh, and Karft Heinz lead the way. Other major players are ConAgra and Campbell Soup.
| Category | 2019 | 2023 | CAGR* (%) 2019-2023 | 2024 | 2028 | CAGR* (%) 2023-2028 |
|---|---|---|---|---|---|---|
| Meals and soups | 44,742.6 | 63,297.6 | 9.1 | 64,918.5 | 75,585.3 | 3.9 |
| Ready meals | 21,471.70 | 27,951.20 | 6.8 | 28,455.20 | 32,072.40 | 3.0 |
| Food kits | 6,717.70 | 12,617.70 | 17.1 | 12,845.90 | 15,523.60 | 4.8 |
| Prepared salads | 6,470.70 | 9,793.30 | 10.9 | 10,306.30 | 12,623.20 | 5.2 |
| Pizza | 5,381.80 | 7,106.50 | 7.2 | 7,319.20 | 8,530.60 | 3.9 |
| Soup | 4,700.70 | 5,828.90 | 5.5 | 5,992.00 | 6,835.60 | 3.3 |
|
Source: Euromonitor International, 2024 *CAGR: Compound annual growth rate |
||||||
| Company | Retail sales (US$ millions) | Market share (%) |
|---|---|---|
| Nestlé SA | 6,122.7 | 9.7 |
| HelloFresh SE | 4,935.5 | 7.8 |
| Kraft Heinz Co | 4,415.3 | 7.0 |
| ConAgra Brands Inc | 3,823.9 | 6.0 |
| Campbell Soup Co | 2,861.6 | 4.5 |
| General Mills Inc | 2,621.2 | 4.1 |
| Chiquita Brands International Inc | 2,165.0 | 3.4 |
| Schwan Food Co, The | 1,660.0 | 2.6 |
| Tyson Foods Inc | 1,362.2 | 2.2 |
| Kroger Co | 1,299.7 | 2.1 |
| Private Label | 9,168.3 | 14.5 |
| Others | 12,053.6 | 19.0 |
| Source: Euromonitor International, 2024 | ||
Subsector analysis
Ready meals
Ready meals in the U.S. expanded 6.8% annually over 2019 to 2023 with sales hitting US$27.9 billion in 2023. Chilled ready meals saw the highest growth at 12.3% annually over 2019 to 2023 but is expected to grow more slowly by 5.1% annually over 2024 to 2028, reaching total sales of US$2.9 billion by 2028. All ready meal category sales are expected to slow by around half over 2024 to 2028.
Stouffers, Jimmy Dean, and Kraft are the leading brands in 2023. Other major brands are Marie Callender's and Hot Pockets with market shares of 3.3% each. According to Euromonitor, chilled ready meals has been showing significant activity in terms of new products and new brands. For example, Kevin's Natural Meals is a line of paleo- and keto-friendly chilled ready meals with an initial focus through e-commerce that was recently acquired by Mars.
| Category | 2019 | 2023 | CAGR* (%) 2019-2023 | 2024 | 2028 | CAGR* (%) 2023-2028 |
|---|---|---|---|---|---|---|
| Ready meals | 21,471.70 | 27,951.20 | 6.8 | 28,455.20 | 32,072.40 | 3.0 |
| Frozen ready meals | 15,940.40 | 20,599.20 | 6.6 | 20,862.20 | 23,502.70 | 3.0 |
| Dried ready meals | 2,445.20 | 3,047.20 | 5.7 | 3,103.30 | 3,320.90 | 1.7 |
| Chilled ready meals | 1,412.90 | 2,246.50 | 12.3 | 2,379.70 | 2,904.70 | 5.1 |
| Shelf stable ready meals | 1,673.20 | 2,058.30 | 5.3 | 2,109.90 | 2,344.10 | 2.7 |
|
Source: Euromonitor International, 2024 *CAGR: Compound annual growth rate |
||||||
| Brand (company) | Retail sales (US$ millions) | Market share (%) |
|---|---|---|
| Stouffer's (Nestlé SA) | 1,730.1 | 6.2 |
| Jimmy Dean (Tyson Foods Inc) | 1,227.0 | 4.4 |
| Kraft (Kraft Heinz Co) | 1,105.5 | 4.0 |
| Marie Callender's (ConAgra Brands Inc) | 927.9 | 3.3 |
| Hot Pockets (Nestlé SA) | 923.4 | 3.3 |
| Private Label | 2,786.6 | 10.0 |
| Others | 8,079.1 | 28.9 |
| Source: Euromonitor International, 2024 | ||
Soup
Soup in the U.S. expanded 5.5% annually over 2019 to 2023 with sales hitting US$5.8 billion in 2023. Sales growth is expected to grow more slowly by 3.3% annually over 2024 to 2028, reaching sales of US$6.8 billion by 2028.
According to Euromonitor, per capita consumption of store-bought soup has steadily decreased over the years and, after a brief pandemic related rise, looks set to continue its downwards trajectory. Major producers have struggled to grow this category, with new product lines, varieties, and health and wellness trends failing to increase sales. Shelf stable offerings still dominate the category overall, and are suffering from the same optics affecting shelf stable ready meals: a perception of inferior quality, excessive processing, and poor nutritional value.
Campbell's was the leading soup brand, accounting for 38.6% of the total retail value sales in 2023, followed by Progresso with 15.3% share.
| Category | 2019 | 2023 | CAGR* (%) 2019-2023 | 2024 | 2028 | CAGR* (%) 2023-2028 |
|---|---|---|---|---|---|---|
| Soup | 4,700.7 | 5,828.9 | 5.5 | 5,992.0 | 6,835.6 | 3.3 |
| Shelf stable soup | 3,706.60 | 4,543.50 | 5.2 | 4,648.90 | 5,220.20 | 2.9 |
| Chilled soup | 535.3 | 734.4 | 8.2 | 778.9 | 990.1 | 6.2 |
| Dry soup | 402.7 | 495.5 | 5.3 | 509.5 | 566.8 | 2.7 |
| Frozen soup | 56.2 | 55.4 | −0.3 | 54.6 | 58.5 | 1.7 |
|
Source: Euromonitor International, 2024 *CAGR: Compound annual growth rate |
||||||
| Brand (company) | Retail sales (US$ millions) | Market share (%) |
|---|---|---|
| Campbell's (Campbell Soup Co) | 2,247.2 | 38.6 |
| Progresso (General Mills Inc) | 892.5 | 15.3 |
| Panera Bread (Blount Fine Foods Corp) | 288.2 | 4.9 |
| Lipton (Unilever Group) | 175.0 | 3.0 |
| Pacific (Campbell Soup Co) | 165.1 | 2.8 |
| Private Label | 1,020.6 | 17.5 |
| Others | 633.7 | 10.9 |
| Source: Euromonitor International, 2024 | ||
Pizza
The pizza market grew 7.2% annually over 2019 to 2023, with retail sales of US$7.1 billion in 2023. It is expected to expand by 3.9% annually over 2024 to 2028, reaching sales of US$8.5 billion in 2028. DiGiomo led pizza sales with a market share of 25.6%, followed by Red Baron (13.8%) and Totinos (7.0%).
According to Euromonitor, frozen pizza has been an especially vibrant space in premiumization with entries from players outside of the category, such as Tillamook and Rao's, while newcomer Screamin' Sicilian has blazed its way onto shelves with eye-catching packaging that accentuate the product's ingredients.
| Category | 2019 | 2023 | CAGR* (%) 2019-2023 | 2024 | 2028 | CAGR* (%) 2022-2028 |
|---|---|---|---|---|---|---|
| Pizza | 5,381.8 | 7,106.5 | 7.2 | 7,319.2 | 8,530.6 | 3.9 |
| Frozen pizza | 5,189.7 | 6,883.5 | 7.3 | 7,093.1 | 8,291.0 | 4.0 |
| Chilled pizza | 192.1 | 222.9 | 3.8 | 226.1 | 239.6 | 1.5 |
|
Source: Euromonitor International, 2024 *CAGR: Compound annual growth rate |
||||||
| Brand (company) | Retail sales (US$ millions) | Market share (%) |
|---|---|---|
| DiGiorno (Nestlé SA) | 1,821.2 | 25.6 |
| Red Baron (Schwan Food Co, The) | 979.5 | 13.8 |
| Totino's (General Mills Inc) | 498.6 | 7.0 |
| Jack's (Nestlé SA) | 433.3 | 6.1 |
| Freschetta (Schwan Food Co, The) | 319.0 | 4.5 |
| Private Label | 1,181.4 | 16.6 |
| Others | 856.1 | 12.0 |
| Source: Euromonitor International, 2024 | ||
Food kits
Food kits grew fastest within meals and soups by 17.1% annually over 2019 to 2023 with sales of US$12.6 billion in 2023. Meal kits saw the fastest growth at 28.0% annually over 2019 to 2023 with chilled lunch kits and quick recipe kits seeing single digit growth.
The convenience of meal kits, especially during the pandemic, gave delivery meal kits a massive boost, with HelloFresh and Home Chef benefiting the most. Post pandemic sales growth is slower for the overall category with inflationary trends impacting ingredient prices and consumer spending habits.
According to Euromonitor, Blue Apron, which was the category leader, has struggled over the years against newer players as revenue, active customers, and number of orders falling in North America year over year. HelloFresh has been seeing similar struggles in 2023. Threats to the meal kits value proposition have built up post pandemic with changes in eating occasions and consumer confidence.
In addition, consumer behaviour including scheduling inconsistencies, fluctuating priorities, and shifting social norms have given rise to a "grazing" consumption trend, which has made snacking and convenience more popular. Furthermore, consumers are adapting what they have learned from meal kits and social media cooking trends and are stretching their dollars by directly purchasing fresh foods to cook at home.
| Category | 2019 | 2023 | CAGR* (%) 2019-2023 | 2024 | 2028 | CAGR* (%) 2023-2028 |
|---|---|---|---|---|---|---|
| Food kits | 6,717.7 | 12,617.7 | 17.1 | 12,845.9 | 15,523.6 | 4.8 |
| Meal kits | 2,940.4 | 7,887.8 | 28.0 | 7,828.4 | 9,387.9 | 4.6 |
| Chilled lunch kits | 2,610.6 | 3,366.1 | 6.6 | 3,573.9 | 4,466.1 | 5.7 |
| Quick recipe kits | 1,166.8 | 1,363.9 | 4.0 | 1,443.7 | 1,669.5 | 3.7 |
|
Source: Euromonitor International, 2024 *CAGR: Compound annual growth |
||||||
| Brand (company) | Retail sales (US$ millions) | Market share (%) |
|---|---|---|
| HelloFresh (HelloFresh SE) | 4,935.5 | 39.1 |
| Oscar Mayer (Kraft Heinz Co) | 2,077.2 | 16.5 |
| Home Chef (Kroger Co) | 1,299.7 | 10.3 |
| Blue Apron (Blue Apron Holdings Inc) | 471.6 | 3.7 |
| Hamburger Helper (Eagle Family Foods Inc) | 272.2 | 2.2 |
| Private Label | 526.3 | 4.2 |
| Others | 1,782.2 | 14.1 |
| Source: Euromonitor International, 2024 | ||
Distribution
Ready meals and soups sales are sold mainly at supermarket and hypermarkets with around 80% market share. According to Euromonitor, retail outlets have been effective at engaging consumer trust on value proposition and brand identity. From Aldi to Trader Joe's to Costco, private label offerings have benefitted from inflation-driven trading down as consumers are placing their faith in retail as a lifestyle brand, and ready meals are a core part of that sentiment. While many shoppers have found more private label offerings in their baskets, novel high-end offerings have also made inroads across categories.
According to e-commerce data, Walmart's company share of ready meals, driven by its Marketside and Great Value brands, poses a real threat to Nestlé and ConAgra. Continued mergers and acquisitions activity in retail, combined with immediate access to shopper data, has given private label lines versatility and leverage to not only corner value share, but to pivot according to fickle consumer demands.
| Outlet type | 2019 | 2023 | CAGR* (%) 2019-2023 | ||
|---|---|---|---|---|---|
| Actual | Share % | Actual | Share % | ||
| Total | 44,742.6 | 100 | 63,297.6 | 100 | 9.1 |
| Retail offline | 37,582.9 | 84.0 | 49,622.2 | 78.4 | 7.2 |
| Grocery retailers | 35,949.1 | 80.3 | 47,890.8 | 75.7 | 7.4 |
| Convenience retail | 898.8 | 2.0 | 1,111.2 | 1.8 | 5.4 |
| Convenience stores | 861.0 | 1.9 | 1,076.7 | 1.7 | 5.7 |
| Forecourt retailers | 37.7 | 0.1 | 34.5 | 0.1 | −2.2 |
| Supermarkets | 15,425.7 | 34.5 | 20,071.6 | 31.7 | 6.8 |
| Hypermarkets | 15,825.5 | 35.4 | 21,196.8 | 33.5 | 7.6 |
| Discounters | 1,180.7 | 2.6 | 1,675.3 | 2.6 | 9.1 |
| Warehouse clubs | 1,170.7 | 2.6 | 1,542.5 | 2.4 | 7.1 |
| Small Local grocers | 1,447.7 | 3.2 | 2,293.4 | 3.6 | 12.2 |
| Non-grocery retailers | 1,446.0 | 3.2 | 1,573.7 | 2.5 | 2.1 |
| General merchandise stores | 408.0 | 0.9 | 361.3 | 0.6 | −3.0 |
| Health and beauty specialists | 1,038.1 | 2.3 | 1,212.3 | 1.9 | 4.0 |
| Direct selling | 7.8 | 0.4 | 4.7 | 0.2 | −11.7 |
| Retail E-commerce | 179.9 | 16.0 | 153.0 | 21.6 | −4.0 |
|
Source: Euromonitor International, 2024 *CAGR: Compound annual growth rate |
|||||
New product launch analysis
From 2019 to 2023, 5,620 ready meals and soups were launched in the U.S. The most popular product claim was microwavable (2,937 products from 2019 to 2023). Other popular claims include ethical, no/low claims, and free from. Companies with the highest number of new product launches over 2019 to 2023 was Nestlé with 245 products, followed by Aldi (225) and H-E-B (210). Over half of the product launches (1,304) were new products. The top five packaging types included flexible (1,728), tray (1,406), and tub (779).
| Product attributes | Number of new products by year | Total | ||||
|---|---|---|---|---|---|---|
| 2019 | 2020 | 2021 | 2022 | 2023 | ||
| Yearly product launches | 1,328 | 1,191 | 1,061 | 908 | 1,132 | 5,620 |
| Top 10 claims | ||||||
| Microwaveable | 652 | 625 | 560 | 439 | 661 | 2,937 |
| Ease of use | 446 | 365 | 308 | 266 | 337 | 1,722 |
| No additives/preservatives | 425 | 386 | 307 | 260 | 321 | 1,699 |
| Ethical - environmentally friendly package | 324 | 318 | 306 | 343 | 336 | 1,627 |
| Ethical - recycling | 307 | 287 | 283 | 310 | 303 | 1,490 |
| Free from added/artificial flavourings | 306 | 262 | 203 | 188 | 213 | 1,172 |
| Low/no/reduced allergen | 277 | 257 | 227 | 184 | 217 | 1,162 |
| Gluten free | 250 | 234 | 209 | 172 | 200 | 1,065 |
| Free from added/artificial preservatives | 288 | 240 | 189 | 136 | 180 | 1,033 |
| Social media | 222 | 207 | 186 | 193 | 211 | 1,019 |
| Top 10 companies | ||||||
| Nestlé | 48 | 76 | 48 | 24 | 49 | 245 |
| Aldi | 48 | 40 | 70 | 37 | 30 | 225 |
| H-E-B | 106 | 67 | 25 | 11 | 1 | 210 |
| ConAgra Brands | 53 | 50 | 31 | 36 | 34 | 204 |
| Giant Eagle | 53 | 38 | 28 | 41 | 35 | 195 |
| Campbell Soup Company | 26 | 24 | 27 | 27 | 48 | 152 |
| Kroger | 31 | 44 | 36 | 10 | 18 | 139 |
| Walmart | 32 | 15 | 14 | 30 | 25 | 116 |
| Trader Joe's | 19 | 24 | 31 | 16 | 21 | 111 |
| Whole Foods Market | 19 | 29 | 16 | 19 | 27 | 110 |
| Top 5 flavours (including blend) | ||||||
| Chicken | 42 | 55 | 44 | 42 | 54 | 237 |
| Pepperoni | 40 | 32 | 31 | 33 | 33 | 169 |
| Cheese | 30 | 28 | 31 | 16 | 23 | 128 |
| Three/Four/mixed cheeses | 26 | 29 | 26 | 20 | 22 | 123 |
| Mac and cheese/macaroni & cheese | 17 | 13 | 25 | 23 | 21 | 99 |
| Launch types | ||||||
| New variety/range extension | 610 | 482 | 445 | 376 | 420 | 2,333 |
| New product | 305 | 259 | 260 | 188 | 292 | 1,304 |
| New packaging | 273 | 204 | 214 | 229 | 271 | 1,191 |
| Relaunch | 102 | 115 | 75 | 61 | 87 | 440 |
| New formulation | 11 | 7 | 10 | 2 | 2 | 32 |
| Top 5 package types | ||||||
| Flexible | 357 | 274 | 318 | 384 | 395 | 1,728 |
| Tray | 367 | 291 | 274 | 170 | 304 | 1,406 |
| Tub | 179 | 175 | 139 | 115 | 171 | 779 |
| Carton | 272 | 207 | 128 | 31 | 33 | 671 |
| Not Specified | 0 | 3 | 26 | 69 | 54 | 152 |
| Location of manufacturer | ||||||
| Not specified | 1,006 | 918 | 774 | 713 | 849 | 4,260 |
| United States | 196 | 154 | 133 | 100 | 145 | 728 |
| Canada | 45 | 41 | 48 | 20 | 40 | 194 |
| Italy | 9 | 19 | 37 | 19 | 32 | 116 |
| Thailand | 17 | 8 | 22 | 8 | 5 | 60 |
| Source: Mintel GNPD, 2024 | ||||||
Examples of new product launches
Savory Lorraine Quiche
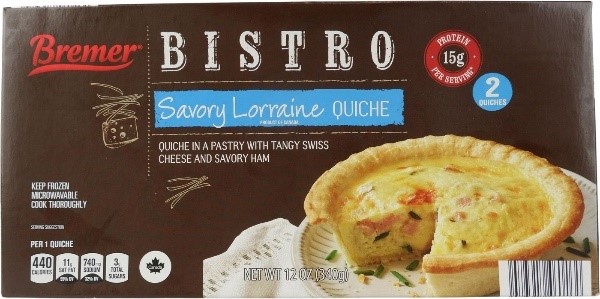
| Company | JSUT International |
|---|---|
| Brand | BB Amino |
| Category | Meals and meal centers |
| Sub-category | Pastry dishes |
| Market | United States |
| Store name | Aldi |
| Store type | Supermarket |
| Launch type | New packaging |
| Price in US dollars | 4.99 |
Bremer Bistro Savory Lorraine Quiche has been repackaged, and retails in a 12-ounce pack containing two units. - Quiche in a pastry with tangy Swiss cheese and savory ham - 15 grams protein per serving - Contains bioengineered food ingredients - Microwavable - Cooking instructions - Logos and certifications: How2Recycle
Plant-Based Spicy Sno' Crab Roll
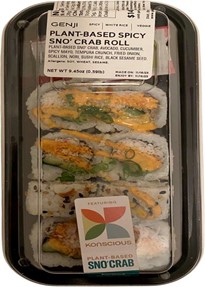
| Company | Genji |
|---|---|
| Brand | Genji |
| Category | Meals and meal centers |
| Sub-category | Prepared meals |
| Market | United States |
| Store name | Whole Foods Market |
| Launch type | New variety / range extension |
| Price in US dollars | 14.49 |
Genji Plant-Based Spicy Sno' Crab Roll contains Spicy - White rice - Veggie - Plant-based Sno' Crab, avocado, cucumber, spicy mayo, tempura crunch, fried onion, scallion, nori, sushi rice, black sesame seed - Featuring Konscious plant-based Sno' Crab - Made fresh daily.
Classic Crust Canadian Style Bacon Pizza
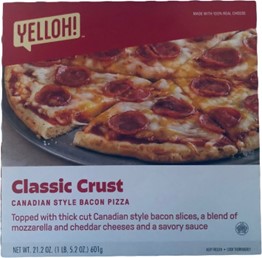
| Company | Cygnus Home Service |
|---|---|
| Brand | Yelloh! |
| Category | Meals and meal centers |
| Sub-category | Pizzas |
| Market | United States |
| Location of manufacture | United States |
| Store name | Schwan's |
| Launch type | Relaunch |
| Price in US dollars | 7.99 |
Yelloh! Classic Crust Canadian Style Bacon Pizza has been relaunched with a new brand name, previously Schwan's. Topped with thick cut Canadian style bacon slices, a blend of mozzarella and cheddar cheeses and a savory sauce - Contains a bioengineered food ingredient.
Creamy Chicken Wild Rice Soup
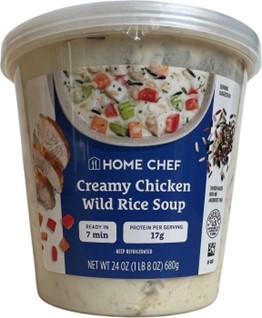
| Company | Relish Labs |
|---|---|
| Brand | Home Chef |
| Category | Soup |
| Sub-category | Wet soup |
| Market | United States |
| Store name | Mariano's |
| Launch type | New variety / range extension |
| Price in US dollars | 6.99 |
Home Chef Creamy Chicken Wild Rice Soup retails in a 24-ounce pack. - 17 gram protein per serving - Made of chicken raised with no antibiotics ever - Preparation instructions - Microwavable.
For more information
The Canadian Trade Commissioner Service:
International Trade Commissioners can provide Canadian industry with on-the-ground expertise regarding market potential, current conditions and local business contacts, and are an excellent point of contact for export advice.
More agri-food market intelligence:
International agri-food market intelligence
Discover global agriculture and food opportunities, the complete library of Global Analysis reports, market trends and forecasts, and information on Canada's free trade agreements.
Agri-food market intelligence service
Canadian agri-food and seafood businesses can take advantage of a customized service of reports and analysis, and join our email subscription service to have the latest reports delivered directly to their inbox.
More on Canada's agriculture and agri-food sectors:
Canada's agriculture sectors
Information on the agriculture industry by sector. Data on international markets. Initiatives to support awareness of the industry in Canada. How the department engages with the industry.
Resources
- Euromonitor International:
- Meals and soups in the USA (November 2024)
- Mintel Global New Products Database, 2024
Sector Trends Analysis – Ready meals and soups in the United States
Global Analysis Report
Prepared by: Kris Clipsham, Market Analyst
© His Majesty the King in Right of Canada, represented by the Minister of Agriculture and Agri-Food (2025).
Photo credits
All photographs reproduced in this publication are used by permission of the rights holders.
All images, unless otherwise noted, are copyright His Majesty the King in Right of Canada.
To join our distribution list or to suggest additional report topics or markets, please contact:
Agriculture and Agri-Food Canada, Global Analysis1341 Baseline Rd, Tower 5, 3rd floor
Ottawa ON K1A 0C5
Canada
Email: aafc.mas-sam.aac@agr.gc.ca
The Government of Canada has prepared this report based on primary and secondary sources of information. Although every effort has been made to ensure that the information is accurate, Agriculture and Agri-Food Canada (AAFC) assumes no liability for any actions taken based on the information contained herein.
Reproduction or redistribution of this document, in whole or in part, must include acknowledgement of agriculture and agri-food Canada as the owner of the copyright in the document, through a reference citing AAFC, the title of the document and the year. Where the reproduction or redistribution includes data from this document, it must also include an acknowledgement of the specific data source(s), as noted in this document.
Agriculture and Agri-Food Canada provides this document and other report services to agriculture and food industry clients free of charge.