

Note: This report includes forecasting data that is based on baseline historical data.
Executive summary
The Singaporean economy has demonstrated its resilience in the face of COVID-19 related challenges, recovering from a 5.4% gross domestic product (GDP) contraction in 2020 to a 7.2% growth in 2021, primarily due to decisive government actions. The pandemic has underscored the need for Singapore to continue diversifying its economy and enhancing its resistance to external shocks.
The snack market in Singapore exhibits consistent growth across all categories. The Ice Cream category shows the most significant growth rate, followed by Sweet Biscuits, Snack Bars, and Fruit Snacks. The Confectionery and Savoury Snacks categories are expected to experience moderate growth rates in the coming years.
Singapore's snack imports have been increasing, with a compound annual growth rate (CAGR) of 1.62% from 2018 to 2022. The "bread, pastry, cakes, biscuits, and other bakers' wares" category demonstrates the largest growth (CAGR of 6.50%), while the "rusks, toasted bread, and similar toasted products" category exhibits the fastest growth (CAGR of 11.85%). Malaysia is the largest snack import partner, with China showing the most rapid growth in this sector.
Although some countries have lost market share in Singapore's snack import market, such as the United States and Indonesia, others like Japan and the United Kingdom have experienced growth. Canada, ranking 30th in exports to Singapore, has lost 35% of its market share since 2018. The expanding snack market in Singapore presents potential opportunities for product innovation and new market entrants in the coming years.
Offline retail channels still dominate the market, accounting for 92.1% of total sales in 2022. However, e-commerce has experienced remarkable growth, increasing its share from 1.9% in 2018 to 7.8% in 2022. This shift indicates a growing preference for online shopping, presenting an opportunity for snack businesses to strengthen their online presence.
Market overview
The Singaporean economy, known for its robustness and diverse industry sectors, has faced significant challenges due to the COVID-19 pandemic in recent years. The country's reliance on international trade and tourism made it particularly vulnerable to the global economic downturn and travel restrictions imposed to contain the virus (World Bank, 2021). Consequently, Singapore experienced a severe recession in 2020, with GDP contracting by 5.4%, the worst decline since its independence (Ministry of Trade and Industry Singapore, 2021).
However, thanks to the government's swift and decisive actions, including implementing stringent public health measures and providing substantial fiscal support to businesses and households, Singapore managed to contain the outbreak and partially recover in 2021, with GDP growth of 7.2% (Ministry of Trade and Industry Singapore, 2021). Moving forward, as the global economy continues to recover and vaccination rates increase, Singapore is expected to experience more moderate growth in the coming years. Nevertheless, the pandemic has highlighted the need for the nation to continue diversifying its economy and enhancing its resilience to external shocks.
the snack market in Singapore is experiencing consistent growth across all categories, with the ice cream category showing the most significant growth rate. The Snacks and savoury snacks categories are expected to maintain a steady growth trajectory, while the Confectionery category is anticipated to experience a more moderate growth rate throughout both periods. This data suggests a strong and expanding snack market in Singapore, with the potential for new opportunities and product innovation in the coming years.
During the 2017-2022 period, the Snacks category saw a Compound Annual Growth Rate (CAGR) of 4.2%, growing from a market value of US$660.7 million to US$812..5 million. The ice cream category experienced the highest CAGR of 6% during the same period, with its market value increasing from US88.6 million to US118.5 million. Looking ahead to the 2023-2027 period, the ice cream category is projected to have the highest CAGR at 7.9%, with the market value anticipated to grow to 173.7. The Sweet Biscuits, Snack Bars, and Fruit Snacks category also exhibited strong growth, with a CAGR of 4.5% market value growth from US146 million to US181.6 million.
| Category | 2017 | 2022 | CAGR* % 2017-2022 | 2023 | 2027 | CAGR* % 2022-2027 |
|---|---|---|---|---|---|---|
| Snacks | 660.7 | 812.5 | 4.2 | 846.3 | 990.9 | 4.0 |
| Confectionery | 247.8 | 294.5 | 3.5 | 304.0 | 336.7 | 2.7 |
| Ice cream | 88.6 | 118.5 | 6.0 | 126.3 | 173.7 | 7.9 |
| Savoury snacks | 178.3 | 217.9 | 4.1 | 228.5 | 270.2 | 4.4 |
| Sweet biscuits, snack bars and fruit snacks | 146.0 | 181.6 | 4.5 | 187.4 | 210.4 | 3.0 |
|
Source: Euromonitor International, 2023 *CAGR: Compound annual growth rate Historic data: 2017 to 2022 Forecast data: 2023 to 2027 |
||||||
Trade
Snack Foods
Singapore has experienced an increase in snack imports over the years, with a total snack import value of 507.2 million in 2022, which represents a Compound Annual Growth Rate (CAGR) of 1.62% from 2018. The largest sector within the snack imports is the "bread, pastry, cakes, biscuits and other bakers' wares" category (HS Code 190590) which amounted to 244.7 million in 2022, with an impressive CAGR of 6.50%. Meanwhile, the most rapidly growing sector is the "rusks, toasted bread and similar toasted products" category (HS Code 190540) that has shown an exceptional growth, with a CAGR of 11.85%. Although starting from a smaller base, this sector has expanded from a value of 2.3 million in 2018 to 3.6 million in 2022, highlighting the increasing demand for these types of snacks in Singapore.
| HS Code | Description | 2018 | 2019 | 2020 | 2021 | 2022 | CAGR % 2018-2022 |
|---|---|---|---|---|---|---|---|
| Snack Foods | 475.7 | 416.7 | 430.6 | 486.0 | 507.2 | 1.6 | |
| 190590 | bread, pastry, cakes, biscuits and other bakers' wares | 190.2 | 194.1 | 199.9 | 232.0 | 244.7 | 6.5 |
| 190531 | sweet biscuits | 81.5 | 77.0 | 76.6 | 84.0 | 87.4 | 1.8 |
| 200520 | potatoes, prepared or preserved otherwise than by vinegar or acetic acid | 36.6 | 40.6 | 49.8 | 52.1 | 54.6 | 10.5 |
| 200819 | nuts and other seeds, including mixtures, prepared or preserved | 103.3 | 43.6 | 40.8 | 47.9 | 46.1 | −18.3 |
| 190532 | waffles and wafers | 29.9 | 29.5 | 27.7 | 30.1 | 39.3 | 7.1 |
| 200811 | groundnuts, prepared or preserved | 19.0 | 18.6 | 20.3 | 20.0 | 19.4 | 0.5 |
| 200600 | vegetables, fruit, nuts, fruit-peel and other edible parts of plants, preserved by sugar "drained, glacé or crystallised" | 10.6 | 9.4 | 8.8 | 9.8 | 8.7 | −4.8 |
| 190540 | rusks, toasted bread and similar toasted products | 2.3 | 1.9 | 2.2 | 2.7 | 3.6 | 11.9 |
| 081350 | mixtures of nuts or dried fruits | 1.4 | 1.1 | 1.0 | 1.5 | 1.9 | 7.9 |
| 190510 | crispbread | 0.6 | 0.6 | 3.2 | 5.6 | 1.1 | 16.3 |
| 190520 | gingerbread and the like, whether or not containing cocoa | 0.3 | 0.3 | 0.3 | 0.3 | 0.4 | 7.5 |
|
Source: Global Trade Tracker, 2023 *CAGR: Compound annual growth rate |
|||||||
Malaysia remains the largest snack import partner, with imports growing at a CAGR of 5.21% from 168.3 million in 2018 to 206.2 million in 2022. The most rapidly growing import partner is China, with a CAGR of 12.90% and imports increasing from 32.5 million in 2018 to 52.8 million in 2022.
Other significant partners include Japan, the United States, the United Kingdom, and Australia, with Japan and the UK experiencing growth rates of 7.53% and 8.07% respectively. However, some countries have lost market share in Singapore's snack import market, such as the United States, which saw a decline of 5.07% in its CAGR, and Indonesia, which experienced a significant drop of 29.77%. Thailand's market share remained relatively stable, with a slight decrease of 0.16% in its CAGR.
Canada is the 30th biggest exporter to Singapore with total export of 900 thousands dollars, the data shows that Canada has lost about 35% of it's market share since 2018.
| Category | 2018 | 2019 | 2020 | 2021 | 2022 | CAGR* % 2018-2022 |
|---|---|---|---|---|---|---|
| World | 475.8 | 416.3 | 430.5 | 485.5 | 506.7 | 1.59 |
| Malaysia | 168.3 | 168.0 | 176.1 | 195.3 | 206.2 | 5.21 |
| China (People's Republic of) | 32.5 | 32.2 | 34.1 | 46.1 | 52.8 | 12.90 |
| Japan | 29.4 | 31.1 | 30.4 | 40.5 | 39.3 | 7.53 |
| United States | 41.5 | 44.8 | 46.2 | 41.8 | 33.7 | −5.07 |
| United Kingdom | 16.2 | 17.2 | 18.3 | 21.0 | 22.1 | 8.07 |
| Indonesia | 74.4 | 15.1 | 16.3 | 18.0 | 18.1 | −29.77 |
| Thailand | 15.8 | 15.1 | 13.0 | 15.8 | 15.7 | −0.16 |
| Italy | 5.7 | 6.1 | 7.2 | 8.9 | 12.5 | 21.69 |
| Australia | 8.1 | 8.5 | 10.0 | 10.6 | 12.1 | 10.55 |
| India | 10.6 | 9.9 | 11.2 | 11.5 | 11.1 | 1.16 |
| Canada (30th) | 1.4 | 1.0 | 1.2 | 1.2 | 0.9 | −10.46 |
| Source: Global Trade Tracker, 2023 | ||||||
Ice cream
According to the Global Trade Tracker's data for 2022, Singapore's ice cream imports from the world were valued at US $63.8 million, representing a compound annual growth rate (CAGR) of 10.5% from 2018 to 2022. The two main HS codes for ice cream imports were 6520AT and 210500, both of which showed the same values for 2018 to 2022.
Looking at the top 10 ice cream imports by country, France was the largest supplier to Singapore in 2022, with imports worth US $16.5 million. This was a significant increase from the previous year and represented a CAGR of 34.8% from 2018 to 2022. Thailand and Malaysia were the second and third largest suppliers, respectively, with imports worth US $9.8 million and US $11.8 million.
Overall, Singapore's ice cream imports from the world showed steady growth, with France, Thailand, and Malaysia being the main suppliers. It will be interesting to see how these trends continue in the coming years.
| HS Code | Description | 2018 | 2019 | 2020 | 2021 | 2022 | CAGR* % 2018-2022 |
|---|---|---|---|---|---|---|---|
| 210500 | ice cream and other edible ice, whether or not containing cocoa | 42.8 | 43.6 | 51.4 | 61.7 | 63.8 | 10.50 |
|
Source: Global Trade Tracker, 2023 *CAGR: Compound annual growth rate |
|||||||
| Category | 2018 | 2019 | 2020 | 2021 | 2022 | CAGR* % 2018-2022 |
|---|---|---|---|---|---|---|
| World | 42.9 | 43.5 | 51.5 | 61.6 | 63.7 | 10.4 |
| France | 5.0 | 4.8 | 5.9 | 11.1 | 16.5 | 34.8 |
| Thailand | 7.2 | 8.2 | 7.6 | 9.9 | 9.8 | 8.0 |
| Malaysia | 12.0 | 11.9 | 11.6 | 12.6 | 11.8 | −0.4 |
| Japan | 4.7 | 4.5 | 4.0 | 5.6 | 6.0 | 6.3 |
| United States | 3.2 | 3.3 | 6.2 | 5.8 | 4.7 | 10.1 |
| Italy | 0.3 | 0.2 | 0.6 | 1.0 | 1.0 | 35.1 |
| Germany | 1.8 | 1.7 | 1.9 | 0.7 | 0.7 | −21.0 |
| Australia | 1.5 | 1.5 | 2.0 | 1.6 | 1.0 | −9.6 |
| China (People's Republic of) | 0.1 | 0.1 | 0.1 | 0.6 | 0.8 | 68.2 |
| Taiwan | 1.0 | 1.3 | 3.3 | 1.7 | 1.4 | 8.8 |
| Source: Global Trade Tracker, 2023 | ||||||
Chocolate and confectionery
Singapore's top 10 chocolate and confectionery imports from the world in 2022 were valued at US $452.3 million. The top three items in the list were chocolate and other preparations containing cocoa, in containers or immediate packings, which had a value of US $116.4 million, followed by chocolate and other preparations containing cocoa, in blocks, slabs or bars, which had a value of US $82.8 million, and sugar confectionery not containing cocoa, including white chocolate (excluding chewing gum), which had a value of US $64.9 million.
| HS Code | Description | 2018 | 2019 | 2020 | 2021 | 2022 | *CAGR % 2018-2022 |
|---|---|---|---|---|---|---|---|
| Chocolate and Confectionery | 416.2 | 445.9 | 351.5 | 382.0 | 452.3 | 2.10 | |
| 180690 | chocolate and other preparations containing cocoa, in containers or immediate packings | 84.8 | 95.0 | 88.0 | 81.8 | 116.4 | 8.24 |
| 180631 | chocolate and other preparations containing cocoa, in blocks, slabs or bars | 99.1 | 89.8 | 52.3 | 65.0 | 82.8 | −4.39 |
| 170490 | sugar confectionery not containing cocoa, | 65.0 | 65.2 | 51.2 | 55.7 | 64.9 | −0.04 |
| 180310 | cocoa paste (excluding defatted) | 39.9 | 56.1 | 49.7 | 53.3 | 48.2 | 4.84 |
| 180320 | cocoa paste, wholly or partly defatted | 21.3 | 19.9 | 11.0 | 16.7 | 32.6 | 11.23 |
| 180632 | chocolate and other preparations containing cocoa,in blocks, slabs or bars | 46.1 | 45.1 | 21.6 | 26.0 | 26.6 | −12.84 |
| 180400 | cocoa butter, fat and oil | 16.8 | 30.6 | 41.6 | 37.7 | 38.8 | 23.28 |
| 180500 | cocoa powder, not containing added sugar or other sweetening matter | 20.0 | 20.0 | 18.2 | 32.4 | 25.9 | 6.68 |
| 180620 | chocolate and other food preparations containing cocoa, in blocks, slabs or bars weighing > 2 kg | 17.4 | 14.6 | 10.3 | 8.5 | 10.7 | −11.45 |
| 180610 | cocoa powder, sweetened | 4.2 | 4.5 | 3.6 | 3.1 | 3.4 | −5.15 |
| 170410 | chewing gum, whether or not sugar-coated | 1.6 | 5.1 | 4.0 | 1.8 | 2.0 | 5.74 |
|
Source: Global Trade Tracker, 2023 *CAGR: Compound annual growth rate |
|||||||
Looking at the top 10 chocolate and confectionery imports by country, France was the largest supplier to Singapore in 2022, with imports worth US $16.5 million, followed by Thailand and Malaysia, with imports worth US $9.8 million and US $11.8 million, respectively. The United States and Japan also contributed to Singapore's imports, with imports worth US $4.7 million and US $6.0 million, respectively.
| Category | 2018 | 2019 | 2020 | 2021 | 2022 | CAGR* % 2018-2022 |
|---|---|---|---|---|---|---|
| World | 42.9 | 43.5 | 51.5 | 61.6 | 63.7 | 10.4 |
| France | 5.0 | 4.8 | 5.9 | 11.1 | 16.5 | 34.8 |
| Thailand | 7.2 | 8.2 | 7.6 | 9.9 | 9.8 | 8.0 |
| Malaysia | 12.0 | 11.9 | 11.6 | 12.6 | 11.8 | −0.4 |
| Japan | 4.7 | 4.5 | 4.0 | 5.6 | 6.0 | 6.3 |
| United States | 3.2 | 3.3 | 6.2 | 5.8 | 4.7 | 10.1 |
| Italy | 0.3 | 0.2 | 0.6 | 1.0 | 1.0 | 35.1 |
| Germany | 1.8 | 1.7 | 1.9 | 0.7 | 0.7 | −21.0 |
| Australia | 1.5 | 1.5 | 2.0 | 1.6 | 1.0 | −9.6 |
| China (People's Republic of) | 0.1 | 0.1 | 0.1 | 0.6 | 0.8 | 68.2 |
| Taiwan | 1.0 | 1.3 | 3.3 | 1.7 | 1.4 | 8.8 |
|
Source: Global Trade Tracker, 2023 *CAGR: Compound annual growth rate |
||||||
Confectionery
The retail value sales of different categories of chocolate confectionery indicates that the overall Chocolate Confectionery category has grown at a rate of 2.7% over the five-year period stable, Showing that demand for chocolate products remains steady. The fastest growing categories are Countlines and chocolate tablets, with growth rates of 5.4% and 3.6%.
The cost of producing chocolate confectionery is expected to increase due to raw material price surges, supply shortages, and rising energy costs. This will likely result in a significant spike in the average unit price for chocolate products in Singapore in 2022. Boxed assortments are leading the value growth in the chocolate category due to the increasing demand for artisanal chocolate. Consumers are willing to pay more for higher-quality offerings that are personalized and have a sustainable supply chain. Artisanal boxed assortments are expected to continue to drive the category's growth in retail value terms, although the increments will remain modest due to the niche nature of artisanal chocolate. (Euromonitor International, 2023)
The sugar confectionery industry has seen a steady growth of 1.5% from 2017 to 2022, with a total value of 134.5 million dollars in 2022. Among the subcategories, medicated confectionery has seen the highest growth rate of 3.3%, followed by pastilles, gummies, jellies, and chews at 2.1%. However, boiled sweets and other sugar confectionery have seen a decline of 2% and 2.3%, respectively. These numbers indicate the evolving consumer preferences in Singapore and the need for sugar confectionery manufacturers to adapt to changing market demands.
As COVID-19 movement restrictions are lifted and consumers become more mobile, the demand for throat soothers and breath fresheners is likely to increase. Consumers will be exposed to more irritants in the environment and more susceptible to throat irritation due to increased socialization and speaking. Oral freshening will also become more important for social presentability and to combat the effects of mask-wearing. Sugar confectionery is expected to see rising production and distribution costs. (Euromonitor International, 2023)
| Category | 2017 | 2018 | 2019 | 2020 | 2021 | 2022 |
|---|---|---|---|---|---|---|
| Confectionery | 257.2 | 265.5 | 273.9 | 277.2 | 285.0 | 294.5 |
| Chocolate Confectionery | 131.8 | 137.6 | 143.6 | 147.6 | 153.5 | 160.0 |
| Chocolate Pouches and Bags | 20.8 | 21.5 | 22.2 | 22.7 | 23.1 | 23.9 |
| Boxed Assortments | 46.6 | 48.7 | 51.1 | 48.5 | 52.3 | 55.4 |
| Chocolate with Toys | 2.0 | 2.0 | 2.0 | 2.2 | 2.2 | 2.3 |
| Countlines | 34.9 | 36.8 | 38.6 | 42.5 | 43.8 | 45.5 |
| Tablets | 27.6 | 28.7 | 29.6 | 31.7 | 32.1 | 32.9 |
| Sugar Confectionery | 124.9 | 127.4 | 130.3 | 129.6 | 131.6 | 134.5 |
| Boiled Sweets | 14.5 | 14.5 | 14.5 | 13.6 | 13.3 | 13.1 |
| Lollipops | 1.9 | 1.9 | 1.9 | 1.8 | 1.7 | 1.6 |
| Medicated Confectionery | 37.6 | 38.2 | 39.2 | 42.6 | 43.0 | 44.3 |
| Mints | 36.4 | 37.5 | 38.5 | 36.0 | 37.7 | 38.9 |
| Pastilles, Gummies, Jellies and Chews | 26.2 | 27.1 | 28.0 | 27.9 | 28.3 | 29.0 |
| Toffees, Caramels and Nougat | 4.6 | 4.6 | 4.6 | 4.4 | 4.4 | 4.3 |
| Other Sugar Confectionery | 3.6 | 3.6 | 3.5 | 3.4 | 3.3 | 3.2 |
| Source: Euromonitor International, 2023 | ||||||
| Category | Annual growth (%) 2021-2022 | CAGR* % 2017-2022 | Total growth (%) 2017-2022 |
|---|---|---|---|
| Confectionery | 3.3 | 2.7 | 14.5 |
| Chocolate Confectionery | 4.2 | 4.0 | 21.4 |
| Chocolate Pouches and Bags | 3.5 | 2.8 | 14.9 |
| Boxed Assortments | 5.9 | 3.5 | 18.9 |
| Chocolate with Toys | 4.5 | 2.8 | 15.0 |
| Countlines | 3.9 | 5.4 | 30.4 |
| Tablets | 2.5 | 3.6 | 19.2 |
| Sugar Confectionery | 2.2 | 1.5 | 7.7 |
| Boiled Sweets | −1.5 | −2.0 | −9.7 |
| Lollipops | −5.9 | −3.4 | −15.8 |
| Medicated Confectionery | 3.0 | 3.3 | 17.8 |
| Mints | 3.2 | 1.3 | 6.9 |
| Pastilles, Gummies, Jellies and Chews | 2.5 | 2.1 | 10.7 |
| Toffees, Caramels and Nougat | −2.3 | −1.3 | −6.5 |
| Other Sugar Confectionery | −3.0 | −2.3 | −11.1 |
| *CAGR: Compound annual growth rate | |||
The retail value sales of confectionery subcategories are expected to continue growing steadily over the next five years, as shown by Euromonitor International's Forecast retail sales in US$ millions. The overall confectionery category is expected to increase at a compound annual growth rate (CAGR) of 2.7% from 2022 to 2027, with a total growth of 14.3%. Within the chocolate confectionery subcategory, boxed assortments are predicted to have the highest CAGR of 4.3% and a total growth of 23.6%. Meanwhile, the sugar confectionery subcategory is expected to have a CAGR of 1.8% and a total growth of 9.4%. However, lollipops and boiled sweets are expected to decline, with negative CAGRs of 2.6% and 0.9%, respectively, over the forecast period. These trends suggest a shift in consumer preferences, indicating the need for manufacturers to adapt to changing market demands to remain competitive in the confectionery industry.
Consumer health awareness is expected to negatively impact the sales of multiple categories of sugar confectionery in both retail value and volume terms, throughout 2022 and beyond. While retail current value growth is expected in some categories in 2022, pastilles, gummies, jellies, and chews are the only indulgent category predicted to have a positive outlook. This is due to the unique chewing experience this category provides, which is not offered by other types of sugar confectionery or snacks. Although pastilles and gummies, jellies, and chews differ in popularity, with the latter experiencing growth and the former declining, the demand for gummies, jellies, and chews is sustained across all age groups, especially the younger generation. The flexible mouthfeel of these products enables players to adjust their ingredients, reduce sugar content, and cater to different diets, while still providing consumers with a light and chewy consumption experience. One industry player that has successfully leveraged this trend is The Natural Confectionery Company, offering kombucha-flavored jellies filled with prebiotic fiber from kombucha extract and 25% less sugar. Additionally, the brand has introduced vegan-friendly products to cater to consumers following this type of diet.
| Category | 2023 | 2024 | 2025 | 2026 | 2027 |
|---|---|---|---|---|---|
| Confectionery | 304.0 | 312.5 | 320.6 | 328.5 | 336.7 |
| Chocolate Confectionery | 166.5 | 172.4 | 178.0 | 183.7 | 189.5 |
| Chocolate Pouches and Bags | 24.8 | 25.6 | 26.5 | 27.3 | 28.2 |
| Boxed Assortments | 58.4 | 61.1 | 63.6 | 66.0 | 68.5 |
| Chocolate with Toys | 2.3 | 2.4 | 2.5 | 2.5 | 2.6 |
| Countlines | 47.2 | 48.6 | 50.1 | 51.6 | 53.2 |
| Tablets | 33.8 | 34.6 | 35.4 | 36.2 | 37.0 |
| Sugar Confectionery | 137.6 | 140.1 | 142.5 | 144.8 | 147.2 |
| Boiled Sweets | 13.1 | 12.9 | 12.8 | 12.6 | 12.5 |
| Lollipops | 1.6 | 1.5 | 1.5 | 1.5 | 1.4 |
| Medicated Confectionery | 45.8 | 47.3 | 48.7 | 50.2 | 51.7 |
| Mints | 39.9 | 40.7 | 41.3 | 41.9 | 42.5 |
| Pastilles, Gummies, Jellies and Chews | 29.8 | 30.3 | 30.9 | 31.5 | 32.1 |
| Toffees, Caramels and Nougat | 4.3 | 4.3 | 4.2 | 4.2 | 4.1 |
| Other Sugar Confectionery | 3.2 | 3.1 | 3.0 | 3.0 | 2.9 |
| Source: Euromonitor International, 2023 | |||||
| Category | Annual growth (%) 2022-2023 | CAGR* % 2022-2027 | Total growth (%) 2022-2027 |
|---|---|---|---|
| Confectionery | 2.5 | 2.7 | 14.3 |
| Chocolate Confectionery | 3.2 | 3.4 | 18.4 |
| Chocolate Pouches and Bags | 3.3 | 3.4 | 18.0 |
| Boxed Assortments | 3.8 | 4.3 | 23.6 |
| Chocolate with Toys | 4.0 | 2.5 | 13.0 |
| Countlines | 3.1 | 3.2 | 16.9 |
| Tablets | 2.2 | 2.4 | 12.5 |
| Sugar Confectionery | 1.7 | 1.8 | 9.4 |
| Boiled Sweets | −0.8 | −0.9 | −4.6 |
| Lollipops | −6.7 | −2.6 | −12.5 |
| Medicated Confectionery | 3.0 | 3.1 | 16.7 |
| Mints | 1.4 | 1.8 | 9.3 |
| Pastilles, Gummies, Jellies and Chews | 1.9 | 2.1 | 10.7 |
| Toffees, Caramels and Nougat | −2.4 | −0.9 | −4.7 |
| Other Sugar Confectionery | −3.3 | −1.9 | −9.4 |
| *CAGR: Compound annual growth rate | |||
Ice cream
The ice cream industry in Singapore has experienced steady growth over the past five years, with a compound annual growth rate (CAGR) of 5.2% from 2017 to 2022. In 2017, total ice cream sales were recorded at 91.9 million dollars, which increased to 118.5 million dollars in 2022. Take-home ice cream remains the largest subcategory, accounting for more than two-thirds of the total sales. The sales of take-home ice cream have increased from 66.4 million dollars in 2017 to 86.4 million dollars in 2022. The impulse ice cream subcategory had a slight decrease in sales from 2017 to 2018 but bounced back in 2021 and 2022. Plant-based ice cream has grown exponentially over the years, recording a CAGR of 122.9% from 2017 to 2022, with sales increasing from 0.1 million dollars in 2017 to 5.5 million dollars in 2022.
| Category | 2017 | 2018 | 2019 | 2020 | 2021 | 2022 |
|---|---|---|---|---|---|---|
| Ice cream | 91.9 | 94.2 | 96.7 | 106.7 | 111.9 | 118.5 |
| Impulse ice cream | 25.4 | 24.9 | 24.7 | 23.3 | 25.3 | 26.7 |
| Plant-based ice cream | 0.1 | 0.4 | 0.8 | 1.4 | 3.1 | 5.5 |
| Take-Home ice cream | 66.4 | 68.9 | 71.1 | 81.9 | 83.4 | 86.4 |
| Bulk Dairy ice cream | 33.6 | 34.5 | 35.4 | 43.5 | 44.3 | 46.3 |
| Ice cream Desserts | 0.6 | 0.6 | 0.5 | 0.6 | 0.5 | 0.5 |
| Multi-Pack Dairy ice cream | 32.2 | 33.8 | 35.2 | 37.9 | 38.6 | 39.5 |
| Source: Euromonitor International, 2023 | ||||||
| Category | Annual growth (%) 2021-2022 | CAGR* % 2017-2022 | Total growth (%) 2017-2022 |
|---|---|---|---|
| Ice cream | 5.9 | 5.2 | 28.9 |
| Impulse ice cream | 5.5 | 1.0 | 5.1 |
| Plant-based ice cream | 77.4 | 122.9 | 5400.0 |
| Take-Home ice cream | 3.6 | 5.4 | 30.1 |
| Bulk Dairy ice cream | 3.6 | 5.4 | 30.1 |
| Ice cream Desserts | 4.5 | 6.6 | 37.8 |
| Multi-Pack Dairy ice cream | 0.0 | −3.6 | −16.7 |
| *CAGR: Compound annual growth rate | |||
Overall, the forecasts indicates that the ice cream industry in Singapore is will continue growing and adapting to consumer preferences. Rapid advancements in dairy substitution are expected to fuel double-digit year-on-year growth in the current value of plant-based ice cream throughout the forecast period. This trend is expected to extend beyond the traditional use of nut and grain milks and venture into the development of allergen-free products that maintain taste and texture. Plant-based ice cream is also poised to cater to various dietary requirements such as lactose-free, gluten-free, high protein, and ketogenic diets, offering consumers an overall better-for-you option. For instance, local brand Ketoi has already introduced keto-friendly and dairy-free ice cream products. Smaller dairy ice cream brands such as The ice cream & Cookie Co are expected to capitalize on their production agility and launch new plant-based varieties at a one-to-one ratio with their dairy counterparts. This strategic move will help them establish their brand in this relatively new category more quickly, as compared to larger incumbent global brands. (Euromonitor International, 2023)
| Category | 2023 | 2024 | 2025 | 2026 | 2027 |
|---|---|---|---|---|---|
| Ice cream | 126.3 | 135.8 | 146.7 | 159.0 | 173.7 |
| Impulse ice cream | 27.6 | 28.4 | 28.9 | 29.3 | 29.7 |
| Plant-based ice cream | 8.6 | 13.6 | 20.8 | 29.5 | 40.4 |
| Take-Home ice cream | 90.1 | 93.8 | 97.1 | 100.3 | 103.6 |
| Bulk Dairy ice cream | 48.4 | 50.7 | 52.6 | 54.4 | 56.3 |
| Ice cream Desserts | 0.5 | 0.5 | 0.5 | 0.5 | 0.5 |
| Multi-Pack Dairy ice cream | 41.1 | 42.6 | 44.0 | 45.3 | 46.7 |
| Source: Euromonitor International, 2023 | |||||
| Category | Annual growth (%) 2022-2023 | CAGR* % 2022-2027 | Total growth (%) 2022-2027 |
|---|---|---|---|
| Ice cream | 7 | 8 | 47 |
| Impulse ice cream | 3 | 2 | 11 |
| Plant-based ice cream | 56 | 49 | 635 |
| Take-Home ice cream | 4 | 4 | 20 |
| Bulk Dairy ice cream | 5 | 4 | 22 |
| Ice cream Desserts | 0 | 0 | 0 |
| Multi-Pack Dairy ice cream | 4 | 3 | 18 |
| *CAGR: Compound annual growth rate | |||
Savoury snacks
According to data from Euromonitor International in 2023, the savoury snacks market in Singapore has grown steadily over the past few years, with a compound annual growth rate (CAGR) of 3.3% from 2017 to 2022. The strongest growth was seen in Salty Snacks and Savoury Biscuits, with CAGRs of 3.5% and 3.1%, respectively. Nuts, Seeds and Trail Mixes have also shown steady growth, with a CAGR of 2.7%. The Seafood Snacks category experienced a decline in sales from 2017 to 2020, with a negative CAGR of −6.1%, but rebounded strongly in 2022 with retail value sales growing by 38.9%. Although premium local brands such as Irvins Salted Egg and Golden Duck dominate this category and are primarily purchased by tourists, the rebound in tourism is expected to fuel growth in the category. Other savoury snacks saw a decline in sales with a negative CAGR of −5.3%.
| Category | 2017 | 2018 | 2019 | 2020 | 2021 | 2022 |
|---|---|---|---|---|---|---|
| Savoury snacks | 185.0 | 199.2 | 207.6 | 209.8 | 210.0 | 217.9 |
| Nuts, Seeds and Trail Mixes | 61.7 | 64.1 | 66.2 | 70.0 | 69.5 | 70.5 |
| Salty Snacks | 58.2 | 61.3 | 63.4 | 67.0 | 67.1 | 69.2 |
| Potato Chips | 30.7 | 33.5 | 35.3 | 37.4 | 38.0 | 40.1 |
| Tortilla Chips | 9.7 | 9.8 | 9.9 | 10.2 | 10.0 | 10.0 |
| Puffed Snacks | 11.8 | 11.8 | 11.8 | 12.5 | 12.4 | 12.2 |
| Rice Snacks | 4.4 | 4.5 | 4.5 | 4.6 | 4.5 | 4.4 |
| Vegetable, Pulse and Bread Chips | 1.7 | 1.8 | 1.9 | 2.2 | 2.3 | 2.4 |
| Savoury Biscuits | 50.1 | 51.3 | 52.4 | 56.4 | 56.9 | 58.3 |
| Popcorn | 5.2 | 5.2 | 5.2 | 5.6 | 5.6 | 5.9 |
| Meat Snacks | 0.2 | 0.2 | 0.2 | 0.2 | 0.2 | 0.2 |
| Seafood Snacks | 5.4 | 13.1 | 16.3 | 7.6 | 7.5 | 10.5 |
| Other savoury snacks | 4.2 | 4.0 | 3.8 | 3.1 | 3.2 | 3.3 |
| Source: Euromonitor International, 2023 | ||||||
| Category | Annual growth (%) 2021-2022 | CAGR* % 2017-2022 | Total growth (%) 2017-2022 |
|---|---|---|---|
| Savoury snacks | 3.8 | 3.3 | 17.8 |
| Nuts, Seeds and Trail Mixes | 1.4 | 2.7 | 14.3 |
| Salty Snacks | 3.1 | 3.5 | 18.9 |
| Potato Chips | 5.5 | 5.5 | 30.6 |
| Tortilla Chips | 0.0 | 0.6 | 3.1 |
| Puffed Snacks | −1.6 | 0.7 | 3.4 |
| Rice Snacks | −2.2 | 0.0 | 0.0 |
| Vegetable, Pulse and Bread Chips | 4.3 | 7.1 | 41.2 |
| Savoury Biscuits | 2.5 | 3.1 | 16.4 |
| Popcorn | 0.0 | 1.5 | 7.7 |
| Meat Snacks | 0.0 | 0.0 | 0.0 |
| Seafood Snacks | −1.3 | 6.8 | 38.9 |
| Other savoury snacks | 3.2 | −5.3 | −23.8 |
| *CAGR: Compound Annual Growth Rate | |||
The seafood snacks double-digit current value growth expected in 2022 is expected to continue, and growth rates will exceed those seen in 2019 until 2024, as tourism-reliant brands are anticipated to double-down on promotion and upselling to compensate for the steep decline seen during the pandemic in 2020 and 2021. Growth from 2025 until the end of the forecast period is expected to be more modest, but still in the double-digit range, as restored category prominence will then be leveraged for product innovation.
In addition to the increasing demand for premium seafood snacks, there is also an anticipated growth in the traditional seafood snack market. This growth is expected to be most significant in 2022 and will stabilize for the remainder of the projected period. As group consumption occasions such as watching sports resume, seafood snacks can be shared to complement alcoholic beverages. (Euromonitor International, 2023)
| Category | 2023 | 2024 | 2025 | 2026 | 2027 |
|---|---|---|---|---|---|
| Savoury snacks | 228.5 | 239.9 | 250.4 | 260.5 | 270.2 |
| Nuts, Seeds and Trail Mixes | 72.0 | 73.7 | 75.2 | 76.6 | 78.1 |
| Salty Snacks | 71.8 | 74.4 | 77.0 | 79.5 | 82.0 |
| Potato Chips | 42.4 | 44.7 | 47.0 | 49.2 | 51.5 |
| Tortilla Chips | 10.1 | 10.1 | 10.2 | 10.3 | 10.3 |
| Puffed Snacks | 12.3 | 12.4 | 12.4 | 12.4 | 12.4 |
| Rice Snacks | 4.4 | 4.4 | 4.4 | 4.5 | 4.5 |
| Vegetable, Pulse and Bread Chips | 2.6 | 2.8 | 3.0 | 3.2 | 3.4 |
| Savoury Biscuits | 60.2 | 62.1 | 63.9 | 65.8 | 67.6 |
| Popcorn | 6.2 | 6.5 | 6.9 | 7.2 | 7.5 |
| Meat Snacks | 0.2 | 0.2 | 0.2 | 0.3 | 0.3 |
| Seafood Snacks | 14.4 | 19.1 | 23.2 | 27.1 | 30.3 |
| Other savoury snacks | 3.6 | 3.8 | 4.0 | 4.1 | 4.3 |
| Source: Euromonitor International, 2023 | |||||
| Category | Annual growth (%) 2022-2023 | CAGR* % 2022-2027 | Total growth (%) 2022-2027 |
|---|---|---|---|
| Savoury snacks | 4.9 | 4.4 | 24.0 |
| Nuts, Seeds and Trail Mixes | 2.1 | 2.1 | 10.8 |
| Salty Snacks | 3.8 | 3.5 | 18.5 |
| Potato Chips | 5.7 | 5.1 | 28.4 |
| Tortilla Chips | 1.0 | 0.6 | 3.0 |
| Puffed Snacks | 0.8 | 0.3 | 1.6 |
| Rice Snacks | 0.0 | 0.5 | 2.3 |
| Vegetable, Pulse and Bread Chips | 8.3 | 7.2 | 41.7 |
| Savoury Biscuits | 3.3 | 3.0 | 16.0 |
| Popcorn | 5.1 | 4.9 | 27.1 |
| Meat Snacks | 0.0 | 8.4 | 50.0 |
| Seafood Snacks | 37.1 | 23.6 | 188.6 |
| Other savoury snacks | 9.1 | 5.4 | 30.3 |
| *CAGR: Compound annual growth rate | |||
Sweet biscuits, snack bars and fruit snacks
Production costs for sweet biscuits, snack bars, and fruit snacks are expected to increase due to the energy required to offer shelf stability. Sweet biscuits are expected to have the highest unit price growth, followed by fruit snacks, while snack bars are expected to have the lowest growth. Multipacks and smaller pack sizes will contribute to the unit price growth in sweet biscuits. Fruit snacks typically come in one pack size, while snack bars are being purchased in bulk, which is driving the economies of scale. However, as inflation rises, consumers are expected to purchase in higher volumes for home storage, which will lead to slower unit price growth over the forecast period.
Plain biscuits and cookies are expected to experience a decline in retail value and volume growth compared to chocolate coated biscuits, filled biscuits, and wafers. This is due to their maturity and lack of variety. Despite this, plain biscuits, particularly cream crackers, remain a staple food in Singapore. They are commonly consumed as a breakfast item and are often served with citrus fruits or coconut jam, or dipped in hot beverages such as coffee, tea, milk, or malt drinks. (Euromonitor International, 2023)
| Category | 2017 | 2018 | 2019 | 2020 | 2021 | 2022 |
|---|---|---|---|---|---|---|
| Sweet biscuits, snack bars and fruit snacks | 151.5 | 154.6 | 157.8 | 174.3 | 176.6 | 181.6 |
| Fruit Snacks (dried fruit) | 5.7 | 5.9 | 6.0 | 6.3 | 6.5 | 6.7 |
| Snack Bars | 13.3 | 13.7 | 14.0 | 15.3 | 15.5 | 15.9 |
| Cereal Bars | 9.8 | 10.2 | 10.4 | 11.5 | 11.5 | 11.8 |
| Protein/Energy Bars | 3.4 | 3.5 | 3.6 | 3.9 | 4.0 | 4.1 |
| Sweet Biscuits | 132.5 | 135.1 | 137.7 | 152.7 | 154.6 | 159.0 |
| Chocolate Coated Biscuits | 25.7 | 26.5 | 27.4 | 30.6 | 31.2 | 32.2 |
| Cookies | 20.3 | 20.6 | 21.0 | 22.8 | 22.7 | 23.1 |
| Filled Biscuits | 45.0 | 45.8 | 46.4 | 51.7 | 52.7 | 54.5 |
| Plain Biscuits | 36.1 | 36.6 | 37.2 | 41.1 | 41.4 | 42.2 |
| Wafers | 5.3 | 5.5 | 5.7 | 6.5 | 6.6 | 7.0 |
|
Source: Euromonitor International, 2023 *CAGR: Compound annual growth rate |
||||||
| Category | Annual growth (%) 2021-2022 | CAGR* % 2017-2022 | Total growth (%) 2017-2022 |
|---|---|---|---|
| Sweet biscuits, snack bars and fruit snacks | 2.8 | 3.7 | 19.9 |
| Fruit Snacks (dried fruit) | 3.1 | 3.3 | 17.5 |
| Snack Bars | 2.6 | 3.6 | 19.5 |
| Cereal Bars | 2.6 | 3.8 | 20.4 |
| Protein/Energy Bars | 2.5 | 3.8 | 20.6 |
| Sweet Biscuits | 2.8 | 3.7 | 20.0 |
| Chocolate Coated Biscuits | 3.2 | 4.6 | 25.3 |
| Cookies | 1.8 | 2.6 | 13.8 |
| Filled Biscuits | 3.4 | 3.9 | 21.1 |
| Plain Biscuits | 0.7 | 2.8 | 14.7 |
| Wafers | 1.5 | 4.5 | 24.5 |
| *CAGR: Compound annual growth rate | |||
According to the forecast from Euromonitor International, the Sweet Biscuits, Snack Bars, and Fruit Snacks market is expected to continue growing steadily over the next five years, with a compound annual growth rate (CAGR) of 3.0% from 2022 to 2027.
The total retail value sales for this category are projected to reach 210.4 million dollars in 2027. Within this category, Sweet Biscuits account for the largest subcategory with projected sales of 184.2 million dollars in 2027, with a CAGR of 3.0%.Fruit Snacks (dried fruit) are projected to have the highest CAGR in this category, with 3.6%, followed by Protein/Energy Bars with a CAGR of 5.3%. Overall, the growth of this category is driven by consumers' increasing demand for healthier snacking options.
| Category | 2023 | 2024 | 2025 | 2026 | 2027 |
|---|---|---|---|---|---|
| Sweet biscuits, snack bars and fruit snacks | 187.4 | 193.3 | 198.9 | 204.6 | 210.4 |
| Fruit Snacks (dried fruit) | 7.0 | 7.2 | 7.5 | 7.7 | 8.0 |
| Snack Bars | 16.4 | 16.9 | 17.3 | 17.7 | 18.2 |
| Cereal Bars | 12.1 | 12.3 | 12.5 | 12.7 | 12.9 |
| Protein/Energy Bars | 4.4 | 4.6 | 4.8 | 5.0 | 5.3 |
| Sweet Biscuits | 164.0 | 169.2 | 174.1 | 179.1 | 184.2 |
| Chocolate Coated Biscuits | 33.2 | 34.3 | 35.3 | 36.3 | 37.4 |
| Cookies | 23.5 | 23.9 | 24.3 | 24.7 | 25.1 |
| Filled Biscuits | 56.7 | 58.9 | 61.0 | 63.2 | 65.5 |
| Plain Biscuits | 43.2 | 44.0 | 44.8 | 45.6 | 46.4 |
| Wafers | 7.5 | 8.1 | 8.6 | 9.3 | 9.9 |
| Source: Euromonitor International, 2023 | |||||
| Category | Annual growth (%) 2022-2023 | CAGR* % 2022-2027 | Total growth (%) 2022-2027 |
|---|---|---|---|
| Sweet biscuits, snack bars and fruit snacks | 3.2 | 3.0 | 15.9 |
| Fruit Snacks (dried fruit) | 4.5 | 3.6 | 19.4 |
| Snack Bars | 3.1 | 2.7 | 14.5 |
| Cereal Bars | 2.5 | 1.8 | 9.3 |
| Protein/Energy Bars | 7.3 | 5.3 | 29.3 |
| Sweet Biscuits | 3.1 | 3.0 | 15.8 |
| Chocolate Coated Biscuits | 3.1 | 3.0 | 16.1 |
| Cookies | 1.7 | 1.7 | 8.7 |
| Filled Biscuits | 4.0 | 3.7 | 20.2 |
| Plain Biscuits | 2.4 | 1.9 | 10.0 |
| Wafers | 7.1 | 7.2 | 41.4 |
| *CAGR: Compound annual growth rate | |||
Retail channels
The Distribution Channels for snacks in Singapore table shows a steady growth in the retail value sales of snacks from 2017 to 2022. The total sales of all retail channels increased from US$685.6 million in 2017 to US$812.5 million in 2022, with a compound annual growth rate (CAGR) of 3.5%.
Retail offline channels, which accounted for 92.1% of total sales in 2022, experienced a 2.1% CAGR, while retail e-commerce witnessed a remarkable 44.2% CAGR from 2017 to 2022. Grocery retailers, including supermarkets, convenience stores, and small local grocers, retained the largest share of the market, ranging from 88.5% in 2022 to 92.7% in 2017. However, the market share of non-grocery retailers, such as general merchandise stores and health and beauty specialists, also grew steadily from 3.0% in 2017 to 3.5% in 2022.
The data suggests that while traditional retail channels remain dominant, the increasing popularity of e-commerce in Singapore presents significant opportunities for businesses in the snack industry.
| Outlet Type | 2017 | 2018 | 2019 | 2020 | 2021 | 2022 | Share % 2022 | CAGR* % 2017-2022 |
|---|---|---|---|---|---|---|---|---|
| All Retail Channels | 685.6 | 713.6 | 735.9 | 768.0 | 783.5 | 812.5 | 100.0 | 3.5 |
| Retail Offline | 675.4 | 700.2 | 720.6 | 713.8 | 725.0 | 748.7 | 92.1 | 2.1 |
| Grocery Retailers | 649.6 | 671.6 | 691.1 | 686.0 | 696.4 | 719.2 | 88.5 | 2.1 |
| Convenience Retail | 104.9 | 107.9 | 110.9 | 105.2 | 107.3 | 110.1 | 13.6 | 1.0 |
| Convenience Stores | 90.5 | 93.6 | 96.7 | 91.5 | 93.8 | 96.7 | 11.9 | 1.3 |
| Forecourt Retailers | 14.4 | 14.3 | 14.2 | 13.7 | 13.5 | 13.4 | 1.6 | −1.4 |
| Supermarkets | 328.8 | 336.2 | 345.8 | 364.4 | 371.0 | 384.4 | 47.3 | 3.2 |
| Hypermarkets | 63.9 | 65.2 | 67.0 | 64.5 | 65.1 | 66.6 | 8.2 | 0.8 |
| Warehouse Clubs | 1.4 | 1.8 | 1.7 | 1.5 | 1.2 | 1.1 | 0.1 | −4.7 |
| Food/drink/tobacco specialists | 43.6 | 53.1 | 57.7 | 48.2 | 50.6 | 53.6 | 6.6 | 4.2 |
| Small Local Grocers | 107.0 | 107.4 | 108.0 | 102.2 | 101.3 | 103.5 | 12.7 | −0.7 |
| Non-Grocery Retailers | 24.9 | 27.7 | 28.4 | 27.0 | 27.9 | 28.8 | 3.5 | 3.0 |
| General Merchandise Stores | 7.9 | 11.2 | 12.3 | 11.9 | 11.9 | 13.7 | 1.7 | 11.6 |
| Health and Beauty Specialists | 14.9 | 14.7 | 14.4 | 14.1 | 14.1 | 14.3 | 1.8 | −0.8 |
| Other Non-Grocery Retailers | 2.1 | 1.8 | 1.8 | 1.1 | 1.9 | 0.8 | 0.1 | −17.6 |
| Vending | 0.9 | 0.9 | 1.1 | 0.8 | 0.7 | 0.8 | 0.1 | −2.3 |
| Retail E-Commerce | 10.2 | 13.4 | 15.3 | 54.1 | 58.5 | 63.7 | 7.8 | 44.2 |
|
Source: Euromonitor International, 2023 *CAGR: Compound annual growth rate |
||||||||
Competition
Kraft Foods continues to hold the top position in the puffed snacks category and is a strong contender in the savoury biscuits, cookies, plain biscuits, and tortilla chips categories. This can be attributed to the familiarity and loyalty consumers have towards its long-standing brands, such as Twisties, Jacob's, and Chipsmore. However, Kraft Foods' other brands, except Oreo, have been stagnant in terms of new product development, which may limit its growth potential. As a result, while it may remain the leading snacks company, other companies that are more innovative may outpace its growth. (Euromonitor International, 2023)
In the fragmented snacks market, ice cream has emerged as the most prominent category, with international, regional, and local brands entering the market aggressively. The pandemic-driven boom in 2020 has led to the introduction of new product formats, flavours, and value offerings, and plant-based ice cream is expected to contribute to the positive outlook for the category. Some local and regional brands are looking to diversify their offerings by introducing plant-based options, as seen in the strategy of The ice cream & Cookie Co and Kind Kones. This trend of variety diversification through plant-based options is also observed in snack bars, with protein substitution being notable in energy bars. Nuzest and NuGo are examples of brands offering both conventional and plant-based protein bars. Smaller and more agile players are leveraging their production agility to compete with incumbent brands through innovation and novelty. (Euromonitor International, 2023)
| Category | Company name | Market share % | Actual sales 2022 | ||||
|---|---|---|---|---|---|---|---|
| 2018 | 2019 | 2020 | 2021 | 2022 | |||
| Snacks | Kraft Foods | 10.0 | 9.7 | 10.0 | 9.8 | 9.6 | 78.2 |
| Unilever Singapore | 6.2 | 6.2 | 6.4 | 6.5 | 6.5 | 52.8 | |
| Seng Hua Hng Foodstuffs | 5.6 | 5.7 | 5.8 | 5.7 | 5.6 | 45.6 | |
| Khong Guan Biscuit Factory | 4.9 | 4.8 | 5.1 | 5.0 | 5.0 | 40.6 | |
| Mars Foods Inc | 4.7 | 4.7 | 4.7 | 4.7 | 4.7 | 38.2 | |
| Confectionery | Mars Foods Inc | 12.7 | 12.8 | 12.9 | 12.9 | 13.0 | 38.2 |
| Ferrero SpA | 11.9 | 12.0 | 11.9 | 11.9 | 12.0 | 35.3 | |
| Mondelez Singapore | 8.7 | 8.6 | 8.8 | 8.7 | 8.5 | 25.0 | |
| Nestlé Singapore | 6.4 | 6.7 | 7.2 | 7.3 | 7.5 | 22.0 | |
| Ricola Asia Pacific | 4.6 | 4.6 | 4.9 | 4.8 | 4.8 | 14.2 | |
| Ice cream | Unilever Singapore | 46.8 | 47.1 | 45.9 | 45.3 | 44.5 | 52.8 |
| General Mills Asia | 19.8 | 19.9 | 21.1 | 20.1 | 19.7 | 23.3 | |
| F&N Foods (S) | 11.2 | 10.9 | 10.4 | 10.0 | 9.7 | 11.5 | |
| Nestlé Singapore | 10.9 | 10.7 | 10.1 | 9.7 | 9.3 | 11.1 | |
| Ice cream & Cookie Co | 1.0 | 1.3 | 2.5 | 3.7 | 4.6 | 5.5 | |
| Savoury snacks | Seng Hua Hng Foodstuffs | 20.2 | 20.2 | 21.2 | 21.3 | 20.9 | 45.6 |
| Kraft Foods | 15.1 | 14.8 | 15.6 | 15.6 | 15.2 | 33.2 | |
| PepsiCo International | 7.1 | 7.0 | 7.7 | 7.7 | 7.7 | 16.8 | |
| Tong Garden Food Products | 5.7 | 5.5 | 5.8 | 5.6 | 5.5 | 12.0 | |
| Kellogg Asia | 4.2 | 4.0 | 5.0 | 5.0 | 5.1 | 11.1 | |
| Sweet biscuits, snack bars and fruit snacks | Kraft Foods | 22.4 | 21.6 | 21.5 | 21.3 | 21.2 | 38.4 |
| Khong Guan Biscuit Factory | 20.1 | 20.1 | 20.2 | 20.2 | 20.2 | 36.7 | |
| Glico Dairy Products Co Ltd | 4.7 | 4.8 | 4.9 | 4.9 | 4.9 | 9.0 | |
| Arnott's Biscuits Ltd | 4.7 | 4.7 | 4.7 | 4.7 | 8.6 | ||
| United Biscuits (Holdings) Plc | 4.1 | 4.0 | 4.0 | 3.9 | 3.9 | 7.0 | |
| Source: Euromonitor International, 2023 | |||||||
| Company name | Brand name |
|---|---|
| Khong Guan Biscuit Factory (S) Pte Ltd | Khong Guan |
| Kraft Foods (S) Pte Ltd | Oreo, Jacob's, Twisties, Chipsmore, Ritz, Chips Ahoy! , Tiger, Kraft Assortments, Halls, Chacho's, Clorets, Planters |
| Mars Foods Inc | Eclipse, M&M's, Snickers, Mars, Dove, Maltesers, Orbit |
| Seng Hua Hng Foodstuffs Pte Ltd | Camel (Seng Hua Hng Foodstuffs Pte Ltd) |
| Unilever Singapore Pte Ltd | Magnum, Ben & Jerry's, Cornetto, Wall's |
| Source: Euromonitor International, 2023 | |
New launches
A total of 2,662 new products were introduced in these categories during the 2018-2022 period. The Snacks category dominated the market with 1,710 new products, while Chocolate Confectionery and Sugar & Gum Confectionery had 686 and 266 new products, respectively.
The top claims made by the new products were mainly focused on health and social media aspects. Social Media was the most common claim with 718 instances, followed by No Additives/Preservatives (653), and Halal certification (590). Other popular claims included Low/No/Reduced Allergen, Gluten Free, and Free from Added/Artificial Preservatives, which suggests that consumers are becoming more health-conscious and demanding cleaner, safer ingredients. Regarding flavors, Unflavoured/Plain was the most common(299). Other prominent flavors included Hazelnut, Strawberry, Fruit, and Caramel/Caramelised.
Lastly, the majority of products launched in Singapore were imported (1,781), while only 261 were not imported. This highlights Singapore's reliance on international products, which may be due to limited domestic production capabilities or the appeal of foreign brands to Singaporean consumers.
| Product attributes | Number of new products by year | Total | ||||
|---|---|---|---|---|---|---|
| 2018 | 2019 | 2020 | 2021 | 2022 | ||
| Snacks | 341 | 312 | 351 | 352 | 354 | 1,710 |
| Chocolate Confectionery | 211 | 167 | 103 | 111 | 94 | 686 |
| Sugar and Gum Confectionery | 100 | 74 | 42 | 25 | 25 | 266 |
| Total Sample | 652 | 553 | 496 | 488 | 473 | 2,662 |
| Top 10 claims | ||||||
| Social Media | 157 | 140 | 149 | 149 | 123 | 718 |
| No Additives/Preservatives | 163 | 113 | 125 | 125 | 127 | 653 |
| Halal | 94 | 116 | 120 | 144 | 116 | 590 |
| Low/No/Reduced Allergen | 138 | 119 | 103 | 94 | 111 | 565 |
| Gluten Free | 136 | 114 | 94 | 92 | 109 | 545 |
| Free from Added/Artificial Preservatives | 101 | 76 | 92 | 79 | 82 | 430 |
| Seasonal | 102 | 98 | 76 | 77 | 54 | 407 |
| Not Specified | 109 | 91 | 66 | 60 | 63 | 389 |
| Free from Added/Artificial Colourings | 107 | 62 | 69 | 79 | 71 | 388 |
| Kosher | 107 | 78 | 62 | 60 | 59 | 366 |
| Top 10 flavours (including blend) | ||||||
| Unflavoured/Plain | 75 | 80 | 43 | 53 | 48 | 299 |
| Hazelnut | 17 | 21 | 8 | 9 | 15 | 70 |
| Strawberry | 21 | 9 | 12 | 7 | 7 | 56 |
| Fruit | 12 | 15 | 10 | 5 | 6 | 48 |
| Flavours Unavailable | 14 | 9 | 10 | 8 | 7 | 48 |
| Caramel/Caramelised | 15 | 14 | 7 | 4 | 5 | 45 |
| Cheese | 8 | 10 | 5 | 5 | 8 | 36 |
| Orange/Sweet Orange | 15 | 6 | 5 | 6 | 3 | 35 |
| Almond | 11 | 9 | 3 | 5 | 5 | 33 |
| Prawn/Shrimp | 2 | 3 | 9 | 5 | 13 | 32 |
| Top 10 ingredients | ||||||
| White Sugar (Food) | 501 | 389 | 367 | 369 | 320 | 1,946 |
| Salt (Food) | 342 | 293 | 300 | 327 | 281 | 1,543 |
| Food Acids | 217 | 157 | 144 | 152 | 142 | 812 |
| Emulsifiers | 221 | 167 | 125 | 120 | 120 | 753 |
| Soy Lecithin (Food) | 200 | 158 | 119 | 112 | 117 | 706 |
| Cocoa Fat (Food) | 196 | 168 | 101 | 105 | 98 | 668 |
| Flavouring Substances (Food) | 184 | 143 | 103 | 117 | 117 | 664 |
| Citric Acid (Food) | 182 | 130 | 118 | 108 | 122 | 660 |
| Palm Oil (Food) | 123 | 98 | 140 | 109 | 92 | 562 |
| Food Colours | 149 | 120 | 101 | 105 | 83 | 558 |
| Top 10 package types | ||||||
| Flexible | 376 | 317 | 269 | 270 | 287 | 1,519 |
| Flexible stand-up pouch | 112 | 125 | 126 | 117 | 108 | 588 |
| Jar | 37 | 20 | 21 | 27 | 30 | 135 |
| Carton | 61 | 34 | 22 | 10 | 7 | 134 |
| Flexible sachet | 15 | 18 | 15 | 13 | 6 | 67 |
| Composite | 9 | 16 | 16 | 20 | 6 | 67 |
| Tub | 16 | 8 | 4 | 1 | 4 | 33 |
| Tray | 4 | 1 | 6 | 9 | 4 | 24 |
| Can | 2 | 5 | 1 | 5 | 8 | 21 |
| Rigid box | 4 | 2 | 7 | 4 | 0 | 17 |
| Launch types | ||||||
| New Variety/Range Extension | 125 | 128 | 80 | 72 | 60 | 465 |
| New Product | 288 | 214 | 212 | 183 | 179 | 1,076 |
| New Packaging | 199 | 153 | 140 | 136 | 141 | 769 |
| New Variety/Range Extension | 151 | 167 | 129 | 154 | 143 | 744 |
| Relaunch | 14 | 17 | 15 | 13 | 9 | 68 |
| New Formulation | 0 | 2 | 0 | 2 | 1 | 5 |
| Product origin | ||||||
| Imported | 434 | 381 | 332 | 309 | 325 | 1,781 |
| Not imported | 27 | 39 | 66 | 75 | 54 | 261 |
| Source: Mintel GNPD, 2022 | ||||||
| Category | Number of products | Average price per 100 ml/g | Average price per product |
|---|---|---|---|
| Potato Snacks | 356 | 2.84 | 3.57 |
| Seasonal Chocolate | 250 | 3.96 | 7.79 |
| Individually Wrapped Chocolate Pieces | 212 | 4.79 | 8.84 |
| Meat Snacks | 182 | 5.69 | 6.52 |
| Hors d'oeuvres/Canapes | 182 | 1.80 | 5.95 |
| Pastilles, Gums, Jellies & Chews | 170 | 2.38 | 4.45 |
| Fruit Snacks | 155 | 5.13 | 4.66 |
| Non-Individually Wrapped Chocolate Pieces | 153 | 4.85 | 6.77 |
| Nuts | 128 | 3.53 | 6.87 |
| Vegetable Snacks | 113 | 7.44 | 3.97 |
| Total Sample | 2,662 | 3.90 | 5.52 |
| Source: Mintel GNPD, 2022 | |||
New snack product examples
Smoked Barbecue Pumpkin Crisps with Chia Seeds & Wild Honey Smoked Barbecue
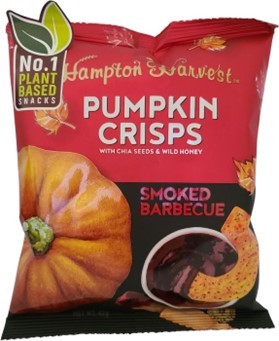
| Company | Atlantic Foods |
|---|---|
| Brand | Hampton Harvest |
| Category | Snacks |
| Sub-category | Vegetable snacks |
| Store type | Supermarket |
| Date published | November 2022 |
| Launch type | New variety / range extension |
| Price in US dollars | 2.71 |
Hampton Harvest Smoked Barbecue Pumpkin Crisps with Chia Seeds & Wild Honey are now available, and retail in a 42 gram pack. - No. 1 plant based snacks - Gluten free - These delicious crisps are made with fresh pumpkin, chia seeds and brown rice, offering a good source of protein, and a bounty of fall flavour with each bite
Dark Chocolate Banana Truffles
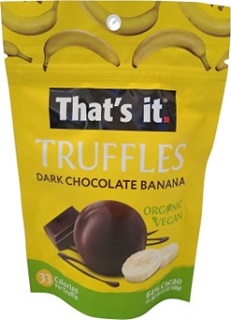
| Company | That's It Nutrition |
|---|---|
| Brand | That's It. |
| Category | Chocolate confectionery |
| Store type | Supermarket |
| Date published | September 2022 |
| Launch type | New product |
| Price in US dollars | 5.65 |
That's It. Dark Chocolate Banana Truffles is now available, and retail in a 100 gram pack. - Organic - Vegan - Delicious and guilt-free indulgence with only 33 calories in each decadent truffle - 64% cacao - Kosher - 100% plant-based treats - Logos and certifications: Gluten free, Non GMO Project, USDA Organic, Paleo Certified, Cocoa Fair Trade Certified
Organic Manuka Honey Pops Variety

| Company | Wedderspoon Organic |
|---|---|
| Brand | Wedderspoon |
| Sub-category | Lollipops |
| Import status | Imported product |
| Store type | Internet / mail order |
| Date published | December 2022 |
| Launch type | New product |
| Price in US dollars | 10.10 |
Wedderspoon Organic Manuka Honey Pops Variety is now available and retails in a 118 gram pack. - Orange natural flavour, grape natural flavour and raspberry natural flavour - Natural flavor - 100% recommended daily amount of vitamin C per serving for kids aged four to eight - No artificial colors or artificial flavors - A delicious recipe for kids of all ages - Made with genuine organic manuka honey - Kosher - Logos and certifications: USDA Organic, Quality Assurance International Certified Organic
Nut Mix
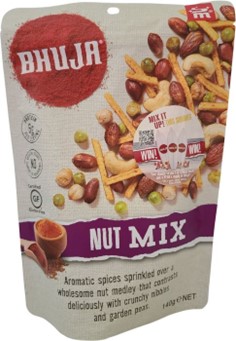
| Company | Majans |
|---|---|
| Brand | M Bhuja |
| Sub-category | Snack mixes |
| Import status | Imported product |
| Store type | Supermarket |
| Date published | November 2022 |
| Launch type | New variety / range extension |
| Price in US dollars | 3.21 |
M Bhuja Nut Mix is now available, and retails in a 180 gram pack. - Aromatic spices sprinkled over a wholesome nut medley that contrasts deliciously with crunchy nibbles and garden peas - Vegan and vegetarian friendly - 6 grams protein per serve - No MSG, artificial colours, flavours, preservatives - Made from at least 25% Australian ingredients - Logos and certifications: Certified Gluten Free, QR code, Facebook, Twitter, Instagram
For more information
The Canadian Trade Commissioner Service:
International Trade Commissioners can provide Canadian industry with on-the-ground expertise regarding market potential, current conditions and local business contacts, and are an excellent point of contact for export advice.
More agri-food market intelligence:
International agri-food market intelligence
Discover global agriculture and food opportunities, the complete library of Global Analysis reports, market trends and forecasts, and information on Canada's free trade agreements.
Agri-food market intelligence service
Canadian agri-food and seafood businesses can take advantage of a customized service of reports and analysis, and join our email subscription service to have the latest reports delivered directly to their inbox.
More on Canada's agriculture and agri-food sectors:
Canada's agriculture sectors
Information on the agriculture industry by sector. Data on international markets. Initiatives to support awareness of the industry in Canada. How the department engages with the industry.
For additional information on the upcoming trade show Food & Hotel Asia (FHA), please contact:
Ben Berry, Deputy Director
Trade Show Strategy and Delivery
Agriculture and agri-food Canada
ben.berry@agr.gc.ca
Resources
- Euromonitor International, 2023
- Global Trade Tracker, 2023
- Ministry of Trade and Industry Singapore (2021). MTI Maintains 2021 GDP Growth Forecast at "4.0 to 6.0 Per Cent" [Press release].
- Mintel Global New Products Database, 2023
- World Bank. (2021). The World Bank in Singapore
Sector Trends Analysis – Snacks in Singapore
Global Analysis Report
Prepared by: Rouzbeh Parsi, Student (co-op)
© His Majesty the King in Right of Canada, represented by the Minister of Agriculture and Agri-Food (2023).
Photo credits
All photographs reproduced in this publication are used by permission of the rights holders.
All images, unless otherwise noted, are copyright His Majesty the King in Right of Canada.
To join our distribution list or to suggest additional report topics or markets, please contact:
Agriculture and Agri-Food Canada, Global Analysis1341 Baseline Rd, Tower 5, 3rd floor
Ottawa ON K1A 0C5
Canada
Email: aafc.mas-sam.aac@agr.gc.ca
The Government of Canada has prepared this report based on primary and secondary sources of information. Although every effort has been made to ensure that the information is accurate, Agriculture and Agri-Food Canada (AAFC) assumes no liability for any actions taken based on the information contained herein.
Reproduction or redistribution of this document, in whole or in part, must include acknowledgement of agriculture and agri-food Canada as the owner of the copyright in the document, through a reference citing AAFC, the title of the document and the year. Where the reproduction or redistribution includes data from this document, it must also include an acknowledgement of the specific data source(s), as noted in this document.
Agriculture and Agri-Food Canada provides this document and other report services to agriculture and food industry clients free of charge.