

Note: This report includes forecasting data that is based on baseline historical data.
Executive summary
The snack market in South Korea is experiencing consistent growth across most categories. Over 2018 to 2022, snacks saw 1.0% growth annually to a market value of US$6.4 billion.
Ice cream experienced the highest growth at 3.3% annually. Over 2023 to 2027, Sweet Biscuits, Snack Bars, and Fruit Snacks is projected to grow the strongest by 4.3% to 1.4 billion in 2027.
Over 2018 to 2022, the consumption of snacks mainly took place at home due to pandemic related restrictions. However, with the lifting of these restrictions, people are returning to their pre-pandemic lifestyles with consumption moving to schools, universities, and workplaces in addition to the home.
In terms of distribution channels, ecommerce showed the highest growth during the pandemic, over 2018 to 2022, and is expected to continue growing at the expense of retail offline channels.
New snack products introduced over 2018 to 2022 focused on convenience and nutrition, such as "Microwavable", "Convenient packaging", "Wholegrain", and "High/added protein", which suggests that consumers still prefer convenience but with more health-conscious snacks.
Domestic brands are innovating with unique flavours and textures to respond to consumers' post pandemic focus on general preventative health, regular exercise, and protein intake. Top flavours of new snack products include plain, roasted/toasted, cheese, shrimp, and kimchi.
Market overview
The snack market in South Korea is experiencing consistent growth across most categories. Over the 2018 to 2022 period, snacks saw 1.0% growth annually to a market value of US$6.4 billion. Ice cream experienced the highest growth at 3.3% annually. Over 2023 to 2027, Sweet Biscuits, Snack Bars, and Fruit Snacks is projected to grow the strongest by 4.3% to 1.4 billion in 2027.
| Category | 2018 | 2022 | CAGR* (%) 2018-2022 | 2023 | 2027 | CAGR* (%) 2023-2027 |
|---|---|---|---|---|---|---|
| Snacks | 6,210.4 | 6,449.9 | 1.0 | 6,678.0 | 7,336.4 | 2.4 |
| Confectionery | 1,468.6 | 1,283.6 | −3.3 | 1,371.3 | 1,560.6 | 3.3 |
| Ice cream | 1,544.7 | 1,762.0 | 3.3 | 1,818.8 | 1,828.7 | 0.1 |
| Savoury snacks | 2,173.3 | 2,283.1 | 1.2 | 2,330.2 | 2,575.6 | 2.5 |
| Sweet biscuits, snack bars and fruit snacks | 1,023.7 | 1,121.2 | 2.3 | 1,157.7 | 1,371.6 | 4.3 |
|
Source: Euromonitor International, 2023 *CAGR: Compound annual growth rate |
||||||
Confectionery
Confectionary retail sales declined by 3.3% annually over the 2018 to 2022 period, with gum and sugar confectionary sales falling the most. Sales of confectionery subcategories are expected to rebound over the next five years by 3.3%. Within chocolate confectionery, sales of seasonal chocolate is forecast to grow the most by 4.5% annually over the 2023 to 2027 period. Sales of sugar confectionery is expected to grow 4.3% and gum by 3.9% annually.
According to Euromonitor, chocolate confectionery is set to return to slight retail sales growth; however, recovery varies at the category level. Types of chocolate generally used for on-the-go consumption stagnated during the pandemic period due to the restrictions on movement and the mask mandate, while those for home consumption increased. following the lifting of the mask mandate, consumption patterns are returning to pre-pandemic habits. Retail value sales of countlines and chocolate pouches and bags are expected to recover over 2023 to 2027, whilst on the other hand, tablets are not expected to rebound, despite the end of the pandemic. A contraction of the celebration culture as a result of the pandemic had a negative impact on sales of chocolate confectionery on Valentine's Day, which also saw a growing number of alternative gift options other than chocolate, negatively impacting sales of seasonal chocolate.
Gum recorded double-digit sales declines over 2018 to 2022 with the mask mandate and restrictions on outdoor activities during the COVID-19 outbreak being the main factors. Despite the end of the indoor and outdoor mask mandates in 2022, many South Koreans still wear their masks outside. Retail gum sales are expected to rebound over 2023 to 2027, however, growth is expected to be short-lived amidst additional concerns that the repetitive chewing of gum can have a negative impact on the jawline. In addition, due to growing concerns that repetitive chewing of gum can negatively affect the jawline, the demand for replacement products has been increasing, especially amongst those in their 20s and 30s, who tend to be more concerned about such a negative impact.
Sugar confectionery saw sales fall by 1.7% over the 2018 to 2022 period with most subcategories registering sales declines. South Koreans tend to seek fruit flavours in mints, even though this makes the freshness sensation less strong, with medicated confectionery likely to follow the same trend. While the dominant brand in the category from Lotte Confectionery, Mok Candy, used to be famous for its freshness from ingredients of quince and herb extract, flavour is now considered the new sales driver, rather than the level of freshness. Another company, Orion, also innovated its best-selling jellies brand My Gummy. The product is the shape of a grape with a different texture on the outside and inside the jelly, by filling the inside with a soft texture jelly, like grape juice, to simulate the taste and texture of real grape flesh.
| Category | 2018 | 2022 | CAGR* (%) 2018-2022 | 2023 | 2027 | CAGR* (%) 2023-2027 |
|---|---|---|---|---|---|---|
| Confectionery | 1,468.6 | 1,283.6 | −3.3 | 1,371.3 | 1,560.6 | 3.3 |
| Chocolate confectionery | 628.0 | 579.9 | −2.0 | 608.3 | 661.5 | 2.1 |
| Chocolate pouches and bags | 158.1 | 161.0 | 0.5 | 167.9 | 171.2 | 0.5 |
| Boxed assortments | 39.7 | 42.7 | 1.8 | 44.7 | 51.0 | 3.4 |
| Chocolate with Toys | 50.2 | 44.9 | −2.7 | 44.0 | 44.1 | 0.1 |
| Countlines | 200.3 | 176.1 | −3.2 | 185.6 | 213.7 | 3.6 |
| Seasonal chocolate | 34.4 | 35.7 | 0.9 | 35.9 | 42.8 | 4.5 |
| Tablets | 142.5 | 116.8 | −4.9 | 127.7 | 136.0 | 1.6 |
| Other chocolate confectionery | 2.7 | 2.6 | −1.1 | 2.6 | 2.6 | 0.4 |
| Gum | 235.2 | 138.6 | −12.4 | 161.0 | 187.3 | 3.9 |
| Bubble gum | 33.5 | 15.4 | −17.6 | 17.6 | 20.5 | 3.9 |
| Chewing gum | 201.8 | 123.2 | −11.6 | 143.4 | 166.8 | 3.9 |
| Sugar confectionery | 605.4 | 565.1 | −1.7 | 602.0 | 711.7 | 4.3 |
| Boiled sweets | 51.6 | 35.2 | −9.2 | 38.3 | 41.4 | 2.0 |
| Lollipops | 38.9 | 32.7 | −4.2 | 35.3 | 41.7 | 4.2 |
| Medicated confectionery | 47.2 | 37.0 | −5.9 | 39.9 | 50.2 | 5.9 |
| Mints | 24.0 | 24.6 | 0.6 | 26.4 | 34.7 | 7.1 |
| Pastilles, gummies, jellies and chews | 345.7 | 321.6 | −1.8 | 343.8 | 405.6 | 4.2 |
| Toffees, caramels and nougat | 15.0 | 11.3 | −7.0 | 12.2 | 13.5 | 2.6 |
| Other sugar confectionery | 82.9 | 102.8 | 5.5 | 106.1 | 124.6 | 4.1 |
|
Source: Euromonitor International, 2023 *CAGR: Compound annual growth rate |
||||||
| Brand (Company) | 2018 | 2019 | 2020 | 2021 | 2022 | CAGR* (%) 2018-2022 |
|---|---|---|---|---|---|---|
| Lotte (Lotte Group) | 109.9 | 108.8 | 85.5 | 78.5 | 75.9 | −8.8 |
| Haribo (Haribo GmbH & Co KG) | 58.6 | 59.1 | 56.7 | 55.6 | 56.4 | −0.9 |
| Kinder (Ferrero and related parties) | 55.7 | 46.1 | 48.1 | 51.1 | 52.5 | −1.5 |
| Ferrero Rocher (Ferrero and related parties) | 40.3 | 51.3 | 56.4 | 54.2 | 51.6 | 6.4 |
| Ghana (Lotte Group) | 70.1 | 64.1 | 54.3 | 50.7 | 49.8 | −8.2 |
| My Chew (Crown Confectionery Co Ltd) | 50.6 | 49.3 | 45.4 | 46.4 | 48.0 | −1.3 |
| Petitzel (CJ Corp) | 38.4 | 41.0 | 43.6 | 44.9 | 45.6 | 4.4 |
| Free Time (Crown Confectionery Co Ltd) | 51.2 | 53.0 | 47.7 | 40.6 | 42.6 | −4.5 |
| Crunky (Lotte Group) | 37.5 | 35.5 | 40.7 | 39.9 | 40.6 | 2.0 |
| Jellycious (Lotte Group) | 28.3 | 30.7 | 28.3 | 26.9 | 27.6 | −0.7 |
|
Source: Euromonitor International, 2023 *CAGR: Compound annual growth rate |
||||||
Ice cream
Ice cream in South Korea has experienced steady growth over the past five years by 3.3% annually over the 2018 to 2022 period. Impulse ice cream is the largest subcategory, however, the sales of take-home ice cream increased fastest by 8.2% annually over the 2018 to 2022 period. Ice cream consumption is expected to stagnate over 2023 to 2027. As ice cream sales are seasonal in South Korea, with high reliance on the summer months, the return of international travel for summer holidays is likely to weaken domestic sales of ice cream, as relatively fewer people will stay in the country. However, over the mid or long term, other different negative factors are likely to play in the ice cream category. The main consumer group for ice cream, children, continues to see a decline due to the country's low birth rate, while the elderly population is constantly increasing. The emergence of new dessert snacks as an alternative to ice cream is likely to further threaten sales of ice cream. In this regard, the industry sees declines in ice cream as a natural phenomenon, with a lack of new drivers that could appeal to adult consumers.
| Category | 2018 | 2022 | CAGR* (%) 2018-2022 | 2023 | 2027 | CAGR* (%) 2023-2027 |
|---|---|---|---|---|---|---|
| Ice cream | 1,544.7 | 1,762.0 | 3.3 | 1,818.8 | 1,828.7 | 0.1 |
| Frozen yoghurt | 27.4 | 20.1 | −7.5 | 20.1 | 18.2 | −2.4 |
| Impulse ice cream | 1,169.9 | 1,265.1 | 2.0 | 1,303.0 | 1,285.7 | −0.3 |
| Take-Home ice cream | 347.4 | 476.7 | 8.2 | 495.7 | 524.7 | 1.4 |
|
Source: Euromonitor International, 2023 *CAGR: Compound annual growth rate |
||||||
| Brand (Company) | 2018 | 2019 | 2020 | 2021 | 2022 | CAGR* (%) 2018-2022 |
|---|---|---|---|---|---|---|
| Together (Binggrae Co Ltd) | 67.6 | 66.1 | 71.2 | 77.8 | 80.2 | 4.4 |
| World Cone (Lotte Group) | 75.2 | 68.5 | 70.7 | 76.2 | 78.3 | 1.0 |
| Ssamanco (Binggrae Co Ltd) | 61.9 | 66.8 | 69.4 | 74.4 | 76.1 | 5.3 |
| Häagen-Dazs (General Mills Inc) | 64.3 | 52.9 | 55.9 | 67.5 | 71.3 | 2.6 |
| Melona (Binggrae Co Ltd) | 67.1 | 58.8 | 59.6 | 63.6 | 64.9 | −0.8 |
| Goo Goo (Lotte Group) | 44.3 | 43.9 | 48.9 | 54.0 | 56.4 | 6.2 |
| Bbangbbarae (Lotte Group) | 36.4 | 40.3 | 42.4 | 46.3 | 47.5 | 6.9 |
| Bravo Cone (Binggrae Co Ltd) | 45.3 | 45.8 | ||||
| Papico (Lotte Group) | 42.3 | 34.3 | 36.9 | 40.6 | 41.7 | −0.3 |
| Bibibig (Binggrae Co Ltd) | 39.7 | 36.5 | 37.3 | 39.7 | 40.4 | 0.4 |
|
Source: Euromonitor International, 2023 *CAGR: Compound annual growth rate |
||||||
Savoury snacks
Sales of savoury snacks in South Korea were flat over the 2018 to 2022 period with the strongest sales growth in pretzels, popcorn, and meat snacks. Sales growth is expected to grow 2.5% annually over 2023 to 2027, as inflation brings price pressure over the next few years and may bring home consumption back over 2023 to 2027, boosting sales of savoury snacks.
While meat jerkies were originally positioned as healthy snacks in South Korea, due to their high protein content, consumption occasions with alcoholic beverages such as beer or wine are growing. A series of innovations have been launched by domestic brands. Flavour innovation has been the most common approach. The leading beef jerky brand, Ziller from Sempio Foods, is a pioneer in flavoured jerkies, with the development of unprecedented flavour combinations in packaged jerky products, which include butter-garlic, buttercorn and butter-soy sauce, apart from the spicy taste that is already popular across the category. Meanwhile, with the growing demand for vegetarian or vegan diets, a vegan jerky was also released by Unlimited, a food tech company that leads alternative meats domestically. The product not just embodies a rich taste and chewy texture similar to actual meat, and has a high protein content, but also has a clean label, as it does not contain cholesterol or trans-fats, and does not use artificial colourings.
| Category | 2018 | 2022 | CAGR* (%) 2018-2022 | 2023 | 2027 | CAGR* (%) 2023-2027 |
|---|---|---|---|---|---|---|
| Savoury snacks | 2,173.3 | 2,283.1 | 1.2 | 2,330.2 | 2,575.6 | 2.5 |
| Nuts, seeds and trail mixes | 343.4 | 326.0 | −1.3 | 335.9 | 386.2 | 3.6 |
| Salty snacks | 1,308.5 | 1,355.6 | 0.9 | 1,372.3 | 1,518.5 | 2.6 |
| Savoury biscuits | 88.8 | 92.7 | 1.1 | 94.2 | 95.6 | 0.4 |
| Popcorn | 84.2 | 122.0 | 9.7 | 125.3 | 126.1 | 0.1 |
| Pretzels | 9.5 | 14.4 | 10.9 | 14.9 | 16.1 | 1.9 |
| Meat snacks | 157.8 | 189.9 | 4.7 | 198.2 | 221.9 | 2.9 |
| Seafood snacks | 142.0 | 140.8 | −0.2 | 146.4 | 160.9 | 2.4 |
| Other savoury snacks | 39.1 | 41.8 | 1.7 | 43.0 | 50.3 | 4.0 |
|
Source: Euromonitor International, 2023 *CAGR: Compound Annual Growth Rate |
||||||
| Brand (Company) | 2018 | 2019 | 2020 | 2021 | 2022 | CAGR* (%) 2018-2022 |
|---|---|---|---|---|---|---|
| Saewookang (Nongshim Co Ltd) | 81.5 | 83.7 | 101.0 | 107.7 | 104.7 | 6.4 |
| Orion (Orion Group) | 95.9 | 99.6 | 108.8 | 102.8 | 100.1 | 1.1 |
| Kokalcorn (Lotte Group) | 83.3 | 84.1 | 87.2 | 78.5 | 75.4 | −2.4 |
| Crown (Crown Confectionery Co Ltd) | 67.2 | 73.3 | 78.7 | 73.3 | 70.4 | 1.2 |
| Turtle Chip (Orion Group) | 50.7 | 33.3 | 46.0 | 67.9 | 69.8 | 8.3 |
| Max Bong (CJ Corp) | 55.1 | 69.9 | 62.8 | 57.7 | 60.4 | 2.3 |
| Honey Butter & Other Almond series (Gilim International Co Ltd) | 50.8 | 44.7 | 51.2 | 56.7 | 59.7 | 4.1 |
| Pringles (Kellogg Co) | 53.5 | 56.0 | 54.8 | 60.4 | 58.2 | 2.1 |
| Mat Dongsan (Crown Confectionery Co Ltd) | 46.2 | 50.3 | 53.2 | 54.1 | 52.3 | 3.1 |
| Honey Butter Chips (Crown Confectionery Co Ltd) | 52.3 | 49.2 | 51.0 | 51.6 | 49.7 | −1.3 |
|
Source: Euromonitor International, 2023 *CAGR: Compound annual growth rate |
||||||
Sweet biscuits, snack bars and fruit snacks
The total retail sales of this category grew 2.3% annually to reach US$1.1 billion in 2022 and is expected to continue growing steadily by 4.3% annually from 2022 to 2027. During the pandemic, the consumption of these products mainly took place at home due to pandemic related restrictions. With the lifting of these restrictions, people are returning to their pre-pandemic lifestyles and consumption is moving to schools, universities and workplaces.
Within this category, sweet biscuits is largest with projected sales of US$976.5 million in 2027 growing 3.8% annually. Protein/energy bars are forecast to have the highest growth by 10.8%, followed by snack bars with 7.6%. Growth of this category has been driven by consumers' increasing demand for healthier snacking options as the pandemic highlighted the importance of general preventative health, the need for regular exercise and protein intake. Impulse purchases have also started to rebound in convenience stores. However, on-the-go consumption is still limited as South Koreans are still reluctant to take their masks off outside.
| Category | 2017 | 2018 | 2019 | 2020 | 2021 | 2022 |
|---|---|---|---|---|---|---|
| Sweet biscuits, snack bars and fruit snacks | 151.5 | 154.6 | 157.8 | 174.3 | 176.6 | 181.6 |
| Fruit snacks (dried fruit) | 5.7 | 5.9 | 6.0 | 6.3 | 6.5 | 6.7 |
| Snack bars | 13.3 | 13.7 | 14.0 | 15.3 | 15.5 | 15.9 |
| Cereal bars | 9.8 | 10.2 | 10.4 | 11.5 | 11.5 | 11.8 |
| Protein/energy bars | 3.4 | 3.5 | 3.6 | 3.9 | 4.0 | 4.1 |
| Sweet biscuits | 132.5 | 135.1 | 137.7 | 152.7 | 154.6 | 159.0 |
| Chocolate coated biscuits | 25.7 | 26.5 | 27.4 | 30.6 | 31.2 | 32.2 |
| Cookies | 20.3 | 20.6 | 21.0 | 22.8 | 22.7 | 23.1 |
| Filled biscuits | 45.0 | 45.8 | 46.4 | 51.7 | 52.7 | 54.5 |
| Plain biscuits | 36.1 | 36.6 | 37.2 | 41.1 | 41.4 | 42.2 |
| Wafers | 5.3 | 5.5 | 5.7 | 6.5 | 6.6 | 7.0 |
|
Source: Euromonitor International, 2023 *CAGR: Compound annual growth rate |
||||||
| Category | 2018 | 2022 | CAGR* (%) 2018-2022 | 2023 | 2027 | CAGR* (%) 2023-2027 |
|---|---|---|---|---|---|---|
| Sweet biscuits, snack bars and fruit snacks | 1,023.7 | 1,121.2 | 2.3 | 1,157.7 | 1,371.6 | 4.3 |
| Fruit snacks | 19.0 | 29.4 | 11.6 | 32.2 | 42.5 | 7.2 |
| Dried fruit | 19.0 | 29.4 | 11.6 | 32.2 | 42.5 | 7.2 |
| Snack bars | 56.5 | 115.3 | 19.5 | 131.0 | 175.8 | 7.6 |
| Cereal bars | 50.8 | 73.4 | 9.6 | 81.7 | 101.4 | 5.6 |
| Protein/energy bars | 5.7 | 41.9 | 64.7 | 49.3 | 74.4 | 10.8 |
| Sweet biscuits | 948.3 | 976.5 | 0.7 | 994.5 | 1,153.3 | 3.8 |
| Chocolate coated biscuits | 211.5 | 278.6 | 7.1 | 286.2 | 325.9 | 3.3 |
| Cookies | 207.1 | 193.8 | −1.6 | 197.7 | 231.8 | 4.1 |
| Filled biscuits | 260.2 | 229.0 | −3.1 | 231.5 | 287.1 | 5.5 |
| Plain biscuits | 181.4 | 188.3 | 0.9 | 189.8 | 207.3 | 2.2 |
| Wafers | 88.2 | 86.7 | −0.4 | 89.3 | 101.2 | 3.2 |
|
Source: Euromonitor International, 2023 *CAGR: Compound annual growth rate |
||||||
| Brand (Company) | 2018 | 2019 | 2020 | 2021 | 2022 | CAGR* (%) 2018-2022 |
|---|---|---|---|---|---|---|
| Pepero (Lotte Group) | 101.8 | 100.7 | 122.7 | 138.1 | 143.9 | 9.0 |
| Dr You (Orion Group) | 67.3 | 73.3 | 77.8 | 82.3 | 82.6 | 5.3 |
| Homerun Ball (Crown Confectionery Co Ltd) | 81.6 | 81.1 | 84.2 | 79.5 | 76.7 | −1.5 |
| Oreo (Mondelez International Inc) | 40.5 | 43.7 | 47.5 | 45.4 | 43.6 | 1.9 |
| Lotte (Lotte Group) | 48.2 | 41.5 | 40.4 | 39.3 | 38.4 | −5.6 |
| Margaret (Lotte Group) | 39.7 | 39.6 | 39.8 | 36.7 | 36.3 | −2.2 |
| Binch (Lotte Group) | 28.0 | 27.7 | 31.5 | 32.0 | 32.7 | 4.0 |
| Hime (Crown Confectionery Co Ltd) | 34.4 | 33.0 | 33.2 | 33.2 | 32.5 | −1.4 |
| Crown (Crown Confectionery Co Ltd) | 28.6 | 28.5 | 29.1 | 31.0 | 31.4 | 2.3 |
| Chic Choc (Lotte Group) | 36.0 | 36.0 | 25.7 | 28.8 | 30.5 | −4.0 |
|
Source: Euromonitor International, 2023 *CAGR: Compound annual growth rate |
||||||
Retail channels
In terms of distribution channels, ecommerce showed the highest growth during the pandemic, over the 2018 to 2022 period, and is expected to continue growing at the expense of retail offline channels.
From 2018 to 2022, offline channels, which accounted for 91.4% of total sales in 2022, experienced an annual decline of 0.1% in sales, while ecommerce saw a 15.1% annual increase in sales. The market share of non-grocery retailers, such as food/drink/tobacco specialists and health and beauty specialists, also grew steadily by 74.7% and 21.8% annually over 2018 to 2022.
| Outlet type | 2018 | 2019 | 2020 | 2021 | 2022 | CAGR* (%) 2018-2022 |
|---|---|---|---|---|---|---|
| Retail channels | 6,472.1 | 6,079.2 | 6,181.5 | 6,414.1 | 6,449.9 | −0.1 |
| Retail offline | 6,154.8 | 5,744.5 | 5,746.7 | 5,902.4 | 5,892.8 | −1.1 |
| Grocery retailers | 6,041.3 | 5,630.0 | 5,632.1 | 5,775.9 | 5,758.0 | −1.2 |
| Convenience retail | 1,305.0 | 1,305.2 | 1,323.1 | 1,374.8 | 1,398.9 | 1.8 |
| Convenience stores | 1,301.1 | 1,301.0 | 1,318.7 | 1,370.0 | 1,393.8 | 1.7 |
| Forecourt retailers | 3.9 | 4.3 | 4.4 | 4.8 | 5.1 | 7.1 |
| Supermarkets | 1,775.5 | 1,609.1 | 1,605.5 | 1,589.5 | 1,542.3 | −3.5 |
| Hypermarkets | 1,773.3 | 1,612.7 | 1,516.9 | 1,528.8 | 1,521.2 | −3.8 |
| Discounters | 30.7 | 32.4 | 32.1 | 33.8 | 34.3 | 2.8 |
| Warehouse clubs | 76.1 | 82.1 | 99.5 | 113.9 | 121.0 | 12.3 |
| Food/drink/tobacco specialists | 35.2 | 114.7 | 183.9 | 290.6 | 327.7 | 74.7 |
| Small Local grocers | 1,045.5 | 873.6 | 871.0 | 844.5 | 812.5 | −6.1 |
| Non-grocery retailers | 102.2 | 104.2 | 107.7 | 119.4 | 126.6 | 5.5 |
| General merchandise stores | 79.9 | 78.1 | 73.7 | 76.4 | 77.5 | −0.8 |
| Health and beauty specialists | 22.3 | 26.2 | 34.0 | 43.0 | 49.1 | 21.8 |
| Vending | 9.2 | 8.2 | 4.9 | 4.6 | 5.0 | −14.3 |
| Direct selling | 2.0 | 2.0 | 2.0 | 2.5 | 3.1 | 11.3 |
| Retail ecommerce | 317.3 | 334.7 | 434.7 | 511.7 | 557.2 | 15.1 |
|
Source: Euromonitor International, 2023 *CAGR: Compound annual growth rate |
||||||
New product launches
A total of 3,668 new snack products were introduced over the 2018 to 2022 period. Top claims were convenience and nutritional focused, such as "Microwavable", "Convenient packaging", "Wholegrain", and "High/added protein", which suggests that consumers still prefer convenience but with more health-conscious snacks. Top flavours included plain and roasted/toasted, followed by cheese, shrimp, and kimchi.
| Product attributes | Number of new products by year | Total | ||||
|---|---|---|---|---|---|---|
| 2018 | 2019 | 2020 | 2021 | 2022 | ||
| Yearly product launches | 833 | 860 | 657 | 658 | 660 | 3,668 |
| Top 10 claims | ||||||
| Not specified | 291 | 288 | 183 | 213 | 227 | 1,202 |
| Microwaveable | 114 | 76 | 83 | 70 | 70 | 413 |
| Convenient packaging | 74 | 129 | 85 | 59 | 54 | 401 |
| Premium | 71 | 88 | 78 | 51 | 66 | 354 |
| Ease of use | 38 | 62 | 74 | 58 | 100 | 332 |
| No additives/preservatives | 85 | 69 | 59 | 60 | 54 | 327 |
| Organic | 61 | 77 | 33 | 24 | 30 | 225 |
| Wholegrain | 61 | 30 | 46 | 37 | 39 | 213 |
| High/added protein | 29 | 27 | 37 | 65 | 54 | 212 |
| Social media | 35 | 43 | 34 | 46 | 49 | 207 |
| Top 10 companies | ||||||
| Emart / E-Mart | 44 | 47 | 37 | 16 | 18 | 162 |
| Lotte Shopping | 32 | 80 | 20 | 15 | 11 | 158 |
| Dongwon F&B | 17 | 22 | 9 | 24 | 13 | 85 |
| Lotte Confectionery | 19 | 12 | 27 | 17 | 2 | 77 |
| Haitai Confectionery & Foods | 19 | 14 | 13 | 15 | 14 | 75 |
| Home Plus | 13 | 10 | 27 | 15 | 9 | 74 |
| Dongwoo Nongsan | 18 | 29 | 12 | 3 | 5 | 67 |
| CJ CheilJedang | 6 | 25 | 5 | 14 | 14 | 64 |
| Pulmuone | 21 | 7 | 11 | 17 | 8 | 64 |
| GS Retail | 29 | 21 | 5 | 6 | 2 | 63 |
| Top 5 flavours (including blend) | ||||||
| Unflavoured/Plain | 115 | 144 | 105 | 79 | 90 | 533 |
| Roasted/Toasted | 48 | 59 | 36 | 19 | 32 | 194 |
| Cheese | 12 | 16 | 23 | 13 | 9 | 73 |
| Prawn/Shrimp | 16 | 9 | 19 | 16 | 12 | 72 |
| Kimchi | 9 | 7 | 18 | 15 | 20 | 69 |
| Top 5 ingredients | ||||||
| White sugar | 509 | 484 | 396 | 417 | 384 | 2,190 |
| Salt | 498 | 437 | 405 | 407 | 414 | 2,161 |
| Seasoning | 236 | 215 | 220 | 220 | 229 | 1,120 |
| Wheat flour | 244 | 208 |
221 |
221 | 188 | 1,082 |
| Flavour enhancers | 185 | 154 | 153 | 150 | 164 | 806 |
| Launch types | ||||||
| New product | 374 | 396 | 321 | 316 | 303 | 1,710 |
| New variety/Range extension | 332 | 329 | 250 | 245 | 253 | 1,409 |
| New packaging | 84 | 101 | 72 | 67 | 88 | 412 |
| Relaunch | 42 | 29 | 12 | 26 | 15 | 124 |
| New formulation | 1 | 5 | 2 | 4 | 1 | 13 |
| Top 5 package types | ||||||
| Flexible | 404 | 376 | 375 | 395 | 360 | 1,910 |
| Flexible stand-up pouch | 220 | 266 | 149 | 157 | 204 | 996 |
| Flexible sachet | 97 | 53 | 50 | 43 | 21 | 264 |
| Jar | 30 | 63 | 17 | 19 | 12 | 141 |
| Skinpack | 32 | 37 | 25 | 16 | 31 | 141 |
| Product origin | ||||||
| Imported | 23 | 37 | 26 | 42 | 32 | 160 |
| Not imported | 11 | 16 | 6 | 5 | 3 | 41 |
| Other | 799 | 807 | 625 | 611 | 625 | 3,467 |
| Source: Mintel GNPD, 2023 | ||||||
New product examples
Big Oat Scorched Rice Snack
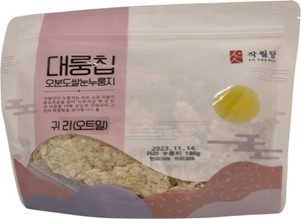
| Manufacturer | Dawon |
|---|---|
| Brand | Jagwoldam |
| Category | Snacks |
| Sub-category | Rice Snacks |
| Market | South Korea |
| Store name | www.coupang.com |
| Launch type | Internet / mail order |
| Price in US dollars | 5.27 |
Jagwoldam Big Oat Scorched Rice Snack retails in a 180 gram pack. - Carefully roasted - Logos and certifications: QR code, Instagram, Blog
Chocolate Protein Picky Bar
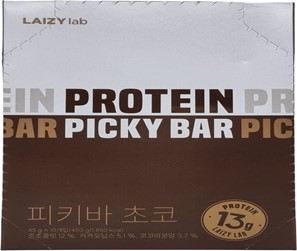
| Manufacturer | Samah International |
|---|---|
| Brand | Laizy Lab |
| Category | Snacks |
| Sub-category | Snack / cereal / energy bars |
| Market | South Korea |
| Store name | Naver |
| Store type | Internet / mail order |
| Price in US dollars | 13.70 |
Laizy Lab Chocolate Protein Picky Bar retails in a 450 gram pack containing ten 45 gram units. - Contains 13 gram of protein - Easy healthy meal replacement - Logos and certifications: HACCP, QR code
Sliced Potato Pancake
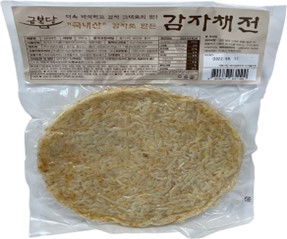
| Manufacturer | Kitchen in the Lab |
|---|---|
| Brand | Geumbokdang |
| Category | Snacks |
| Sub-category | Hors d'oeuvres / canapes |
| Market | South Korea |
| Store name | tohome.thehyundai.com |
| Store type | Internet / mail order |
| Price in US dollars | 4.20 |
Geumbokdang Sliced Potato Pancake retails in a 250 gram pack. - Crispy texture - Made with domestic potatoes - Logos and certifications: HACCP
100% Sweet Potato
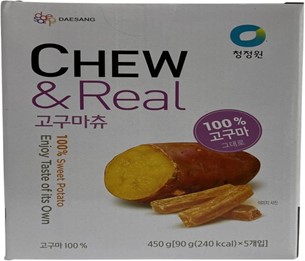
| Manufacturer | Ilshin Napu |
|---|---|
| Brand | Daesang Chungjungone |
| Category | Snacks |
| Sub-category | Cassava and other root-based |
| Market | South Korea |
| Store name | Costco |
| Store type | Club store |
| Price in US dollars | 8.90 |
Daesang Chungjungone Chew & Real 100% Sweet Potato has been relaunched under a new brand name, previously known as Chungjungone Smart Chew & Real, and in a newly designed 450 gram pack containing five 90 gram units. - Made with 100% natural ingredient - 100% sweet potato, newly harvested
For more information
The Canadian Trade Commissioner Service:
International Trade Commissioners can provide Canadian industry with on-the-ground expertise regarding market potential, current conditions and local business contacts, and are an excellent point of contact for export advice.
More agri-food market intelligence:
International agri-food market intelligence
Discover global agriculture and food opportunities, the complete library of Global Analysis reports, market trends and forecasts, and information on Canada's free trade agreements.
Agri-food market intelligence service
Canadian agri-food and seafood businesses can take advantage of a customized service of reports and analysis, and join our email subscription service to have the latest reports delivered directly to their inbox.
More on Canada's agriculture and agri-food sectors:
Canada's agriculture sectors
Information on the agriculture industry by sector. Data on international markets. Initiatives to support awareness of the industry in Canada. How the department engages with the industry.
For additional information on the upcoming Food and Hotel Seoul, please contact:
Ben Berry, Deputy Director
Trade Show Strategy and Delivery
Agriculture and agri-food Canada
ben.berry@agr.gc.ca
Resources
- Euromonitor International:
- Snacks in South Korea (July 2022)
- Savoury snacks in South Korea (July 2022)
- Chocolate confectionary in South Korea (July 2022)
- Gum in South Korea (July 2022)
- Ice cream in South Korea (July 2022)
- Sugar confectionary in South Korea (July 2022)
- Sweet biscuits, snack bars, and fruit snacks in South Korea (July 2022)
- Mintel Global New Products Database, 2023
Sector Trends Analysis – Snacks in South Korea
Global Analysis Report
Prepared by: Kris Clipsham, Market Analyst
© His Majesty the King in Right of Canada, represented by the Minister of Agriculture and Agri-Food (2023).
Photo credits
All photographs reproduced in this publication are used by permission of the rights holders.
All images, unless otherwise noted, are copyright His Majesty the King in Right of Canada.
To join our distribution list or to suggest additional report topics or markets, please contact:
Agriculture and Agri-Food Canada, Global Analysis1341 Baseline Rd, Tower 5, 3rd floor
Ottawa ON K1A 0C5
Canada
Email: aafc.mas-sam.aac@agr.gc.ca
The Government of Canada has prepared this report based on primary and secondary sources of information. Although every effort has been made to ensure that the information is accurate, Agriculture and Agri-Food Canada (AAFC) assumes no liability for any actions taken based on the information contained herein.
Reproduction or redistribution of this document, in whole or in part, must include acknowledgement of agriculture and agri-food Canada as the owner of the copyright in the document, through a reference citing AAFC, the title of the document and the year. Where the reproduction or redistribution includes data from this document, it must also include an acknowledgement of the specific data source(s), as noted in this document.
Agriculture and Agri-Food Canada provides this document and other report services to agriculture and food industry clients free of charge.