

Note: This report includes forecasting data that is based on baseline historical data.
Executive summary
Austria is a landlocked central European country. The result of that is that the country is not involved in fisheries and imports for most of its fish and seafood. Thus, the country's production is limited to aquaculture.
In 2020, Austria was the world's 35th largest importer of fish and seafood products and the 11th in the European Union (EU). The country's imports from the world were valued at US$581.6 million. Austria imports 94% of its seafood.
Fish and seafood products mainly come from other EU countries. Indeed, seven of the top 10 importers are EU members, with the non-EU members being Norway, Turkey and Viet-Nam.
In 2020, prepared/preserved tunas, smoked pacific salmon and prepared/preserved fish were the top three products imported by Austria.
In 2020, Canada was the 34th largest exporter of fish and seafood products to Austria, with a 0.3% market share. The three main products that Canada exported to Austria were fresh, chilled, frozen or dried seaweeds and other algae, frozen fillets of pacific salmon and frozen lobsters.
In 2015, the per capita consumption of fish and seafood was 13.2 kilograms. Consumption of fish and seafood was higher among older people while the younger population consumed below the EU's average. Austrian consumers do, however, opt for fish and seafood consumption as part of a healthy diet.
Tariffs on most fish and seafood Canadian exports have been eliminated with the implementation of the Canada-European Union Comprehensive Economic and Trade Agreement (CETA). Exports are expected to increase as more products will no longer be subjected to tariffs within the EU market, including Austria.
Introduction
Austria is a landlocked country and heavily relies on imports for its consumption of fish and seafood products consumption. The fishery is limited to aquaculture production and the country has put a strategy in place to increase its aquaculture production with freshwater fish from 34% to 60% by 2020. The "Aquaculture 2020 - Austrian strategy to increase the national fish production" report emphasizes the importance of sustainability and the food quality as guiding principles for its production and consumption. The goal is to improve self-sufficiency by mainly increasing trout production and carp pond farming.
Austria has one of the lowest consumers of fishing and seafood products in the European Union. However, the consumption of fish and seafood products has been increasing during recent years and this trend is expected to continue in the years to come.
Europe's fish stock is threatened by overfishing, and the European Union, therefore, encourages its member states to support sustainable fishing practices and has been advocating catch limits for some species. Sustainability is at the core of Austria's aquaculture promotion and producers are embracing this by adhering to the various certification or labelling of fish products.
Trade overview
Austria imports 95% of its seafood from the world (USDA, 2018). In 2020, the top three imports were prepared/preserved tunas, smoked pacific salmon and prepared/preserved fish. During the 2016-2020 period, the three fastest-growing imports in terms of value among the top ten imports Austrian fish and seafood were live trout, which grew by a Compound Annual Growth Rate (CAGR) of 10.2%, fresh/chilled fillets of pacific salmon and frozen fillets of pacific salmon, at 9.3% and 8.1%, respectively. In terms of quantity, the fastest-growing products were live trout (CAGR: 7.1%), frozen shrimps and prawns (6.2%) and flours, meals and pellets of fish or crustaceans, molluscs or other aquatic invertebrates, unfit for human consumption (5.9%).
In 2020, Germany was the largest supplier of fish and seafood to Austria, with imports valued at US$180.5 million, followed by the Netherlands (US$44.9 million) and Norway (US$41.6 million). Among Austria's ten largest suppliers, Spain had the highest growth over the 2016-2020 period, with a CAGR of 85.3.%, followed by Turkey (5.2%) and Italy (4.9%).
Direct fish and seafood exports to Austria are very low. Fish and seafood products mainly reach Austria by road or by water from other EU countries that have access to the World Ocean. Especially with sea freight, exports are often registered with the country where the product first enters the European Union through an importer. For Austria, this is often Germany and the Netherlands but not limited to these two countries.
| HS6 code | Description | 2016 | 2017 | 2018 | 2019 | 2020 | CAGR* % 2016-2020 |
|---|---|---|---|---|---|---|---|
| 160414 | Prepared or preserved tunas, skipjack and atlantic bonito (excluding minced) | 53.5 | 56.3 | 67.3 | 62.0 | 58.8 | 2.4 |
| 030541 | Smoked pacific salmon (excluding offal) | 50.1 | 61.2 | 60.2 | 61.2 | 49.4 | −0.4 |
| 160419 | Prepared or preserved fish, whole or in pieces (excluding minced, merely smoked, and salmon, herrings, sardines, sardinella, brisling or sprats, tunas, skipjack, bonito "sarda spp.", mackerel, anchovies, eels and shark fins) | 38.2 | 37.2 | 43.9 | 41.8 | 46.8 | 5.2 |
| 030617 | Frozen shrimps and prawns (excluding cold-water shrimps and prawns) | 26.6 | 30.9 | 33.1 | 35.2 | 30.3 | 3.3 |
| 030543 | Smoked trout (excluding offal) | 22.5 | 21.8 | 28.4 | 29.3 | 27.6 | 5.2 |
| 030441 | Fresh or chilled fillets of pacific salmon | 15.8 | 16.9 | 19.8 | 20.5 | 22.6 | 9.3 |
| 160529 | Prepared/preserved shrimps and prawns, in airtight containers (excluding smoked) | 17.3 | 20.3 | 20.9 | 19.4 | 20.0 | 3.7 |
| 160420 | Prepared or preserved fish (excluding whole or in pieces) | 18.6 | 21.7 | 23.7 | 22.7 | 17.9 | −0.9 |
| 030191 | Live trout | 12.0 | 14.2 | 13.3 | 14.7 | 17.7 | 10.2 |
| 030481 | Frozen fillets of pacific salmon | 12.5 | 14.2 | 20.4 | 16.6 | 17.0 | 8.1 |
| Total from the world | 562.0 | 592.3 | 628.2 | 621.1 | 581.7 | 0.9 | |
|
Source: Global Trade Tracker, 2020 *CAGR: Compound Annual Growth Rate |
|||||||
| HS6 code | Description | 2016 | 2017 | 2018 | 2019 | 2020 | CAGR* % 2016-2020 |
|---|---|---|---|---|---|---|---|
| 160419 | Prepared or preserved fish (excluding minced, merely smoked, and salmon, herrings, sardines, sardinella, brisling or sprats, tunas, skipjack, bonito "sarda spp.", mackerel, anchovies, eels and shark fins) | 9.5 | 9.8 | 11.1 | 9.9 | 10.9 | 3.5 |
| 160414 | Prepared or preserved tunas, skipjack and atlantic bonito (excluding minced) | 9.6 | 9.6 | 10.2 | 9.8 | 9.3 | −0.6 |
| 230120 | Flours, meals and pellets of fish or crustaceans, molluscs or other aquatic invertebrates, unfit for human consumption | 5.0 | 5.2 | 5.7 | 6.2 | 6.3 | 5.9 |
| 030191 | Live trout | 3.3 | 3.8 | 3.5 | 3.8 | 4.3 | 7.1 |
| 160412 | Prepared or preserved herrings (excluding minced) | 3.5 | 3.5 | 3.6 | 4.1 | 3.9 | 2.8 |
| 160420 | Prepared or preserved fish (excluding whole or in pieces) | 3.3 | 3.5 | 3.6 | 3.5 | 3.0 | −2.3 |
| 030617 | Frozen shrimps and prawns (excluding cold-water shrimps and prawns) | 2.3 | 2.5 | 2.6 | 3.3 | 2.9 | 6.2 |
| 030543 | Smoked trout (excluding offal) | 2.3 | 2.1 | 2.6 | 2.8 | 2.5 | 3.0 |
| 030541 | Smoked pacific salmon (excluding offal) | 2.8 | 3.0 | 2.8 | 3.1 | 2.5 | −2.3 |
| 030214 | Fresh or chilled atlantic salmon "salmo salar" and danube salmon "hucho hucho" | 2.8 | 1.6 | 2.3 | 2.3 | 1.9 | −10.1 |
| Total from the world | 83.3 | 83.3 | 84.9 | 87.0 | 82.9 | −0.1 | |
|
Source: Global Trade Tracker, 2020 *CAGR: Compound Annual Growth Rate |
|||||||
| Rank | Country | 2016 | 2017 | 2018 | 2019 | 2020 | CAGR* % 2016-2020 |
|---|---|---|---|---|---|---|---|
| 1 | Germany | 166.7 | 167.4 | 171.7 | 184.1 | 180.5 | 2.0 |
| 2 | Netherlands | 46.4 | 50.0 | 54.8 | 50.8 | 44.9 | −0.8 |
| 3 | Norway | 45.5 | 45.9 | 49.4 | 47.9 | 41.6 | −2.2 |
| 4 | Italy | 33.7 | 38.1 | 40.5 | 41.2 | 40.7 | 4.9 |
| 5 | Turkey | 30.2 | 25.9 | 31.9 | 34.5 | 36.9 | 5.2 |
| 6 | Viet-Nam | 25.8 | 32.8 | 33.3 | 33.8 | 30.4 | 4.2 |
| 7 | Poland | 34.5 | 39.5 | 42.6 | 36.5 | 28.0 | −5.1 |
| 8 | Denmark | 29.4 | 30.2 | 26.1 | 24.6 | 25.4 | −3.6 |
| 9 | Spain | 12.3 | 13.5 | 15.9 | 15.6 | 16.4 | 7.4 |
| 10 | France | 19.6 | 23.4 | 22.5 | 17.1 | 15.5 | −5.7 |
| 34 | Canada | 1.5 | 1.6 | 1.4 | 1.5 | 1.6 | 0.2 |
| Total from the world | 562.0 | 592.3 | 628.2 | 621.1 | 581.7 | 0.9 | |
|
Source: Global Trade Tracker, 2020 *CAGR: Compound Annual Growth Rate |
|||||||
Austria's top ten fish and seafood suppliers by product type, in US$ millions, in 2020
| HS6 code | Top products from Germany | 2020 |
|---|---|---|
| 160419 | Prepared/preserved fish, whole or in pieces | 36.2 |
| 030541 | Smoked pacific salmon (excluding offal) | 15.1 |
| 150420 | Fats and oils of fish and their fractions, whether or not refined (excluding liver oils and chemically modified) | 11.8 |
| 030441 | Fresh or chilled fillets of pacific salmon | 11.0 |
| 160412 | Prepared/preserved herrings, whole or in pieces (excluding minced) | 10.4 |
| Source: Global Trade Tracker, 2020 | ||
| HS6 code | Top products from the Netherlands | 2020 |
|---|---|---|
| 160414 | Prepared/preserved tunas, skipjack and atlantic bonito, whole or in pieces (excluding minced) | 15.3 |
| 030483 | Frozen fillets of flat fish | 2.8 |
| 160529 | Shrimps and prawns, prepared or preserved, in airtight containers (excluding smoked) | 2.5 |
| 160419 | Prepared/preserved fish, whole or in pieces | 2.3 |
| 030617 | Frozen shrimps and prawns, even smoked, whether in shell or not (excluding cold-water shrimps and prawns) | 2.1 |
| Source: Global Trade Tracker, 2020 | ||
| HS6 code | Top products from Norway | 2020 |
|---|---|---|
| 030214 | Fresh/chilled atlantic salmon "salmo salar" and danube salmon "hucho hucho" | 9.8 |
| 030441 | Fresh/chilled fillets of pacific salmon | 8.1 |
| 030541 | Smoked pacific salmon (excluding offal) | 8.1 |
| 030549 | Smoked fish, inlcuding fillets (excluding offal, pacific salmon, atlantic salmon, danube salmon, herring, trout, tilapia, catfish, carp, eels, nile perch and snakeheads) | 4.2 |
| 030481 | Frozen fillets of pacific salmon | 3.6 |
| Source: Global Trade Tracker, 2020 | ||
| HS6 code | Top products from Italy | 2020 |
|---|---|---|
| 160414 | Prepared/preserved tunas, skipjack and atlantic bonito, whole or in pieces (excluding minced) | 16.9 |
| 030191 | Live trout | 11.2 |
| 030442 | Fresh/chilled fillets of trout | 1.5 |
| 160416 | Prepared or preserved anchovies, whole or in pieces (excluding minced) | 1.1 |
| 160420 | Prepared or preserved fish (excluding whole or in pieces) | 0.9 |
| Source: Global Trade Tracker, 2020 | ||
| HS6 code | Top products from Turkey | 2020 |
|---|---|---|
| 030543 | Smoked trout (excluding offal) | 21.5 |
| 160419 | Prepared/preserved fish, whole or in pieces | 3.4 |
| 030285 | Fresh or chilled sea bream "sparidae" | 2.8 |
| 030489 | Frozen fish fillets, nowhere else specified | 2.5 |
| 030314 | Frozen trout | 2.1 |
| Source: Global Trade Tracker, 2020 | ||
| HS6 code | Top products from Viet-Nam | 2020 |
|---|---|---|
| 160529 | Shrimps and prawns, prepared/preserved, in airtight containers (excluding smoked) | 10.9 |
| 030617 | Frozen shrimps and prawns, even smoked, whether in shell or not (excluding cold-water shrimps and prawns) | 7.5 |
| 160521 | Shrimps and prawns, prepared/preserved, not in airtight containers (excluding smoked) | 5.1 |
| 030462 | Frozen fillets of catfish | 3.2 |
| 160414 | Prepared/preserved tunas, skipjack and atlantic bonito, whole or in pieces (excluding minced) | 2.1 |
| Source: Global Trade Tracker, 2020 | ||
| HS6 code | Top products from Poland | 2020 |
|---|---|---|
| 030541 | Smoked pacific salmon (excluding offal) | 12.7 |
| 160411 | Prepared or preserved salmon, whole or in pieces (excluding minced) | 3.7 |
| 160412 | Prepared or preserved herrings, whole or in pieces (excluding minced) | 2.1 |
| 030549 | Smoked fish, inlcuding fillets (excluding offal, pacific salmon, atlantic salmon, danube salmon, herring, trout, tilapia, catfish, carp, eels, nile perch and snakeheads) | 1.9 |
| 030543 | Smoked trout (excluding offal) | 1.7 |
| Source: Global Trade Tracker, 2020 | ||
| HS6 code | Top products from Denmark | 2020 |
|---|---|---|
| 030191 | Live trout | 5.6 |
| 230120 | Flours, meals and pellets of fish or crustaceans, molluscs or other aquatic invertebrates, unfit for human consumption | 3.4 |
| 160419 | Prepared/preserved fish, whole or in pieces | 2.1 |
| 030432 | Fresh/chilled fillets of catfish | 1.4 |
| 160412 | Prepared or preserved herrings, whole or in pieces (excluding minced) | 1.2 |
| Source: Global Trade Tracker, 2020 | ||
| HS6 code | Top products from Spain | 2020 |
|---|---|---|
| 160414 | Prepared/preserved tunas, skipjack and atlantic bonito, whole or in pieces (excluding minced) | 4.9 |
| 030617 | Frozen shrimps and prawns, even smoked, whether in shell or not (excluding cold-water shrimps and prawns) | 1.3 |
| 030616 | Frozen cold-water shrimps and prawns | 1.1 |
| 160554 | Cuttlefish and squid, prepared or preserved (excluding smoked) | 1.0 |
| 030743 | Cuttlefish and squid, frozen, with or without shell | 0.9 |
| Source: Global Trade Tracker, 2020 | ||
| HS6 code | Top products from France | 2020 |
|---|---|---|
| 160529 | Shrimps and prawns, prepared/preserved, in airtight containers (excluding smoked) | 3.4 |
| 160554 | Cuttlefish and squid, prepared or preserved (excluding smoked) | 2.2 |
| 160521 | Prepared/preserved shrimps and prawns, not in airtight containers (excluding smoked) | 1.7 |
| 160414 | Prepared/preserved tunas, skipjack and atlantic bonito, whole or in pieces (excluding minced) | 1.1 |
| 030617 | Frozen shrimps and prawns, even smoked, whether in shell or not (excluding cold-water shrimps and prawns) | 0.9 |
| Source: Global Trade Tracker, 2020 | ||
| Transport type | Value in US$ millions |
|---|---|
| Road transport | 40.1 |
| Maritime transport | 8.5 |
| Air transport | 0.8 |
| Rail transport | 0.1 |
| Unknown transport | 0.1 |
| Total from the world | 49.6 |
| Source: Global Trade Tracker, 2020 | |
Canada's performance
In 2020, Canada was the 34th largest supplier of fish and seafood to Austria. Canada's fish and seafood exports were valued at U$1.6 million (these numbers do not fully account for all the Canadian seafood products transhipment through other EU countries). Fresh, chilled, frozen or dried seaweeds and other algae, frozen fillets of pacific salmon and frozen lobsters were the top three products that Canada exported to Austria. In 2020, the market share of Canadian fish and seafood products was 0.3%.
Canada's direct fish and seafood exports to Austria are very low, however, many Austrian retailers and specialists shops have Canadian fish and seafood in their portfolio, which is often done through importers/distributors in Europe. For example, niche products such as live lobsters, are often bought through an additional importer/distributor in Europe.
| HS6 Code | Description | Value in US$ |
|---|---|---|
| 121229 | Seaweeds and other algae, fresh, chilled, frozen or dried, whether or not ground, unfit for human consumption | 0.4 |
| 030481 | Frozen fillets of pacific salmon | 0.3 |
| 030612 | Frozen lobsters "homarus spp." | 0.2 |
| 030721 | Live, fresh or chilled, scallops | 0.1 |
| 030489 | Frozen fish fillets, nowhere else specified | 0.1 |
| Total from Canada | 1.6 | |
| Source: Global Trade Tracker, 2020 | ||
Retail market
In 2019, the category that recorded the highest retail sales was fresh fish and seafood (sold over the counter), with sales valued at US$431.6 million and a CAGR of 4.5% over the 2015-2019 period. This category was followed by processed (US$288.3 million) and whole cuts (US$223.0 million) chilled raw packaged fish and seafood products. Whole cuts and processed chilled raw packaged fish and seafood were the categories that grew the fastest over the 2015-2019 period with a CAGR of 5.4% and 5.0% respectively, and are forecast to lead the way into 2024.
In terms of volume sales, the three largest categories in 2019 were fresh fish and seafood (counter) at 32.0 Mkg, ambient fish and seafood (9.0 Mkg), and whole cuts chilled raw packaged fish and seafood (7.4Mkg). The latter category grew the most over the 2015-2019 period with a CAGR of 3.1% and is expected to remain the fastest growing category over the 2020-2024 period.
| Category | 2015 | 2019 | CAGR* % 2015-2019 | 2020 | 2024 | CAGR* % 2020-2024 |
|---|---|---|---|---|---|---|
| Ambient fish and seafood | 144.5 | 163.8 | 3.2 | 169.2 | 190.6 | 3.0 |
| Chilled raw packaged fish and seafood - processed | 237.2 | 288.3 | 5.0 | 301.0 | 362.4 | 4.7 |
| Chilled raw packaged fish and seafood - whole cuts | 180.7 | 223.0 | 5.4 | 233.8 | 285.9 | 5.2 |
| Dried fish and seafood | 91.5 | 108.9 | 4.5 | 113.6 | 134.9 | 4.4 |
| Fresh fish and seafood (counter) | 362.6 | 431.6 | 4.5 | 449.8 | 533.3 | 4.4 |
| Frozen fish and seafood | 113.1 | 128.0 | 3.1 | 132.1 | 148.8 | 3.0 |
|
Source: Global Data Intelligence, 2020 *CAGR: Compound Annual Growth Rate |
||||||
| Category | 2015 | 2019 | CAGR* % 2015-2019 | 2020 | 2024 | CAGR* % 2020-2024 |
|---|---|---|---|---|---|---|
| Ambient fish and seafood | 8.4 | 9.0 | 1.6 | 9.1 | 9.5 | 1.1 |
| Chilled raw packaged fish and seafood - processed | 5.6 | 6.3 | 2.8 | 6.4 | 7.2 | 2.8 |
| Chilled raw packaged fish and seafood - whole cuts | 6.6 | 7.4 | 3.1 | 7.7 | 8.7 | 3.1 |
| Dried fish and seafood | 3.9 | 4.3 | 2.5 | 4.4 | 4.8 | 2.4 |
| Fresh fish and seafood (counter) | 29.0 | 32.0 | 2.5 | 32.7 | 35.9 | 2.4 |
| Frozen fish and seafood | 4.4 | 4.7 | 1.6 | 4.8 | 5.0 | 1.1 |
|
Source: Global Data Intelligence, 2020 *CAGR: Compound Annual Growth Rate |
||||||
Processed seafood
In 2020, sales of processed seafood in Austria were valued at US$424.7 million and sales are forecast to reach US$530.8 million in 2025. Between 2016 and 2020, sales of processed seafood in Austria grew by 5.1% and sales are forecast to grow by 4.5% during the 2021-2025 period. Frozen processed seafood lead the way in terms of sales. In 2020, this category recorded sales valued at US$193.4 million. During that year, sales of chilled and shelf stable processed seafood were valued at US$130.4 million and US$100.9 million respectively. Chilled processed seafood is the category that saw the highest growth between 2016 and 2020, and is forecast to lead into 2025 in terms of sales.
| Category | 2016 | 2020 | CAGR* % 2016-2020 | 2021 | 2025 | CAGR* % 2021-2025 |
|---|---|---|---|---|---|---|
| Total - processed seafood | 348.0 | 424.7 | 5.1 | 445.7 | 530.8 | 4.5 |
| Frozen processed seafood | 155.8 | 193.4 | 5.6 | 203.0 | 242.4 | 4.5 |
| Chilled processed seafood | 102.2 | 130.4 | 6.3 | 139.5 | 176.6 | 6.1 |
| Shelf stable seafood | 90.1 | 100.9 | 2.9 | 103.2 | 111.8 | 2.0 |
|
Source: Euromonitor International, 2021 *CAGR: Compound Annual Growth Rate |
||||||
Consumer trends
Despite the country having no direct access to the sea, fish and seafood products are very popular among the population in Austria. There is a growing number of restaurants specialized in international cuisine, notably from Asia and Mediterranean countries (World Wildlife Fund).
Fish and seafood products are growing in popularity among consumers due to the perceived health benefits. Per capita consumption of fish and seafood products was 13,2 kilograms per capita in 2017, (EUMOFA, 2020). Prepared fish meals are becoming a product of choices for many consumers, especially those who do not know how to cook fish. Sustainability, quality and organic foods are very important to consumers and this encourages producers to use certification labels such as the AMA Seal of quality, (only avalailbe for Austian products) or the Certified Sustainable Seafood MSC logo. Fish consumption is higher among the older segment of the Austrian population (55+ years. Among other factors that incite fish consumption are the appearance, the cost, the origin and the quality labels (EUMOFA, 2018) as well as the importance of organic food both in production and consumption.
Foodservice and distribution channels
In 2018, revenues from fish and seafood across various distribution channels in Austria were valued at US$3.1 billion. Combined revenues across all the channels increased by a CAGR of 4.4% over the 2015-2018 period.
The off-trade retail channel was the most important distribution channel for fish and seafood products in Austria. In 2018, distribution through this channel was valued at US$1.3 billion. The outlets of this channel experienced a CAGR of 4.5% during the 2015-2018 period. Hypermarkets and supermarkets were the most important channels, accounting for more than half of the total revenues of the off-trade retail channel, with revenues valued at US$720.4 million, followed by food and drinks specialists (US$320.6 million) and convenience stores (US$195.7 million). Cash and carries and warehouse clubs were the fastest growing outlets with a CAGR of 8.7% from 2015 to 2018, followed by "Dollar stores"/variety stores and general merchandise retailers (9.3%) and convenience stores (5.3%).
In 2018, revenues within the foodservice (profit operators) sector were valued at US$236.8 million. The restaurant outlet led the way with on-trade sales of US$152.4 million, followed by accommodation outlets (US$56.1 million) and on-trade retail outlets (US$10.7 million). All the outlets in this sector grew well. All channels grew by a CAGR of 3.7% between 2015-2018. The fastest growing channels were mobile operators with a CAGR of 4.1% while leisure, retail and workplace outlets all experienced a CAGR of 3.8%.
Outlets from the institutional channel (cost operator) also grew well over the 2015-2018 period, by a CAGR of 3.9%. In 2018, healthcare was the most important outlet with revenues valued at US$8.2 million, followed by educational (US$6.8 million) and welfare and related services (US$1.4 million). Educational institutions were the fastest growing sector of the institutional channel with a CAGR of 4.0%.
| Channel | 2015 | 2016 | 2017 | 2018 | CAGR* % 2015-2018 |
|---|---|---|---|---|---|
| Institutional (cost operator) | 15.6 | 16.3 | 16.9 | 17.6 | 3.9 |
| Education | 6.0 | 6.3 | 6.5 | 6.8 | 4.0 |
| Healthcare | 7.3 | 7.6 | 7.9 | 8.2 | 3.9 |
| Military and civil defence | 1.1 | 1.1 | 1.1 | 1.2 | 3.7 |
| Welfare and services | 1.2 | 1.3 | 1.3 | 1.4 | 3.9 |
| Foodservice (profit operator) | 212.4 | 220.2 | 228.3 | 236.8 | 3.7 |
| Accommodation | 50.3 | 52.1 | 54.1 | 56.1 | 3.7 |
| Leisure | 6.2 | 6.4 | 6.6 | 6.9 | 3.8 |
| Mobile operator | .3 | .3 | .3 | .3 | 4.1 |
| Pub, club and bar | .9 | .9 | .9 | 1.0 | 3.6 |
| Restaurant | 136.8 | 141.8 | 147.0 | 152.4 | 3.7 |
| Retail | 9.6 | 9.9 | 10.3 | 10.7 | 3.8 |
| Travel | 4.1 | 4.3 | 4.4 | 4.6 | 3.7 |
| Workplace | 4.3 | 4.4 | 4.6 | 4.8 | 3.8 |
| Off-trade retail (separate from food service) | 1,129.6 | 1,182.5 | 1,232.0 | 1,290.6 | 4.5 |
| Cash and carries and warehouse clubs | 28.1 | 30.7 | 33.3 | 36.1 | 8.7 |
| Convenience stores | 167.8 | 177.0 | 185.9 | 195.7 | 5.3 |
| Food and drinks specialists | 277.2 | 291.4 | 304.8 | 320.6 | 5.0 |
| Hypermarkets and supermarkets | 636.5 | 666.9 | 691.3 | 720.4 | 4.2 |
| Others | 6.7 | 1.9 | .7 | .4 | −60.4 |
| "Dollar stores", variety stores and general merchandise retailers | 13.3 | 14.6 | 16.0 | 17.4 | 9.3 |
| Total - Fish and seafood by outlet | 2,715.3 | 2,837.9 | 2,954.5 | 3,089.9 | 4.4 |
|
Source: Global Data Intelligence, 2020 *CAGR: Compound Annual Growth Rate |
|||||
Competition
In 2018, Garnelen, which is owned by Elfin Feinkost Gmbh, was the brand with the biggest retail sales in Austria at US$55.6 million with a market share of 4.3%. Friedrich Kaiser Gmbh's brand FriedricHS6 had the second largest sales at US$35.3 million with a market share of 2.7%. Vier Diamanten was the third largest brand in terms of sales with US$25.2 million and a 2.0% market share. Moreover, Princes Limited was the only trademark owner to feature two brands among the top fish and seafood brands in 2018 with Vier Diamanten and Diamanten.
| Trademark owner | Brand | Retail sales ($US million) | Market share % in 2018 | ||
|---|---|---|---|---|---|
| 2016 | 2017 | 2018 | |||
| Appel Feinkost Gmbh | Appel | 9.4 | 9.7 | 10.3 | 0.8 |
| Bolton Group S.p.A. | Rio Mare | 15.1 | 15.7 | 16.4 | 1.3 |
| Elfin Feinkost Gmbh | Garnelen | 50.2 | 52.7 | 55.6 | 4.3 |
| Fisch Feinkost Gmbh | Norda | 12.0 | 12.4 | 13.0 | 1.0 |
| Friedrich Kaiser Gmbh | FriedricHS6 | 31.9 | 33.4 | 35.3 | 2.7 |
| Glatz Gmbh & Co Kg | Delamaris | 1.1 | 1.2 | 1.3 | 0.1 |
| Larsen Danish Seafood Gmbh | Larsen | 13.2 | 13.7 | 14.6 | 1.1 |
| Pinhais and Ca Lda | Nuri | 1.3 | 1.3 | 1.4 | 0.1 |
| Princes Limited | Diamanten | 10.5 | 10.9 | 11.5 | 0.9 |
| Vier Diamanten | 23.0 | 23.9 | 25.2 | 2.0 | |
| Others | Others | 681.0 | 707.5 | 739.1 | 57.3 |
| Private label | Private Label | 333.9 | 349.6 | 366.9 | 28.4 |
| Total - Fish and seafood | 1,182.5 | 1,232.0 | 1,290.6 | 100.0 | |
| Source: Global Data Intelligence, 2020 | |||||
New product launches
Several manufactured products containing fish or seafood were launched in the Austrian market between 2015 and 2019, according to Mintel. The "fish products" category includes fresh, frozen, dried, preserved, smoked, or canned fish, shellfish and seaweed products. The majority of the products during this period were of new variety/range extension launch types.
Ethical considerations are very important when it comes to fish and seafood consumption trends, which explains why the two leading claims of new product launches were "ethical - sustainable" ( 51.7%) and "ethical - environmentally friendly" (50.2%). The top packaging types were skinpack, flexible, tray and carton, whereby most products were available chilled or frozen in supermarkets.
| Attribute | Launch count |
|---|---|
| Top claim | |
| Ethical - sustainable (habitat/resources) | 243 |
| Ethical - environmentally friendly product | 236 |
| Premium | 92 |
| Ease of use | 73 |
| Top package type | |
| Skinpack | 105 |
| Flexible | 104 |
| Tray | 98 |
| Can | 62 |
| Carton | 41 |
| Storage | |
| Chilled | 195 |
| Frozen | 193 |
| Shelf stable | 82 |
| Top launch type | |
| New variety/range extension | 259 |
| New packaging | 91 |
| New product | 89 |
| Relaunch | 26 |
| New formulation | 5 |
| Top companies | |
| Lidl | 51 |
| Iglo | 33 |
| Spar | 32 |
| Hofer | 31 |
| Billa | 26 |
| Top stores | |
| Supermarket | 336 |
| Mass merchandise/hypermarket | 90 |
| Direct selling | 21 |
| Gourmet store | 18 |
| Drug store/pharmacy | 3 |
| Top flavours | |
| Unflavoured/plain | 230 |
| Smoke | 64 |
| Smoke (beechwood) | 12 |
| Cocktail sauce | 8 |
| Garlic | 6 |
| Total sample size | 470 |
| Source: Mintel, 2020 | |
Example of new products
Baked Fish Fingers
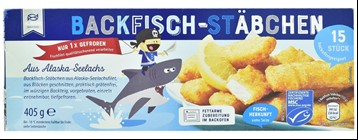
| Company | Hofer |
|---|---|
| Brand | Almare Seafood |
| Category | Processed fish, meat and egg |
| Sub-category | Fish products |
| Market | Austria |
| Manufacturing country | Germany |
| Store name | Hofer |
| Store type | Supermarket |
| Date published | November 2019 |
| Launch type | New variety / range extension |
| Price in US dollars | 2.19 |
The Baked Fish Fingers are a new range of fish products from Almare. These frozen fish fingers packed in a carton that features the Certified Sustainable Seafood MSC logo. This products contains among other things, Alaska pollack fillets, wheat flour, rapeseed oil or potato starch.
Mussels in Garlic Butter
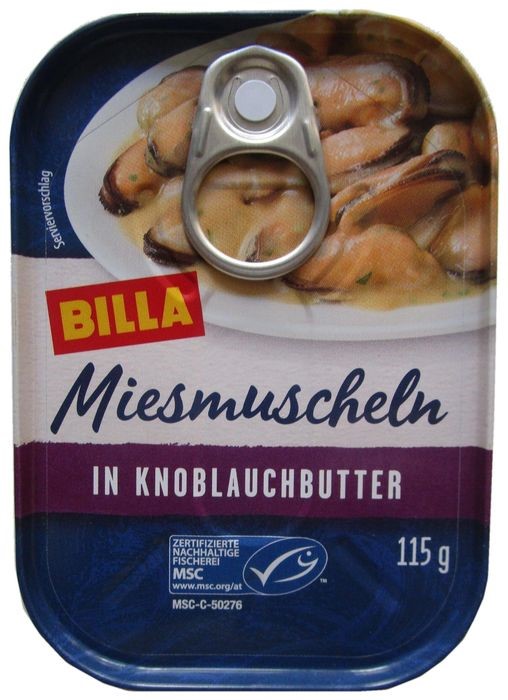
| Company | Billa |
|---|---|
| Brand | Billa |
| Category | Processed fish, meat and egg |
| Sub-category | Fish products |
| Market | Austria |
| Manufacturing country | Austria |
| Store name | Hofer |
| Store type | Supermarket |
| Date published | July 2019 |
| Launch type | New packaging |
| Price in US dollars | 2.80 |
The repackaged Miesmuscheln in Knoblauchbutter (Mussels in Garlic Butter) from Billa is made mussels (Mytilus chilensis), salt parsley and has is flavoured with butter and garlic powder. This product has a Certified Sustainable Seafood MSC logo.
Tuna Carpaccio
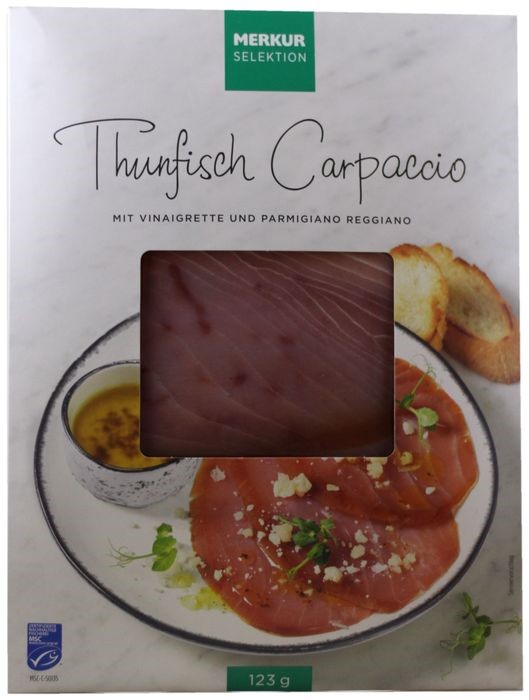
| Company | Merkur Warenhandels |
|---|---|
| Brand | Merkur Selektion |
| Category | Processed fish, meat and egg |
| Sub-category | Fish products |
| Market | Austria |
| Manufacturing country | Poland |
| Store name | Merkur - Ihr Markt |
| Store type | Supermarket |
| Date published | December 2019 |
| Launch type | New variety / range extension |
| Price in US dollars | 4.95 |
Merkur Selektion's Tuna Carpaccio is an new variety of a prodcut. The product is made with smoked tuna, vinaigrette, beechwood smoke falvour and parmigiano reggiano. The skinpack package features the MSC logo.
Conclusion
Although being one of the smallest fish and seafood markets in the European Union in terms of consumption, Austria in seeing a rise in the consumption of seafood products during recent years. Despite the lower consumption, their almost detal dependability on imports still makes Austria an attractive market. Fish products are positively associated with a healthy diet, sustainability and quality plays an important role in consumers' decisions when choosing fish products. Austria imports most of its fish and seafood products because it is a landlocked country. However, the country is trying to promote aquaculture to be more self-sufficient.
Canada has a very good reputation on fish and seafood in Austria. With the implementation of CETA and the elimination of tariffs on most fish and seafood products, Canada's fish producers have more opportunities to exports into the Austrian market, especially taken into account that Canada is well-positioned with many of the fish products that Austria imports such as atlantic salmon, frozen or fillets of pacific salmon. See the guide onNational Treatment and Market Access for Goods to review key provisions of the Agreement, including those related to fish and seafood products.
For more information
The Canadian Trade Commissioner Service:
International Trade Commissioners can provide Canadian industry with on-the-ground expertise regarding market potential, current conditions and local business contacts, and are an excellent point of contact for export advice.
More agri-food market intelligence:
International agri-food market intelligence
Discover global agriculture and food opportunities, the complete library of Global Analysis reports, market trends and forecasts, and information on Canada's free trade agreements.
Agri-food market intelligence service
Canadian agri-food and seafood businesses can take advantage of a customized service of reports and analysis, and join our email subscription service to have the latest reports delivered directly to their inbox.
More on Canada's agriculture and agri-food sectors:
Canada's agriculture sectors
Information on the agriculture industry by sector. Data on international markets. Initiatives to support awareness of the industry in Canada. How the department engages with the industry.
For additional information on Seafood Global Expo, please contact:
Ben Berry, Deputy Director
Trade Show Strategy and Delivery
Agriculture and agri-food Canada
ben.berry@agr.gc.ca
Resources
- Euromonitor International, 2021
- European market observatory for fisheries and aquaculture products. Country Profile: Austria. 2020
- European Union. The EU Fish Market: 2019 Edition. 2019
- Federal Ministry of Agriculture, Forestry, Environment and Water Management. Aquaculture 2020 - Austrian strategy to increase the national fish production. 2012
- Global Data Intelligence, 2020
- Global Trade Tracker, 2021
- GlobeScan. Understanding & Activating Seafood Consumers – Europe. 2018
- Mintel Global New Products Database, 2020
- USDA. Austria – Exporter Guide. 2018
- World Wildlife Fund. Austria: not just for fish Fridays. Date unavailable
- World Wildlife Fund. Fisheries in Austria. Data unavailable
Sector Trend Analysis – Fish and seafood trends in Austria
Global Analysis Report
Prepared by: Saidouba Camara
© Her Majesty the Queen in Right of Canada, represented by the Minister of Agriculture and Agri-Food (2022).
Photo credits
All photographs reproduced in this publication are used by permission of the rights holders.
All images, unless otherwise noted, are copyright Her Majesty the Queen in Right of Canada.
To join our distribution list or to suggest additional report topics or markets, please contact:
Agriculture and Agri-Food Canada, Global Analysis1341 Baseline Rd, Tower 5, 3rd floor
Ottawa ON K1A 0C5
Canada
Email: aafc.mas-sam.aac@agr.gc.ca
The Government of Canada has prepared this report based on primary and secondary sources of information. Although every effort has been made to ensure that the information is accurate, Agriculture and Agri-Food Canada (AAFC) assumes no liability for any actions taken based on the information contained herein.
Reproduction or redistribution of this document, in whole or in part, must include acknowledgement of agriculture and agri-food Canada as the owner of the copyright in the document, through a reference citing AAFC, the title of the document and the year. Where the reproduction or redistribution includes data from this document, it must also include an acknowledgement of the specific data source(s), as noted in this document.
Agriculture and Agri-Food Canada provides this document and other report services to agriculture and food industry clients free of charge.