

Note: This report includes forecasting data that is based on baseline historical data.
Executive summary
China's population of 1.411 billion (2021) is the largest in the world and is expected to decline to 1.406 billion by 2030. The country's urban population is set to increase by 12.6% (2020-2030), to reach a total of 958.9 million, accounting for 68.2% of the country's total population.
Most of the ten largest cities are located in the eastern half of the country, situated on or near the coast. Shanghai is the biggest city with 21.2 million people, followed by Beijing with 18.9 million in 2020.
China as the world's second-largest economy, was the second-largest importer of processed or packaged agri-food and seafood products (US$75.8 billion) in 2020. Last year, Canada was China's ninth-largest supplier (US$3.3 billion), representing an export compound annual growth rate (CAGR) of 19.8% (2016-2020).
In 2020, retail sales of packaged food in China totaled US$284 billion. Top packaged food categories for sales value included dairy, rice, pasta & noodles, and savory snacks. Health and wellness themes are increasingly becoming central to the marketing of packaged food in China.
Growing demand for convenient, easy to cook foods will contribute to the popularity of adopting Western style or novel cuisine diets in China, which better fits with faster paced lives of especially younger urban consumers. E-commerce platforms played a vital role in supporting retailers during lockdown periods, increasing by a percent point (PP) difference of 2.1% (2020/2019).
COVID-19 country impact
After the novel coronavirus that originated in the Chinese city of Wuhan (the capital of Hubei) with cases occurring late in December 2019, there was a strict lockdown in the Hubei province in China from January 23 to April 8, 2020. Albeit, about five billion people left Wuhan mainly for Chinese New Year celebrations before the start of the travel ban on January 23 and the virus rapidly spread to other provinces and ultimately, resulted in lockdowns to varying degrees on a global scale (Statista, 2021).
On March 18, 2020, China reported no new local coronavirus COVID-19 transmissions for the first time after quarantine measures had been implemented (Statista, 2021). Although, new confirmed cases began to drop dramatically and the threat being considered mild, social distancing measures of wearing masks remained in place and borders remained closed, while most businesses reopened. In May, the economy in China had already contracted by 6.8% compared with 2019 and the economic growth outlook was uncertain. Then, with the discovery of new cases linked to the Qingdao Chest Hospital and more asymptomatic cases in Kashgar, Xinjiang later in October, local authorities responded by ordering testing on over 9 million residents. Furthermore, drastic measures were taken by the Chinese Government whom introduced new rules requiring travellers to obtain a blood test for antibodies against the virus, as well as, a nucleic acid test for detecting the virus itself.Footnote 1
Consumer profile
China's population of 1.411 billion (2021) is the largest in the world and is expected to decline to 1.406 billion by 2030, representing a decrease by −0.4% over the next decade. In 2021, 61.5% of China's population resides in urban centers and 38.5% in rural regions. The country's urban population is set to increase by 12.6% from a total of 851.5 million people in 2020 to 958.9 million in 2030, accounting for 68.2% of the country's total population.
In total, China has over 160 cities that have a population of over 1 million people. Cities in China are broken down into tiers that are designated by set criteria, including population size, infrastructure and economic outlook - ranked from Tier I to V. Tier I cities include the centrally-administered municipalities of Shanghai, Beijing, Guangzhou, Tianjin, Chongqing and Shenzhen (new emerging 1st Tier cities since 2017 incl. Dongguan, Chengdu, Nanjing, Wuhan). Tier II cities include larger cities of China including but not limited to Foshan, Guiyang, and Baoding etc. Tier III cities are not as developed but are still considered to be economically significant, and so forth for Tier IV and V cities that define the majority of the country's urban population.Footnote 2
| Rank | Cities | Population ('000) |
|---|---|---|
| 1 | Shanghai | 21,160.0 |
| 2 | Beijing | 18,932.5 |
| 3 | Shenzhen, Guangdong province | 12,339.9 |
| 4 | Guangzhou, Guangdong province | 11,613.7 |
| 5 | Tianjin | 11,325.7 |
| 6 | Dongguan, Guangdong province | 9,387.9 |
| 7 | Nanjing, Jiangsu province | 8,847.4 |
| 8 | Foshan, Guangdong province | 8,376.2 |
| 9 | Wuhan, Hubei province | 8,235.4 |
| 10 | Chengdu, Sichuan province | 7,878.1 |
| 11 | Chongqing | 7,741.9 |
| Total - population | 1,406,350.2 | |
| Source: Euromonitor International, 2021 | ||
Most of the ten largest cities are located in the eastern half of the country, situated on or near the coast. In 2020, Shanghai is the biggest city with 21.2 million people, followed by Beijing with 18.9 million. Consumers in first Tier cities like these have the country's highest disposable incomes, and tend to seek out high quality, premium, and imported products. Cities within Guangdong province - bordering Hong Kong in southern China - have registered the largest in 2020 in terms of total consumer spending (US$589.6 billion) due to its large population and strong economy. In addition, Dongguan historically had the highest population growth at a CAGR of 2.3%, followed by Foshan (2.0%), and Shenzhen (1.8%) between 2016 and 2020. Meanwhile, Shanghai is forecast to continue to decrease at a CAGR of −0.2% (2021-2025).
In 2020, China's middle class (social Class C) represented 112.7 million households (21.6% of total), whereby the middle class population (199.5 million people) has been growing at a CAGR of 0.6%
(2016-2020). Over the same period, the population above the middle-class (Class D) at 346.8 million to upper-class (Class E) at 389.5 million citizens in 2020 has been growing at 5-year CAGRs of 0.8% and 0.7%, respectively. The average Chinese gross income of population, peaking at the age group between 30-34 years - before salary begins to decrease again to an average of US$6,842 (aged 65+) - was US$10,790.2, totalling an average annual disposable income per Chinese household of US$12,073.5 in 2020.
The income inequality gap in China is closing slowly amongst the low-income population (social class A) from a rate of 0.6% (2016-2020) to 0.3% (2021-2025), in line with rises in the minimum wage. In fact, Chinese low-income households (Class A) at 128.4 million people and (Class B) at 104.6 million make up as the country's two smallest social classes in 2020. Combined, it is expected that the population consisting of upper class (D-E) incomes will represent the country's largest social class at 753.8 million people (53.3%), followed by lower social class (A-B) incomes at 238.3 million (16.9%), and middle class C incomes totalling 205.3 million (14.5%) by 2025.
Imports
China as the world's second-largest economy, is the second-largest importer after the United States for value-added processed packaged food and seafood products at a total value of US$75.8 billion and a global market share of 9.6% in 2020. China is a net importer of processed agri-food and seafood products with 2020 exports to the world at US$34.8 billion, representing a trade deficit of Can$41 billion.
China's processed agri-food and seafood imports increased at a CAGR of 17.0% from 2016 to 2020. China's top five imported commodities in 2020 at a total of US$31.5 billion (41.7%) were frozen meat of swine (12.4%), frozen boneless meat of bovine animals (11.9%), infant food preparations - put up for retail sale (6.9%), palm oil and its fractions (5.4%), and other food preparations, nowhere else specified (n.e.s.) (5.1%). Key supplying countries were Brazil, New Zealand, the United States, Australia, and Indonesia.
In 2020, Canada was China's ninth-largest supplier of total processed agri-food and seafood products at a value of US$3.3 billion and a market share of 4.3%; representing an increasing 5-year CAGR in Canadian imports of 19.8% (2016-2020). Top Canadian exports to China at a total of US$2.6 billion (78.1%) were canola oil (25.1%), frozen meat of swine (16.8%), canola meal (14.1%), frozen (bone-in) hams, shoulders and cuts thereof of swine (12.3%), and dog or cat food, put up for retail sale (9.8%) in 2020. Last year (as reported from Canada), Canada registered a processed agri-food and seafood trade surplus of Can$2.4 billion with China.
Retail sales – packaged food
Overall, the COVID-19 pandemic has played a negative impact within the Chinese packaged food market with retail sales in 2020 dipping to its lowest growth of 4.1% (2020/19) compared to previous years at a growth of 5.9% (2019/18) and 6.5% (2018/17). Growth is expected to slowly increase by 4.9% with packaged food sales registering from a total of US$284.0 billion in 2020 to US$298.0 billion in 2021. Restrictions on public movement to limit the spread of the virus effected sales across several packaged food categories, especially since the height of the viral outbreak happened during the Chinese New Year during a peak sales season.
In China, during the 2020 enforced home seclusion periods food segments that showed negative sales growth over the previous year were confectionery (−10.1%), dairy - particularly milk, yoghurt and sour milk products (−2.3%) - and sweet biscuits, snack bars and fruit snacks (−1.4%). At-home food consumption that increased during the height of the outbreak and that boosted sales the most in staple products and food ingredient categories, suitable for home cooking were breakfast cereals (+11.9%), processed meat and seafood (+10.6%), rice, dried pasta and noodles (+10.4%), sauces, dressings and condiments (+11.4%), ready meals (+7.6%), and edible oils (+6.9%).
In particularly, frozen processed meat and seafood products was a notable category that benefitted during lockdown, whereby consumers conveniently added these ingredients into their hotpots; a trend - which struggled in the past to overcome Chinese consumers' strong preference for fresh products. Although, supply of packaged food remained stable in most categories other than imported milk formula, stockpiling on staple foods with a long shelf life like rice, instant noodles and shelf stable processed fruit and vegetables, resulted in bolstered sales in 2020.Footnote 1
| Category | 2016 | 2020 | CAGR* % 2016-2020 | 2021 | 2025 | CAGR* % 2021-2025 |
|---|---|---|---|---|---|---|
| Total - packaged foods | 228,397.9 | 283,984.8 | 5.6 | 298,005.3 | 366,745.1 | 5.3 |
| Staple foods | 75,518.6 | 100,333.7 | 7.4 | 103,946.8 | 132,344.3 | 6.2 |
| Rice, pasta and noodles | 28,391.1 | 36,540.2 | 6.5 | 35,815.1 | 42,912.7 | 4.6 |
| Baked goods | 24,580.6 | 34,090.5 | 8.5 | 38,334.3 | 51,902.3 | 7.9 |
| Processed meat and seafood | 20,333.3 | 26,574.7 | 6.9 | 26,388.1 | 32,941.7 | 5.7 |
| Processed fruit and vegetables | 1,314.1 | 1,748.2 | 7.4 | 1,846.8 | 2,327.2 | 6.0 |
| Breakfast cereals | 899.5 | 1,380.1 | 11.3 | 1,562.6 | 2,260.4 | 9.7 |
| Dairy products and alternatives | 74,653.0 | 88,114.9 | 4.2 | 93,560.0 | 111,786.6 | 4.6 |
| Dairy | 52,757.4 | 59,795.0 | 3.2 | 64,820.1 | 78,706.0 | 5.0 |
| Baby food | 21,895.6 | 28,319.8 | 6.6 | 28,739.9 | 33,080.7 | 3.6 |
| Snacks | 55,209.4 | 65,173.6 | 4.2 | 70,067.5 | 86,680.4 | 5.5 |
| Savory snacks | 26,611.5 | 34,987.8 | 7.1 | 38,064.6 | 50,609.8 | 7.4 |
| Confectionery | 13,843.1 | 13,118.8 | −1.3 | 14,169.5 | 15,803.5 | 2.8 |
| Ice cream and frozen desserts | 7,222.1 | 8,950.4 | 5.5 | 9,440.2 | 10,761.6 | 3.3 |
| Sweet biscuits, snack bars and fruit snacks | 7,532.6 | 8,116.6 | 1.9 | 8,393.2 | 9,505.4 | 3.2 |
| Cooking ingredients and meals | 35,172.4 | 45,016.5 | 6.4 | 44,973.5 | 54,112.7 | 4.7 |
| Sauces, dressings and condiments | 14,737.8 | 20,959.7 | 9.2 | 21,518.3 | 26,716.3 | 5.6 |
| Edible oils | 13,875.9 | 15,908.5 | 3.5 | 15,482.7 | 18,049.6 | 3.9 |
| Ready meals | 5,349.7 | 6,687.8 | 5.7 | 6,455.0 | 7,570.2 | 4.1 |
| Sweet spreads | 1,136.5 | 1,388.8 | 5.1 | 1,448.8 | 1,710.0 | 4.2 |
| Soup | 72.5 | 71.8 | −0.2 | 68.7 | 66.6 | −0.8 |
|
Source: Euromonitor, 2021 *CAGR: Compound Annual Growth Rate |
||||||
In 2020, leading retail companies (and top brands) in the packaged food category in China included Inner Mongolia Yili Industrial Group Company Ltd. (Yili, Ambrosial, Satine) at 6.5% value share, Inner Mongolia China Mengniu Dairy Group Company Ltd. (Mengniu, Deluxe, Just Yoghurt) at 4.9%, and Tingyi (Cayman Islands) Holdings Corporation (Master Kong, Wei Chuan) at 2.1%. Artisanal products represented 8.7% and private label (incl. generic) brands (0.8%) in 2020.
| Company | Brand(s) | Retail sales value (US$ million) | Market share (%) |
|---|---|---|---|
| Inner Mongolia Yili Industrial Group Co. Ltd. | Yili, Ambrosial, Satine, QQ, Changqing, Grain Milk, Chang Yi, Mei Yi Tian, Wei Ke Zi | 18,400.1 | 6.5 |
| Inner Mongolia China Mengniu Dairy Industry (Group) Co. Ltd. | Mengniu, Deluxe, Just Yoghurt, Champion, Yoyi C, Zhen Guo Li, Future Star, Suan Suan Ru, Yashili, Yinqiao | 14,011.6 | 4.9 |
| Tingyi (Cayman Islands) Holdings Corp. [Ting Hsin International Group] | Master Kong, Wei Chuan | 5,968.3 | 2.1 |
| WH Group | Shineway | 4,409.5 | 1.6 |
| Yihai Kerry Oils & Grains (China) Co. Ltd. [China National Cereals, Oils & Foodstuffs Imp & Exp Corp. (COFCO)] | Fortune, Four Seas | 4,232.9 | 1.5 |
| Artisanal | Artisanal | 24,690.2 | 8.7 |
| Private label / generic | Private label / generic | 2,363.7 | 0.8 |
| Others | Others | 122,626.1 | 43.2 |
| Total - market share | 283,984.8 | 100.0 | |
| Source: Euromonitor, 2021 | |||
Dairy products
Retail sales
In 2020, dairy products was the largest packaged food segment at a total retail sales value of US$59.8 billion in China. Although, dairy sales declined by −2.3% over the 2019/2020 period with several categories being hit the hardest - drinking milk products, yoghurt and sour milk - dairy products are set to rebound by 8.4% to reach US$64.8 billion in 2021. Portraying healthy attributes such as immunity-boosting or high protein intake benefits found in certain milk and cheese products, will strengthen post-pandemic sales. A famous doctor, Zhang Wenhong, suggested that people have one cup of milk a day in the morning to maintain health. Alternatively, this focus led to a decline for yoghurt in 2020 (substitution effect), as a result of consumers temporarily turning to milk for protein intake instead of yoghurt. Demand for low sugar, low-fat or fat-free dairy and alternative products are also growing health and wellbeing trends.Footnote 3
| Category | 2016 | 2020 | CAGR* (%) 2016-2020 | 2021 | 2025 | CAGR* (%) 2021-2025 |
|---|---|---|---|---|---|---|
| Total - dairy | 52,757.4 | 59,795.0 | 3.2 | 64,820.1 | 78,706.0 | 5.0 |
| Drinking milk products | 36,496.4 | 36,963.5 | 0.3 | 39,823.4 | 44,726.8 | 2.9 |
| Yoghurt and sour milk products | 15,118.6 | 20,713.9 | 8.2 | 22,498.0 | 29,954.1 | 7.4 |
| Cheese | 616.8 | 1,462.1 | 24.1 | 1,797.6 | 3,160.7 | 15.2 |
| Butter and spreads | 171.6 | 259.7 | 10.9 | 279.8 | 361.4 | 6.6 |
| Other dairy | 354.1 | 395.8 | 2.8 | 421.3 | 503.0 | 4.5 |
|
Source: Euromonitor, 2021 *CAGR: Compound Annual Growth Rate |
||||||
Competitive landscape
In 2020, leading retail companies (and top brands) in the dairy category in China included Inner Mongolia Yili Industrial Group Company Ltd. (Shengmu, Yili, Ambrosial) at 26.4% value share, China Mengniu Dairy Company Ltd. (Mengniu, Deluxe, Just Yoghurt) at 22.2%, and Bright Food (Group) Company Ltd. (Bright, Momchilovtsi, U Best) at 4.0%. Private label dairy products are not prevalent in the Chinese market.
The Inner Mongolia Mengniu Dairy and China Mengniu Dairy Industry are expected to maintain their leading positions in dairy products and alternatives (baby food) since consumer trust and loyalty for quality/healthy products is closely related to the quality of the product and the processing environments offered by big manufacturers. Foodservice of dairy products suffered in 2020, and although accounts for only a small share of sales in dairy, it has been rising - highest in cheese, cream and butter. E-commerce has also gained share in 2020, and sales in the dairy category is expected to accelerate in pace of growth from this channel in the forecast period.Footnote 3
| Company | Brand(s) | Retail sales value (US$ million) | Market share (%) |
|---|---|---|---|
| Subtotal - top five companies | 32,686.1 | 57.8 | |
| Inner Mongolia Yili Industrial Group Co. Ltd. | Shengmu, Yili, Ambrosial, Satine, QQ, Changquing, Grain Milk, Chang Yi, Wei Ke Zi, Mei Yi Tian, Plant Selected, Joy Day | 15,533.4 | 26.4 |
| China Mengniu Dairy Co. Ltd | Mengniu, Deluxe, Just Yoghurt, Champion, yoyi C, Zhen Guo Li, Future Star, Suan Suan Ru | 13,124.7 | 22.2 |
| Bright Food (Group) Co. Ltd. | Bright, Momchilovtsi, U Best, AB 100, Changyou | 2,395.9 | 4.0 |
| Shijiazhuang Junlebao Milk Co. Ltd. | Jun Le Bao, Kefir | 1,632.1 | 2.7 |
| Want Want Holdings Ltd. | Wang Zai | 1,453.5 | 2.5 |
| Others | Others | 9,993.5 | 16.9 |
| Total - market share | 59,157.9 | 100.0 | |
| Source: Euromonitor, 2021 | |||
Rice, pasta and noodles
In 2020, rice, pasta and noodle products was the 2nd largest packaged food segment at a total retail sales value of US$36.5 billion in China. This staple food segment registered bolstered demand during the pandemic as consumers began to cook more at home during lockdown restrictions, which increased by 10.4% from US$33.5 billion in 2019. Rice and noodles play a central role in traditional Chinese cuisine, and furthermore as concerns rose about running out of essential provisions, consumers began to stock up on rice, dried pasta and instant noodles with a long shelf life. Attributable to this fact, this packaged food segment is expected to decrease by −2.0% (2021/2020) and then continue to grow above 2020 values between 2022 and 2025.
Despite the average unit price of rice, pasta and noodles rising by 4% in current terms - all categories increased in sales in 2020. Dried pasta was the most dynamic category in 2020, with year-on-year (y-o-y) growth of 23.8%. Instant and plain noodles were a popular category as well, with instant pouches and plain noodles performing the best, since its products tend to be more affordable in such unstable and trying times.Footnote 4
As in most categories, the health and wellness (HW) trend is a key influence on demand of rice, pasta and noodles into the forecast period. Plain noodles with low carb and naturally high fibre offerings are set to appeal to the health-conscious consumer. Product ranges that manufacturers are increasingly introducing to target the HW demand include products made from buckwheat, corn, rye or even stronger palate ingredients such as spinach, pumpkin and purple sweet potato. The reduction in the consumption of meat, to meet flexitarian diets are also, being explored to a certain degree. Moreover, population growth is slowing, which will act as a further constraint on growth in the popular Chinese rice market. Chinese consumers are increasingly gaining a growing interest in alternative Western or novel cuisine diets, in particularly in offerings that addresses weight management (reduction in carbohydrate or salt) and/or other fortified wellbeing benefits such as enhancing intestinal movements, and lowering blood sugar and cholesterol.Footnote 4
| Category | 2016 | 2020 | CAGR* (%) 2016-2020 | 2021 | 2025 | CAGR* (%) 2021-2025 |
|---|---|---|---|---|---|---|
| Total - rice, pasta and noodles | 28,391.1 | 36,540.2 | 6.5 | 35,815.1 | 42,912.7 | 4.6 |
| Noodles | 18,831.5 | 24,818.6 | 7.1 | 24,116.4 | 29,461.2 | 5.1 |
| Instant noodles | 12,397.7 | 15,119.2 | 5.1 | 14,552.1 | 16,661.2 | 3.4 |
| Instant noodle cups | 4,754.5 | 6,070.2 | 6.3 | 5,880.6 | 6,724.1 | 3.4 |
| Instant noodle pouches | 7,643.3 | 9,049.0 | 4.3 | 8,671.5 | 9,937.0 | 3.5 |
| Plain noodles | 6,433.8 | 9,699.4 | 10.8 | 9,564.3 | 12,800.0 | 7.6 |
| Rice | 9,498.5 | 11,603.0 | 5.1 | 11,572.4 | 13,231.2 | 3.4 |
| Dried pasta | 61.1 | 118.5 | 18.0 | 126.3 | 220.3 | 14.9 |
|
Source: Euromonitor, 2021 *CAGR: Compound Annual Growth Rate |
||||||
Competitive landscape
In 2020, leading retail companies (and brand) in the rice, pasta and noodles category in China included Ting Hsin International Group (Master Kong) at 15.1% value share, Wilmar International Ltd. (Arawana) at 6.2%, and Uni-President Enterprises Corporation (Uni-President) at 5.1%.
Tingyi (Cayman Islands) Holdings Corporation remained the largest player in rice, pasta and noodles, strengthening its leading position during 2020 with its quick response in its production and supply, also using online channels to promote new and existing products. The company additionally offered videos on new ways to cook and eat their noodle products.
Although, demand for more complete home cooked meals increased during lockdown, consumers in China set to return to hectic lifestyles are increasingly demanding convenient, easy-to-prepare (self-heating) products. During 2020, river snail noodle products that contained sachets with a variety of sauces and condiments available in one pouch were notably popular, including emerging brand - La Mian Shuo.Footnote 4
| Company | Brand | Retail sales value (US$ million) | Market share (%) |
|---|---|---|---|
| Subtotal - top five companies | 13,168.1 | 36.0% | |
| Ting Hsin International Group [Tingyi (Cayman Islands) Holdings Corp.] | Master Kong | 5,504.7 | 15.1 |
| Wilmar International Ltd. | Arawana | 2,263.9 | 6.2 |
| Uni-President Enterprises Corporation | Uni-President | 1,877.1 | 5.1 |
| China National Cereals, Oils and Foodstuffs Import and Export Corporation (COFCO) | Fortune | 1,828.9 | 5.0 |
| Jinmailang Food Co. Ltd. | Jinmailang | 1,693.5 | 4.6 |
| Others | Others | 17,732.1 | 48.5 |
| Total - market share | 36,540.2 | 100.0 | |
| Source: Euromonitor, 2021 | |||
Savory snacks
In 2020, savory snack products in China was the 3rd largest packaged food segment at a total retail sales value of US$35.0 billion. Over the pandemic, all savory snacks registered growth - nuts, seeds and trail mixes having the highest growth of 8.6% (2020/2019) - where total sales are set to post a fixed CAGR of 7.4% between 2021 and 2025. Despite the average unit price rising by 4% in current retail value terms, sales of savory snacks rose 9% and 5% in retail volume terms, to reach US$38.1 billion and 4.9 million tonnes, respectively in 2021.
Spicy gluten flavors growing in the other savory snack category has led to greater consumer interest. However, regulations surrounding the quality of spicy gluten, implemented at the end of January 2020, forced policy changes and efforts from players in order to reduce its associated high-levels in salt, oil, sugar, and the addition of preservatives or other additives. Other targeted trends include improving the HW and nutritional claims in children's snacks, as well as, the addition of probiotics and other gut health and even immunity modifications into trail mixes - which is beginning to slow down in growth for its healthy positioning.Footnote 5
| Category | 2016 | 2020 | CAGR* (%) 2016-2020 | 2021 | 2025 | CAGR* (%) 2021-2025 |
|---|---|---|---|---|---|---|
| Total - savory snacks | 26,611.5 | 34,987.8 | 7.1 | 38,064.6 | 50,609.8 | 7.4 |
| Subtotal - salty snacks | 6,325.1 | 7,404.6 | 4.0 | 7,757.0 | 9,233.2 | 4.5 |
| Puffed snacks | 2,615.7 | 3,054.3 | 4.0 | 3,216.8 | 3,826.3 | 4.4 |
| Potato chips | 2,048.1 | 2,476.9 | 4.9 | 2,616.3 | 3,145.0 | 4.7 |
| Rice snacks | 1,661.3 | 1,873.4 | 3.0 | 1,923.9 | 2,261.9 | 4.1 |
| Nuts, seeds and trail mixes | 3,636.7 | 4,835.1 | 7.4 | 5,249.2 | 6,905.7 | 7.1 |
| Savory biscuits | 1,814.6 | 1,959.8 | 1.9 | 2,048.1 | 2,439.9 | 4.5 |
| Popcorn | 16.6 | 20.0 | 4.8 | 21.2 | 25.7 | 4.9 |
|
Other savory snacks |
14,818.5 | 20,768.4 | 8.8 | 22,989.1 | 32,005.3 | 8.6 |
|
Source: Euromonitor, 2021 *CAGR: Compound Annual Growth Rate |
||||||
Competitive landscape
In 2020, leading retail companies (and brands) in the savory snack category in China included PepsiCo Inc. (Lay's, Be & Cheery, Cheetos) at 5.1% value share, Want Want Holdings Ltd. (Want Want) at 3.6%, and Anhui Three Squirrels Electronic Commerce Company Ltd. (Three Squirrels) at 3.3%. Generic (0.4%) and private label (0.1%) savory snack products held a total market value share of 0.5% in 2020.
Food safety has come under the spotlight much attributable to the COVID-19 outbreak, whereby consumers were hesitant in trying new brands and instead purchased well-known brands, products trusted for quality. In 2020, Lay's gained share over other competitors, while emphasizing through a documentary video on how their potato chips go through strict quality control measures in terms of selection, processing, and delivery of its products from farm to consumers. Lay's maintains its dominance in the category by frequently introducing new innovative product launches, including the development of savory chips with a sweet milk tea flavor together with machi machi, along with light snacking chips made with taro.
Three Squirrels, who has recently and quickly grew to a holistic snacks company covering a large variety of snack, meat and baked goods segments, suffers from shrinking profit and supply chain management issues. Thus, the company of whom ambitiously wanted to enter into new markets (incl. ready meals, baby food, pet care and wedding business) has decided to strategically simplify its portfolio and focus on its most profitable nut-based snacks segment.
| Company | Brand(s) | Retail sales value (US$ million) | Market share (%) |
|---|---|---|---|
| Subtotal - top five companies | 5,170.7 | 15.0 | |
| PepsiCo Inc. | Lay's, Be & Cheery, Cheetos | 1,729.9 | 5.1 |
| Want Want Holdings Ltd. | Want Want | 1,232.1 | 3.6 |
| Anhui Three Squirrels Electronic Commerce Co. Ltd. | Three Squirrels | 1,135.3 | 3.3 |
| Luohe Pingping Food Co. Ltd. | Weilong | 835.9 | 2.4 |
| Hefei Huatai Food Co. Ltd. | Qia Qia | 767.6 | 2.2 |
| Generics | Generics | 122.8 | 0.4 |
| Private label | Private label | 34.5 | 0.1 |
| Others | Others | 23,575.3 | 68.1 |
| Total - market share | 34,615.1 | 100.0 | |
| Source: Euromonitor, 2021 | |||
Distribution channels – packaged food
In general, packaged food sales during the pandemic gained share amongst those leading players with strong brand recognition, extensive distribution channels with mature production processes, and a stable supply. Manufacturers have increased their focus towards online activity, to both boost sales and market their products as store-based sales were hit with restrictions. E-commerce represented 11.8% of packaged food retail sales in China in 2020. The largest packaged food player in China, Inner Mongolia Yili Industrial Group Co. Ltd. added e-commerce discounts, along with introducing video broadcasts to engage consumers and address health-related issues. This company also, partnered with WeChat to sell products through its available digital channels including messaging, social media and mobile payment app.Footnote 1
With the strictest lockdown in China lasting for around a month (or two in Hubei), during which time the range of products were limited to only daily necessities, store-based retailing (88.1% market share) has gained slight traction in small community supermarkets (37.4%), and in quick shopping convenience stores (4.1%) in 2020. E-commerce platforms played a vital role in supporting retailers during lockdown periods, like Tmall, whom launched policies such as exempting half a year's service fee and offering low-interest loans. Meanwhile, hypermarkets and supermarkets partnered closely with food delivery platforms such as Meituan.com and Ele.me.
In 2020, while consumption began to gradually resume later in the third and the fourth quarter of the year, as most bars and restaurants reopened, retail began to recover more quickly than the foodservice industry. Cooking ingredients and staple products in meals were the key categories in retail sales, while snacks and confectionery, categories that rely on foodservice or out-of-home consumption, did not fare well during lockdown periods. Albeit, tea shops are proving to be amongst the quickest foodservice segment to recover - benefitting most from the fact that Chinese consumers' demand for milk tea remains high, with the product being hard to replicate at home.
According to the National Bureau of Statistics, foodservice revenue registered a year-on-year decline of 43% from January-February in comparison to fall by a 21% contraction seen in total retail sales over the same period in 2020. However, as fears regarding the risk of viral transmission through social contact subsides, both retail and foodservice channels are expected to see a full recovery in 2021.Footnote 1
| Outlet type | Market share % in 2019 | Market share % in 2020 | Percent Point* change 2019-2020 |
|---|---|---|---|
| Store-based retailing - grand total: | 90.3 | 88.1 | −2.2 |
| Total - grocery retailers | 84.6 | 82.6 | −2.0 |
| Subtotal - modern grocery retailers | 59.0 | 58.7 | −0.3 |
| Supermarkets | 37.3 | 37.4 | 0.1 |
| Hypermarkets | 16.2 | 15.8 | −0.4 |
| Convenience stores | 3.9 | 4.1 | 0.2 |
| Forecourt retailers | 1.5 | 1.3 | −0.2 |
| Discounters | 0.1 | 0.1 | 0.0 |
| Subtotal - traditional grocery retailers | 25.6 | 23.9 | −1.7 |
| Independent small grocers | 13.3 | 12.7 | −0.6 |
| Food/drink/tobacco specialists | 7.8 | 7.4 | −0.4 |
| Other grocery retailers | 4.5 | 3.9 | −0.6 |
| Total - non-grocery specialists | 5.7 | 5.5 | −0.2 |
| Health and beauty specialist retailers | 0.3 | 0.3 | 0.0 |
| Other foods of non-grocery specialists | 5.4 | 5.2 | −0.2 |
| Total - mixed retailers | 0.0 | 0.0 | 0.0 |
| Non-store retailing - grand total: | 9.7 | 11.9 | 2.2 |
| E-commerce | 9.7 | 11.8 | 2.1 |
| Total - distribution channels | 100.0 | 100.0 | 100.0 |
|
Source: Euromonitor, 2021 *Percent Point change: difference between 2020 and 2019 values |
|||
Product launch and trend analysis
Mintel indicated that there were 12,374 packaged food products launched (including new variety/range extension, packaging, formulation or relaunched) in China between the period of January 2016 and October 25th, 2021.
Top parent companies launching package food products in China from Q4-2020 to Q4-2021 were the Bright Food Group (55), Nestlé (47), Mars (47), Mondelez International (40), Inner Mongolia Yili Industrial Group (40), and Unilever (34). New packaged food brands launched recently in the Chinese market (2021) include Jin Xin Yi Guo Chu (beef flavored small bread slices), Glico Pocky Xian Qiao (aromatic Matcha flavored biscuit sticks with reduced sugar), O'Say Shi Ke Qing Huo (Hawthorn strip with reduced sugar), and Nepean River Jiu Mu Qing Cao Yi Tou Niu (mango flavored 'Clever Love' yogurt).
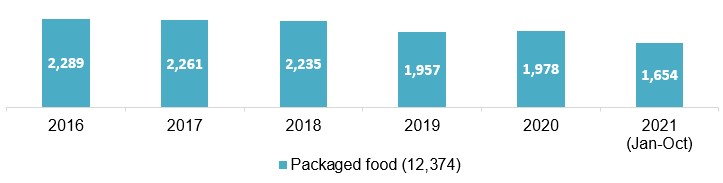
Description of above image
| Year | Packaged food (12,374) |
|---|---|
| 2016 | 2,289 |
| 2017 | 2,261 |
| 2018 | 2,235 |
| 2019 | 1,957 |
| 2020 | 1,978 |
| 2021 (January to October) | 1,654 |
Source: Mintel, 2021
In China, the fastest growing flavours in these packaged food products were meat (+500%), chicken (+333.3%), Greengage plum (+300%), crab (+300%), dark/black chocolate (+200%), and garlic (+200%) [Q4-2019 / Q4-2019]. New or popular ingredients included numbing hot seasoning, coconut milk syrup, condensed milk flavor, Acerola juice concentrate, Ostericum Sieboldii, Yuzu, Cumin flavor, and Japonica rice flour. HW and other functional related or leading trend claims within these packaged food products included microwaveable (6.0%), convenient packaging (5.2%), high/added fibre (3.8%), high/added protein (3.6%), vitamin/mineral fortified (3.3%), functional digestive (3.1%), children [5-12] (3.1%), no additives/ preservatives (3.1%), probiotic (2.6%), on-the-go (2.6%), ease of use (2.4%), added calcium (2.4%), low/no/reduced fat (2.4%), sugar-free (2.1%), economy (2.1%), babies and toddlers [0-4] (1.9%), low/reduced sugar (1.7%), wholegrain (1.7%), functional - other (1.7%), and organic (1.3%) of total. Amongst these products, top growing claims included low/no/reduced calorie (+600%), sugar free (+200%), and gluten free (+100%); while declining claims at −100% included dairy free, vegetarian, low/no/reduced cholesterol, hormone free and functional - skin, nails and hair.
In the Chinese market, snacks was the largest packaged food category with 3,444 (27.8%) new product launches, followed by dairy at 2,174 (17.6%), and bakery at 2,159 (17.4%) products over the approximately 6-year period. Growing categories included sauces and seasonings (+84.6%), chocolate confectionery (+50%), meals and meal centers (+25%), bakery (+21.6%), and snacks (+6.3%); while top declining categories included baby food (−69.6%), desserts and ice cream (−49%), processed fish, meat and egg products (−25%), sugar and gum confectionery (−23.1%), and dairy (−16.8%) between Q4-2020 and Q4-2021.
| Category | Top 50 brands launched (product item count) | Number of products |
|---|---|---|
| Snacks | Qia Qia (88), Lay's (73), Great Value (61), Kam Yuen/Ganyuan (60), Be & Cheery (42), Huaweiheng.Amiho Liang Xuan 100 (42), Oishi (38), Kemi Xiaozi (33), Pringles (27), Triumph Lium/Liuliu Orchard Lium (27), Wanchai Ferry (25), Yuyu (24), Run Zhi Jia (23), Synear (23), Want Want (20), Sanquan/San Quan (17), Fine Food/Fine Life (12), Member's Mark (10), Panpan (4), Four Seas (3), Bai Le Fen/Bestfun (1) | 3,444 |
| Dairy | Mengniu / Mönmilk Chun Zhen/Future Star (110), Weiquan/Wei Chuan (66), Milkana (46), Yili Mei Yi Tian (41), Sanyuan (40), Weidendorf (36), Terun (36), Yili (27), Meiji (5), Member's Mark (5), Want Want (3), Daliyuan (2), Fine Food/Fine Life (2), Panpan (1), Four Seas (1) | 2,174 |
| Bakery | Glivo Pejoy/Pocky (88), Oreo (74), Daliyuan (39), Panpan (38), Bai Le Fen/Bestfun (34), Chips Ahoy! (27), Huamei (25), Orion Pie (25), Hsu Fu Chi (23), Great Value (14), Be and Cheery (8), Run Zhi Jia (8), Sanquan / San Quan (6), Four Seas (4), Member's Mark (4), Want Want (2), Yili (1), Meiji (1) | 2,159 |
| Sauces and seasonings | Haday/Haitian (48), McCormick (30), Great Value (15), Run Zhi Jia (3), Fine Food/Fine Life (3), Heinz (2), Yuyu (2) | 825 |
| Sugar and gum confectionery | Wrigley's Extra (40), Skittles (24), Yili (17), Hsu Fu Chi (16), Oishi (4), Bai Le Fen/ Bestfun (3), Run Zhi Jia (3), Fine Food/Fine Life (1), Want Want (1), Member's Mark (1) | 727 |
| Baby food | Heinz (27), Yili (9), Mengniu / Mönmilk (2) | 653 |
| Processed fish, meat and egg products | Four Seas (28), Fine Food/Fine Life (5), Member's Mark (3), Great Value (1) | 571 |
| Chocolate confectionery | Dove (44), Hershey's Kisses (43), M&M's (34), Hershey's (27), Meiji (10), Oreo (2), Hsu Fu Chi (2), Great Value (1) | 491 |
| Desserts and ice cream | Meiji (11), Wanchai Ferry (5), Bright (4), Be & Cheery (3), Sanquan/San Quan (3), Want Want (2), Synear (2), Oreo (1), Yili (1), Mengniu/Mönmilk (1), Run Zhi Jia (1), Hershey's (1) | 381 |
| Breakfast cereals | Great Value (1), Run Zhi Jia (1) | 269 |
| Total sample size | 12,374 | |
| Source: Mintel, 2021 | ||
Product examples
Peanut, Jujube and Goji Berry Flavored Compound Protein Drink

Source: Mintel, 2021
| Company | Inner Mongolia Mengniu Dairy Group |
|---|---|
| Brand | Mengniu / Mönmilk Zhen Yang |
| Sub-category | Dairy / flavored milk |
| Country | China, not imported |
| Related claims | High / added protein |
| Store name / type | Yue Xi Ke Lai, Qing Dao, supermarket |
| Launch type | New product |
| Date published | April 2021 |
| Price in US dollars | 6.87 |
This protein drink is said to be made with selected nourishing ingredients including mellow and aromatic ground roasted peanut. This product is claimed to be nutritious and delicious.
Shaanxi Style Spicy Noodles with Chilli Oil

Source: Mintel, 2021
| Company | Shang Gu Tang Food Development |
|---|---|
| Manufacturer | Jin Da Hui Food |
| Brand | Liang Gong Fang |
| Sub-category | Meals and meal centers / instant noodles |
| Country | Manufactured in China, not imported |
| Related claims | Convenient packaging |
| Store name / type | Ole, Guangzhou, supermarket |
| Launch type | New product |
| Date published | November 2020 |
| Price in US dollars | 7.56 |
This product is said to be made using imported ground Australian wheat, duck egg white and flour, and processed according to a double-layer compound pressing technique. The Shaanxi style instant noodles are claimed to be chewy, spicy and refreshing, and can be quickly prepared in three minutes. This product contains tender freeze-dried green vegetables, chilli oil sauce, refreshing chilli oil and sour vinegar, and retails in a 492 gram resealable pack containing four 80 gram units of noodles and four 43 gram seasoning sachets, and bearing cooking instructions.
Arrowroot and Konjac Meal Replacement Porridge
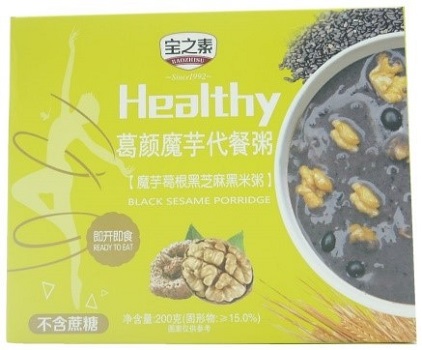
Source: Mintel, 2021
| Company | Baozhisu |
|---|---|
| Manufacturer | Luzon food |
| Sub-category | Meals and meal centers / prepared meals |
| Market | Manufactured in China, not imported |
| Related claims | Microwaveable, ease of use, sugar free |
| Store name / type | Jiuguang, Shanghai, department store |
| Launch type | New product |
| Date published | April 2018 |
| Price in US dollars | 2.35 |
This product contains konjac, arrowroot, black sesame and black rice. This healthy, tasty and ready to eat porridge is microwaveable and said to be tasty and free from cane sugar.
Daily Nuts

Source: Mintel, 2021
| Company | Zhen Wai Fang Food |
|---|---|
| Brand | Chao Xing Xuan Huan Qiu Zhen Wei |
| Sub-category | Snacks / snack mixes |
| Country | Manufactured in China, not imported |
| Related claims | Convenient packaging |
| Store name / type | JD, internet / mail order |
| Launch type | New product |
| Date published | February 2020 |
| Price in US dollars | 14.17 |
This snack mix comprises almond kernels, cashew kernels, dried blackcurrants, dried cranberries, walnut kernels, hazelnut kernels, and dried blueberries. This product is suitable for serving with congee as breakfast or milk.
Mixed Colourful Beans

Source: Mintel, 2021
| Company | Three Squirrels – Mei Ri Jian Guo |
|---|---|
| Manufacturer | Qiang Lei Food |
| Sub-category | Snacks / snack mixes |
| Market | Manufactured in China, not imported |
| Related claims | On-the-go, convenient packaging |
| Store name / type | JD, internet/mail order |
| Launch type | New product |
| Date published | October 2017 |
| Price in US dollars | 3.02 |
These mixed colourful beans are made using light production processing and said to be healthy.
For more information
The Canadian Trade Commissioner Service:
International Trade Commissioners can provide Canadian industry with on-the-ground expertise regarding market potential, current conditions and local business contacts, and are an excellent point of contact for export advice.
More agri-food market intelligence:
International agri-food market intelligence
Discover global agriculture and food opportunities, the complete library of Global Analysis reports, market trends and forecasts, and information on Canada's free trade agreements.
Agri-food market intelligence service
Canadian agri-food and seafood businesses can take advantage of a customized service of reports and analysis, and join our email subscription service to have the latest reports delivered directly to their inbox.
More on Canada's agriculture and agri-food sectors:
Canada's agriculture sectors
Information on the agriculture industry by sector. Data on international markets. Initiatives to support awareness of the industry in Canada. How the department engages with the industry.
Resources
- Euromonitor International database, 2021
- Euromonitor International. December 2020. Country report: Packaged Food in China
- Euromonitor International. December 2020. Country Report: Rice, Pasta and Noodles in China
- Euromonitor International. September 2021. Country Report: Dairy Products and Alternatives in China
- Global Trade Tracker, 2021
- Mintel Global New Products Database, 2021
- World Population Review, 2021. Population of Cities in China (2021)
Sector Trend Analysis – Packaged food trends in China
Global Analysis Report
Prepared by: Erin-Ann Chauvin, Senior Market Analyst
© Her Majesty the Queen in Right of Canada, represented by the Minister of Agriculture and Agri-Food (2022).
Photo credits
All photographs reproduced in this publication are used by permission of the rights holders.
All images, unless otherwise noted, are copyright Her Majesty the Queen in Right of Canada.
To join our distribution list or to suggest additional report topics or markets, please contact:
Agriculture and Agri-Food Canada, Global Analysis1341 Baseline Rd, Tower 5, 3rd floor
Ottawa ON K1A 0C5
Canada
Email: aafc.mas-sam.aac@agr.gc.ca
The Government of Canada has prepared this report based on primary and secondary sources of information. Although every effort has been made to ensure that the information is accurate, Agriculture and Agri-Food Canada (AAFC) assumes no liability for any actions taken based on the information contained herein.
Reproduction or redistribution of this document, in whole or in part, must include acknowledgement of agriculture and agri-food Canada as the owner of the copyright in the document, through a reference citing AAFC, the title of the document and the year. Where the reproduction or redistribution includes data from this document, it must also include an acknowledgement of the specific data source(s), as noted in this document.
Agriculture and Agri-Food Canada provides this document and other report services to agriculture and food industry clients free of charge.