

Note: This report includes forecasting data that is based on baseline historical data.
Executive summary
In 2021, retail sales of cooking oils in South Korea were valued at US$478.7 million. From 2017 to 2021, sales of cooking oils in the country grew at a compound annual growth rate (CAGR) of 2.6%. Sales of cooking oil are forecast to grow by 1.0% from 2022 to 2026, reaching US$522.3 billion in 2026.
In 2021, CJ Corp, was the biggest player in the cooking oil market in South Korea. The company's sales of edible oils were valued at US$183.6 million, representing a market share of 38.4% in 2021. The company's sales grew by a CAGR of 4.5% from 2017 to 2021, it also increased market share by a CAGR of 1.8% during the same period.
In 2021, Beksul and Ottogi were the two largest cooking oils brand in South Korea with sales valued at US$155.7 million (market share of 32.5%) and US$63.7 million (market share of 13.3%), respectively.
In 2021, sales of cooking oils through non-store retailing were valued US$77.6 million, representing a market share of 16.2%. From 2017 to 2021, sales through this category increased by a CAGR of 16.5% from 2017 to 2021, spearheaded by the increasing importance of e-commerce.
From 2017 to 2020, South Korea's imports of vegetable oils increased by a CAGR of 16.1%. In 2021, Canada was South Korea's fourth largest supplier of vegetable oils. South Korea's imports of Canadian vegetable oils were valued at US$204.2 million. From 2017 to 2021, imports of Canadian vegetable oils increased by a CAGR of 16.5%. In 2021, canola oil was the leading cooking oil commodity imported from Canada, accounting for more than 99.2% of all Canadian vegetable oils imported in South Korea.
Retail market
In 2021, retail sales of cooking oils in South Korea were valued at US$478.7 million. Demand for cooking oils remains high due to stronger home consumption amidst the prolonged pandemic period (Euromonitor International, 2021). From 2017 to 2021, sales of cooking oils in the country grew at a CAGR of 2.6%. Sales of cooking oil are forecast to grow by 1.0% from 2022 to 2026, reaching US$522.3 billion in 2026. Other edible oil was the leading category, with sales valued at US$186.7 million in 2021. Sales of other edible oils are forecast to reach US$195.4 million by 2026. Rapeseed oil was the third leading category in terms of sales in 2021, which were US$91.1 million, from US$130.5 million in 2017, a decrease of 8.6% during this period. Sales of rapeseed oil are forecast to reach US$95.1 million by 2026. In the past five years, sales of olive oil recorded the highest growth, with a CAGR of 17.4%.Sales of olive oil is forecast to grow at a CAGR of 4.9% from 2022 to 2026, reaching US$ 110.4 million in 2026.
| Category | 2017 | 2021 | CAGR* % 2017-2021 | 2022 | 2026 | CAGR* % 2022-2026 |
|---|---|---|---|---|---|---|
| Total cooking oils | 431.4 | 478.7 | 2.6 | 502.0 | 522.3 | 1.0 |
| Soy oil | 82.2 | 93.2 | 3.2 | 97.2 | 96.0 | −0.3 |
| Rapeseed oil | 130.5 | 91.1 | −8.6 | 90.8 | 95.1 | 1.2 |
| Olive oil | 43.3 | 82.2 | 17.4 | 91.0 | 110.4 | 4.9 |
| Corn oil | 12.6 | 15.5 | 5.3 | 16.2 | 15.7 | −0.8 |
| Sunflower oil | 9.6 | 10.0 | 1.0 | 9.8 | 9.6 | −0.5 |
| Other edible oil* | 153.2 | 186.7 | 5.1 | 197.0 | 195.4 | −0.2 |
|
Source: Euromonitor International, 2022 *CAGR: Compound Annual Growth Rate Other edible oil includes vegetable and seed oil such as coconut oil, grapeseed oil, groundnut oil, sesame oil and walnut oil, as well as blended oils which contain less than 50% of any single type of oils broken down into the researched oil categories |
||||||
Company landscape
In 2021, CJ Corp, was the biggest player in the cooking oil market in South Korea. The company's sales of edible oils were valued at US$183.6 million, representing a market share of 38.4% in 2021. The company's sales grew by a CAGR of 4.5% from 2017 to 2021, it also increased market share by a CAGR of 1.8% during the same period.
Sajohaepyo Corp was the second leading category in terms of sales in 2021 with US$83.6 million, representing a market share of 17.5%. From 2017 to 2021, the company's sales and market share of cooking oils increased at a CAGR of 3.0% and 0.3% respectively.
Ottogi Foods Co Ltd was the third-largest company in the cooking oils market in South Korea in 2021, with retail sales estimated at US$69.5 million, representing a 14.5% market share. From 2017 to 2021, the company's sales of cooking oil declined by a CAGR of 3.4%.
| Company name | 2017 | 2018 | 2019 | 2020 | 2021 | CAGR* % 2017-2021 |
|---|---|---|---|---|---|---|
| CJ Corp | 153.8 | 157.6 | 148.6 | 162.0 | 183.6 | 4.5 |
| Sajohaepyo Corp | 74.4 | 71.9 | 67.8 | 74.1 | 83.6 | 3.0 |
| Ottogi Foods Co Ltd | 79.7 | 80.6 | 65.0 | 64.7 | 69.5 | −3.4 |
| Daesang Corp | 34.8 | 34.1 | 27.6 | 25.5 | 27.1 | −6.1 |
| Dongwon Group | 20.3 | 19.5 | 16.6 | 15.6 | 16.2 | −5.5 |
| Borges International Group SL | 1.7 | 1.8 | 2.0 | 3.0 | 4.0 | 23.9 |
| Deoleo SA | 0.4 | 0.4 | 0.5 | 0.3 | 0.2 | −15.9 |
| Others | 66.3 | 66.7 | 71.4 | 81.4 | 94.6 | 9.3 |
| Total | 431.4 | 432.7 | 399.4 | 426.6 | 478.7 | 2.6 |
|
Source: Euromonitor International, 2022 *CAGR: Compound Annual Growth Rate |
||||||
| Company name | 2017 | 2018 | 2019 | 2020 | 2021 | CAGR* % 2017-2021 |
|---|---|---|---|---|---|---|
| CJ Corp | 35.7 | 36.4 | 37.2 | 38.0 | 38.4 | 1.8 |
| Sajohaepyo Corp | 17.3 | 16.6 | 17.0 | 17.4 | 17.5 | 0.3 |
| Ottogi Foods Co Ltd | 18.5 | 18.6 | 16.3 | 15.2 | 14.5 | −5.9 |
| Daesang Corp | 8.1 | 7.9 | 6.9 | 6.0 | 5.7 | −8.4 |
| Dongwon Group | 4.7 | 4.5 | 4.1 | 3.7 | 3.4 | −7.8 |
| Borges International Group SL | 0.4 | 0.4 | 0.5 | 0.7 | 0.8 | 18.9 |
| Deoleo SA | 0.1 | 0.1 | 0.1 | 0.1 | 0.0 | −100.0 |
| Others | 15.4 | 15.4 | 17.9 | 19.1 | 19.8 | 6.5 |
|
Source: Euromonitor International, 2022 *CAGR: Compound Annual Growth Rate |
||||||
Brand landscape
In 2021, Beksul and Ottogi were the two largest cooking oils brand in South Korea with sales valued at US$155.7 million (market share of 32.5%) and US$63.7 million (market share of 13.3%), respectively. Haepyo was the third-largest brand in terms of sales in 2021 with US$52.9 million, representing a market share of 11.1%.
From 2017 to 2021, sales of Beksul increased by 3.3% and the brand experienced a market gain of 0.5% during this period. Sales of Ottogi cooking oils decreased by 1.5% during this period, and the company saw a market loss of 4.1%. On the other hand, sales of Haepyo cooking oils increased by 4.2% and the brand experience a market growth of 1.6% between 2017 and 2021.
| Company Name | 2017 | 2018 | 2019 | 2020 | 2021 | CAGR* % 2017-2021 |
|---|---|---|---|---|---|---|
| Beksul (CJ Corp) | 137.0 | 140.8 | 126.9 | 137.8 | 155.7 | 3.3 |
| Ottogi (Ottogi Foods Co Ltd) | 67.8 | 69.7 | 57.8 | 58.7 | 63.7 | −1.5 |
| Haepyo (Sajohaepyo Corp) | 44.9 | 44.6 | 43.1 | 47.0 | 52.9 | 4.2 |
| Dongwon (Dongwon Group) | 20.3 | 19.5 | 16.6 | 15.6 | 16.2 | −5.5 |
| Chungjungone (Daesang Corp) | 6.5 | 6.8 | 6.3 | 6.9 | 8.1 | 5.7 |
| Borges (Borges International Group SL) | 1.7 | 1.8 | 2.0 | 3.0 | 4.0 | 23.9 |
| Carapelli (Deoleo SA) | 0.4 | 0.4 | 0.4 | 0.3 | 0.2 | −15.9 |
| Others | 152.8 | 149.0 | 146.4 | 157.3 | 177.9 | 3.9 |
|
Source: Euromonitor International, 2022 *CAGR: Compound Annual Growth Rate |
||||||
| Brand | 2017 | 2018 | 2019 | 2020 | 2021 | CAGR* % 2017-2021 |
|---|---|---|---|---|---|---|
| Beksul (CJ Corp) | 31.8 | 32.5 | 31.8 | 32.3 | l32.5 | 0.5 |
| Ottogi (Ottogi Foods Co Ltd) | 15.7 | 16.1 | 14.5 | 13.8 | 13.3 | −4.1 |
| Haepyo (Sajohaepyo Corp) | 10.4 | 10.3 | 10.8 | 11.0 | 11.1 | 1.6 |
| Dongwon (Dongwon Group) | 4.7 | 4.5 | 4.1 | 3.7 | 3.4 | −7.8 |
| Chungjungone (Daesang Corp) | 1.5 | 1.6 | 1.6 | 1.6 | 1.7 | 3.2 |
| Borges (Borges International Group SL) | 0.4 | 0.4 | 0.5 | 0.7 | 0.8 | 18.9 |
| Carapelli (Deoleo SA) | 0.1 | 0.1 | 0.1 | 0.1 | 0.0 | −100.0 |
| Others | 35.4 | 34.4 | 36.6 | 36.9 | 37.2 | 1.2 |
|
Source: Euromonitor International, 2022 *CAGR: Compound Annual Growth Rate |
||||||
Distribution channel
The overwhelming majority of cooking oils were sold though store-based retailing. In 2021, sales through store-based retailing were valued at US$401.2 million, representing a market share of 83.8%. Within this category, grocery retailers were leading in terms of sales, with US$391.6 million, representing a market share of 81.3% of total cooking oil sales, followed by mixed retailers with sales valued at US$9.6 million (market share of 2.0%).
In 2021, sales of cooking oils through non-store retailing were valued US$77.6 million, representing a market share of 16.2%. From 2017 to 2021, sales through this category increased by a CAGR of 16.5% from 2017 to 2021, spearheaded by the increasing importance of e-commerce.
| Outlet Type | 2017 | 2018 | 2019 | 2020 | 2021 | CAGR* % 2017-2021 |
|---|---|---|---|---|---|---|
| Store-based retailing | 393.4 | 391.8 | 354.8 | 361.2 | 401.2 | 0.5 |
| Grocery retailers | 390.0 | 387.7 | 350.8 | 353.9 | 391.6 | 0.1 |
| Modern grocery retailers | 369.0 | 367.9 | 333.4 | 330.6 | 363.1 | −0.4 |
| Convenience stores | 16.1 | 16.6 | 17.2 | 20.9 | 25.4 | 12.1 |
| Hypermarkets | 252.1 | 248.6 | 220.5 | 203.9 | 220.2 | −3.3 |
| Supermarkets | 100.8 | 102.7 | 95.7 | 105.8 | 117.5 | 3.9 |
| Traditional grocery retailers | 21.0 | 19.8 | 17.4 | 23.3 | 28.5 | 7.9 |
| Independent small grocers | 20.3 | 19.1 | 16.8 | 22.6 | 27.8 | 8.2 |
| Other grocery retailers | 0.7 | 0.7 | 0.7 | 0.7 | 0.8 | 3.4 |
| Mixed retailers | 3.4 | 4.1 | 3.9 | 7.3 | 9.6 | 29.6 |
| Non-store retailing | 38.0 | 40.9 | 44.7 | 65.4 | 77.6 | 19.5 |
| E-Commerce | 38.0 | 40.9 | 44.7 | 65.4 | 77.6 | 19.5 |
|
Source: Euromonitor International, 2022 *CAGR: Compound Annual Growth Rate |
||||||
| Outlet | 2017 | 2018 | 2019 | 2020 | 2021 | CAGR* % 2017-2021 |
|---|---|---|---|---|---|---|
| Store-based retailing | 91.2 | 90.5 | 88.8 | 84.7 | 83.8 | −2.1 |
| Grocery retailers | 90.4 | 89.6 | 87.8 | 83.0 | 81.8 | −2.5 |
| Modern grocery retailers | 85.5 | 85.0 | 83.5 | 77.5 | 75.8 | −3.0 |
| Convenience stores | 3.7 | 3.8 | 4.3 | 4.9 | 5.3 | 9.4 |
| Hypermarkets | 58.4 | 57.4 | 55.2 | 47.8 | 46.0 | −5.8 |
| Supermarkets | 23.4 | 23.7 | 24.0 | 24.8 | 24.5 | 1.2 |
| Traditional grocery retailers | 4.9 | 4.6 | 4.4 | 5.5 | 6.0 | 5.2 |
| Independent small grocers | 4.7 | 4.4 | 4.2 | 5.3 | 5.8 | 5.4 |
| Other grocery retailers | 0.2 | 0.2 | 0.2 | 0.2 | 0.2 | 0.0 |
| Mixed retailers | 0.8 | 0.9 | 1.0 | 1.7 | 2.0 | 25.7 |
| Non-store retailing | 8.8 | 9.5 | 11.2 | 15.3 | 16.2 | 16.5 |
| E-Commerce | 8.8 | 9.5 | 11.2 | 15.3 | 16.2 | 16.5 |
|
Source: Euromonitor International, 2022 *CAGR: Compound Annual Growth Rate |
||||||
Trade overview
In 2021, South Korea was a net importer of cooking oils, its imports valued at US$1.9 billion while its exports were valued at US$35.6 million. In 2021, palm oil and its fractions were leading in terms of imports values with US$661.6 million, representing 34.9% of total vegetable oils imports in the country. From 2017 to 2020, South Korea's imports of vegetable oils increased by a CAGR of 16.1%. Among South Korea's cooking oil commodities, sunflower-seed, safflower or cotton-seed oil is the commodity that recorded the highest growth between 2017 and 2021 with a CAGR of 21.6%, while groundnut oil and its fractions recorded the largest decline with a CAGR of 2.3%.
| HS code | Description | 2017 | 2018 | 2019 | 2020 | 2021 | CAGR* % 2017-2021 |
|---|---|---|---|---|---|---|---|
| 1511 | Palm oil | 359.7 | 388.3 | 348.7 | 404.4 | 661.6 | 16.5 |
| 1507 | Soya-bean oil | 266.9 | 239.8 | 263.4 | 312.3 | 575.3 | 21.2 |
| 1514 | Rape, colza or mustard oil | 118.6 | 108.1 | 123.7 | 113.9 | 226.6 | 17.6 |
| 1515 | Fixed vegetable fats and oils, including jojoba oil | 96.4 | 93.6 | 102.8 | 107.2 | 135.2 | 8.8 |
| 1513 | Coconut "copra", palm kernel or babassu oil | 96.5 | 89.1 | 58.6 | 61.6 | 109.2 | 3.2 |
| 1509 | Olive oil | 65.8 | 74.6 | 66.9 | 79.1 | 107.0 | 12.9 |
| 1512 | Sunflower-seed, safflower or cotton-seed oil | 31.0 | 35.9 | 43.2 | 47.2 | 67.9 | 21.6 |
| 1510 | Other oils | 5.9 | 8.5 | 7.5 | 6.5 | 10.7 | 16.2 |
| 1508 | Groundnut oil | 0.1 | 0.2 | 0.2 | 0.2 | 0.1 | −2.3 |
| Total | 1,040.9 | 1,038.1 | 1,015.0 | 1,132.6 | 1,893.6 | 16.1 | |
|
Source: Global Trade Tracker, 2022 1: for the purpose of this report, Global Trade Tracker's use of "vegetable oil products" was defined using the following HS codes: 1507-1515, inclusively. *CAGR: Compound Annual Growth Rate |
|||||||
In 2021, Indonesia was South Korea's largest supplier of vegetable oils. Imports from Indonesia were valued at US$427.6 million, followed by Malaysia with imports valued at US302.2 million, and the United States with imports valued at US$265.7 million. Among South Korea's top 10 suppliers of vegetable oils, Philippines recorded the largest growth between 2017 and 2021 with a CAGR of 139.4%, followed by Ukraine (CAGR of 60.4%) and Vietnam (CAGR of 33.7%). In 2021, Canada was South Korea fourth largest supplier of vegetable oils with imports valued at US$204.2 million.
| Country | 2017 | 2018 | 2019 | 2020 | 2021 | CAGR* % 2017-2021 |
|---|---|---|---|---|---|---|
| Indonesia | 247.8 | 299.8 | 222.4 | 221.6 | 427.6 | 14.6 |
| Malaysia | 203.3 | 172.8 | 163.9 | 220.8 | 302.2 | 10.4 |
| United States | 155.4 | 201.1 | 238.3 | 290.1 | 265.7 | 14.4 |
| Canada | 110.7 | 105.0 | 111.4 | 97.2 | 204.2 | 16.5 |
| Argentina | 87.9 | 16.3 | 15.8 | 9.2 | 203.7 | 23.4 |
| Spain | 77.3 | 80.7 | 76.9 | 87.8 | 111.3 | 9.6 |
| Vietnam | 26.0 | 24.1 | 4.9 | 9.5 | 83.1 | 33.7 |
| Italy | 26.3 | 31.0 | 30.7 | 31.9 | 46.0 | 15.0 |
| Philippines | 1.1 | 0.7 | 6.3 | 18.4 | 36.0 | 139.4 |
| Ukraine | 5.3 | 7.4 | 12.8 | 18.5 | 34.9 | 60.4 |
| Total - imports from the world | 1,040.9 | 1,038.1 | 1,015.0 | 1,132.6 | 1,893.6 | 16.1 |
|
Source: Global Trade Tracker, 2022 1: for the purpose of this report, Global Trade Tracker's use of "vegetable oil products" was defined using the following HS codes: 1507-1515, inclusively. *CAGR: Compound Annual Growth Rate |
||||||
Canadian performance
In 2021, Canada was South Korea's fourth largest supplier of vegetable oils. South Korea's imports of Canadian vegetable oils were valued at US$204.2 million. From 2017 to 2021, imports of Canadian vegetable oils increased by a CAGR of 16.5%. In 2021, canola oil was the leading cooking oil commodity imported from Canada, accounting for more than 99.2% of all Canadian vegetable oils imported in South Korea. Imports of Canadian canola oil were valued at $US202.6 million in 2021, followed by fixed vegetables fats and oils, with imports valued at US$1.5 million. Imports of Canadian canola oil grew by a CAGR of 18.0% between 2017 and 2021, while imports of fixed vegetable fats and oils increased by 7.0%.
| HS code | Description | 2017 | 2018 | 2019 | 2020 | 2021 | CAGR* % 2017-2021 |
|---|---|---|---|---|---|---|---|
| 1514 | Rape, colza or mustard oil | 104,639,209 | 96,739,169 | 110,956,508 | 96,803,378 | 202,648,691 | 18.0 |
| 1515 | Fixed vegetable fats and oils, including jojoba oil | 1,140,976 | 714,638 | 417,171 | 394,839 | 1,493,719 | 7.0 |
| 1512 | Sunflower-seed, safflower or cotton-seed oil | 1,019 | 4,999 | 32,693 | 42,483 | 69,060 | 186.9 |
| 1509 | Olive oil | 505 | 964 | 3,049 | 2,852 | 17,659 | 143.2 |
| 1510 | Other oils | 772 | 1,474 | 1,597 | 2,640 | 2,344 | 32.0 |
| 1513 | Coconut "copra", palm kernel or babassu oil | 132 | 7,916 | 5,323 | 111 | 130 | −0.4 |
| 1511 | Palm oil | 0 | 11 | 11 | 0 | 0 | |
| 1507 | Soya-bean oil | 4,936,738 | 7,537,497 | 0 | 0 | 0 | |
| Total | 110,719,351 | 105,006,668 | 111,416,352 | 97,246,303 | 204,231,603 | 16.5 | |
|
Source: Global Trade Tracker, 2022 1: for the purpose of this report, Global Trade Tracker's use of "vegetable oil products" was defined using the following HS codes: 1507-1515, inclusively. *CAGR: Compound Annual Growth Rate |
|||||||
New product launches
According to Mintel's global new products database (GNPD), there were 471 new cooking oil products launched in South Korea from 2017 to 2021. In 2021, the top five claims of cooking oils offered were organic, premium, kosher ethical - environmentally friendly package, and ethical - recycling. The top brands were Beksul, Queensbucket, Olitalia, Only Price and Fratelli Mantova Sprayleggero Interestingly, the majority of new cooking oil products were launched through Internet/mail order with 50 in 2021 launches, followed by department store with 9 products launched.
| Product attributes | Yearly launch counts | ||||
|---|---|---|---|---|---|
| 2017 | 2018 | 2019 | 2020 | 2021 | |
| Yearly product launches | 81 | 75 | 118 | 117 | 80 |
| Top five store types | |||||
| Internet/mail order | 4 | 13 | 35 | 71 | 50 |
| Department store | 15 | 27 | 23 | 21 | 9 |
| Supermarket | 23 | 9 | 35 | 12 | 7 |
| Mass merchandise / hypermarket | 33 | 18 | 16 | 11 | 0 |
| Natural/health food store | 6 | 5 | 6 | 1 | 3 |
| Top five brands | |||||
| Beksul | 3 | 3 | 4 | 4 | 3 |
| Queensbucket | 2 | 0 | 7 | 2 | 1 |
| Olitalia | 2 | 2 | 0 | 3 | 3 |
| Only Price | 5 | 0 | 4 | 0 | 0 |
| Fratelli Mantova Sprayleggero | 0 | 0 | 4 | 5 | 0 |
| Top launch types | |||||
| New product | 49 | 45 | 65 | 64 | 48 |
| New variety / range extension | 17 | 21 | 29 | 41 | 18 |
| New packaging | 9 | 8 | 21 | 10 | 12 |
| Relaunch | 6 | 1 | 3 | 2 | 2 |
| Top five claims | |||||
| Organic | 16 | 11 | 16 | 14 | 17 |
| Premium | 5 | 9 | 24 | 21 | 6 |
| Kosher | 4 | 4 | 13 | 15 | 17 |
| Ethical - environmentally friendly package | 8 | 5 | 7 | 11 | 8 |
| Ethical - recycling | 8 | 5 | 7 | 11 | 7 |
| Top five ingredients | |||||
| Extra virgin olive oil | 5 | 6 | 16 | 29 | 21 |
| Olive oil | 4 | 5 | 15 | 24 | 19 |
| Sesame seed | 15 | 12 | 16 | 12 | 11 |
| Avocado oil | 6 | 9 | 13 | 7 | 6 |
| Perilla seed | 11 | 10 | 12 | 5 | 3 |
| Price in US dollars (Group) | |||||
| 4.87-8.86 | 23 | 18 | 40 | 35 | 11 |
| 8.87-12.86 | 18 | 20 | 29 | 29 | 23 |
| 12.87-16.86 | 17 | 17 | 17 | 20 | 19 |
| 16.87-23.00 | 10 | 11 | 10 | 18 | 12 |
| 0.87-4.86 | 12 | 4 | 19 | 12 | 3 |
| Source: Mintel, 2022 | |||||
Examples of new products
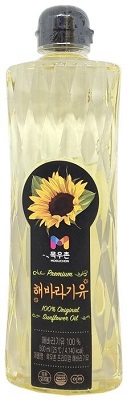
Premium Sunflower Oil
Source: Mintel, 2022
| Company | Moguchon |
|---|---|
| Manufacturer | B&B Korea |
| Brand | Moguchon |
| Category | Oils |
| Store name | Naver |
| Store type | Internet / mail order |
| Date published | February 2022 |
| Launch type | New product |
| Price in local currency | KRW5300.00 |
| Price in US dollars | 4.42 |
Moguchon Premium Sunflower Oil is now available. The product comprises 100% original sunflower oil, is suitable for all types of cooking, and retails in a 500 millilitre pack bearing the HACCP logo.
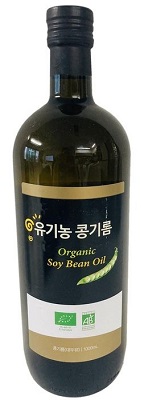
Organic Soy Bean Oil
Source: Mintel, 2022
| Company | Jules Brochenin |
|---|---|
| Manufacturer | Jules Brochenin |
| Brand | Jules Brochenin |
| Category | Oils |
| Store name | www.kurly.com |
| Store type | Internet / mail order |
| Date published | July 2021 |
| Launch type | New variety / range extension |
| Price in local currency | KRW9900.00 |
| Price in US dollars | 8.65 |
Jules Brochenin Organic Soy Bean Oil is now available. This product is made with 100% organic soy and retails in a 1000 millilitre pack bearing the EU Organic logo and the AB - Agriculture Biologique (Organic Agriculture) label.
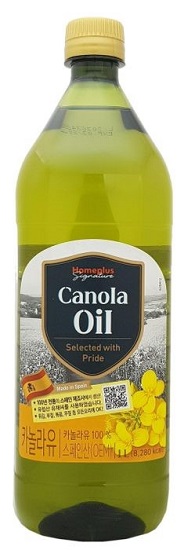
Canola Oil
Source: Mintel, 2022
| Company | Home Plus |
|---|---|
| Manufacturer | Borges Agricultural & Industrial Edible Oils |
| Brand | Homeplus Signature |
| Category | Oils |
| Location of manufacture | Spain |
| Import status | Imported product |
| Store name | www.homeplus.co.kr |
| Store type | Internet / mail order |
| Date published | December 2020 |
| Launch type | New variety / range extension |
| Price in local currency | KRW3490.00 |
| Price in US dollars | 3.22 |
Homeplus Signature Canola Oil contains 100% Spanish canola oil. It can be used to fry, stir-fry, roast and dress, and retails in a 1 litre pack bearing a QR code.
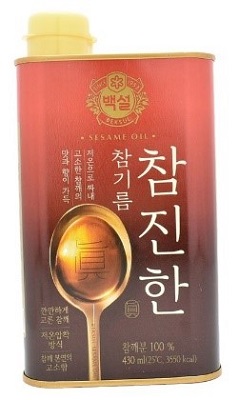
Sesame Oil
Source: Mintel, 2022
| Company | CJ CheilJedang |
|---|---|
| Manufacturer | CJ CheilJedang |
| Brand | Beksul Chamjinhan |
| Category | Oils |
| Store name | Lotte Mart |
| Store type | Supermarket |
| Date published | July 2019 |
| Launch type | New product |
| Price in local currency | KRW9900.00 |
| Price in US dollars | 8.55 |
Beksul Chamjinhan Sesame Oil is made with 100% cold pressed sesame powder to offer the natural rich flavour of sesame. The product retails in a 430 millilitre bottle bearing the HACCP logo.
Hemp Seed Oil
Source: Mintel, 2022
| Company | Nothern Nutraceuticals |
|---|---|
| Manufacturer | Nothern Nutraceuticals |
| Brand | NorthemEdge |
| Category | Oils |
| Location of manufacture | Canada |
| Import status | Imported product |
| Store name | Shinsegae Department Store |
| Store type | Department store |
| Date published | January 2018 |
| Launch type | New product |
| Price in local currency | KRW9980.00 |
| Price in US dollars | 9.27 |
NorthemEdge Hemp Seed Oil is said to be a premium oil from Canada made from hemp grown in the heart of the Canadian prairies. The product can be easily added to salad dressings, pasta, vegetables, smoothies, soups and sauces, and retails in a 250 millilitre pack.
For more information
The Canadian Trade Commissioner Service:
International Trade Commissioners can provide Canadian industry with on-the-ground expertise regarding market potential, current conditions and local business contacts, and are an excellent point of contact for export advice.
More agri-food market intelligence:
International agri-food market intelligence
Discover global agriculture and food opportunities, the complete library of Global Analysis reports, market trends and forecasts, and information on Canada's free trade agreements.
Agri-food market intelligence service
Canadian agri-food and seafood businesses can take advantage of a customized service of reports and analysis, and join our email subscription service to have the latest reports delivered directly to their inbox.
More on Canada's agriculture and agri-food sectors:
Canada's agriculture sectors
Information on the agriculture industry by sector. Data on international markets. Initiatives to support awareness of the industry in Canada. How the department engages with the industry.
For additional information on Seoul Food & Hotel 2022, please contact:
Ben Berry, Deputy Director
Trade Show Strategy and Delivery
Agriculture and agri-food Canada
ben.berry@agr.gc.ca
Resources
- Global Trade Tracker, 2022
- Euromonitor International, December 2021, Edible oils in South Korea
- Euromonitor International, 2022
- Mintel Global New Products Database, 2022
Sector Trend Analysis – Vegetable oil trends in South Korea
Global Analysis Report
Prepared by: Zhiduo, Wang, Market Analyst
© Her Majesty the Queen in Right of Canada, represented by the Minister of Agriculture and Agri-Food (2022).
Photo credits
All photographs reproduced in this publication are used by permission of the rights holders.
All images, unless otherwise noted, are copyright Her Majesty the Queen in Right of Canada.
To join our distribution list or to suggest additional report topics or markets, please contact:
Agriculture and Agri-Food Canada, Global Analysis1341 Baseline Rd, Tower 5, 3rd floor
Ottawa ON K1A 0C5
Canada
Email: aafc.mas-sam.aac@agr.gc.ca
The Government of Canada has prepared this report based on primary and secondary sources of information. Although every effort has been made to ensure that the information is accurate, Agriculture and Agri-Food Canada (AAFC) assumes no liability for any actions taken based on the information contained herein.
Reproduction or redistribution of this document, in whole or in part, must include acknowledgement of agriculture and agri-food Canada as the owner of the copyright in the document, through a reference citing AAFC, the title of the document and the year. Where the reproduction or redistribution includes data from this document, it must also include an acknowledgement of the specific data source(s), as noted in this document.
Agriculture and Agri-Food Canada provides this document and other report services to agriculture and food industry clients free of charge.