

Note: This report includes forecasting data that is based on baseline historical data.
Executive summary
The United States (US) is a net importer of fish and fish products, importing US$30.2 billion in 2021. In the same year, total US's exports of fish and fish products were worth US$5.8 billion.
The US was the largest fish and seafood import market in the world (18.1% market shares). The US imports grew at a Compound Annual Growth Rate (CAGR) of 7.1% from 2017 to 2021.
Canada ranked as the 14th largest import market from the world and had a market share of 2.2% in 2021. The top three countries were the U.S., China, and Japan, accounting for a combined total of 37.4% of the global market share (value) in 2021.
In terms of value, from 2017 to 2021, Canada and Indian were the top suppliers of fish and seafood to the US with a market share of 16.8% and 11.1%, respectively. Canada was the largest supplier with US$5.0 billion, at a CAGR of 10.9% from 2017 to 2021.
In terms of volume, from 2017 to 2021, China and India were the top suppliers of fish and seafood to the US, growing at a CAGR of −8.3% and 12.1%, respectively (market share of 12.3% and 11.2% in 2021). Canada was the 3rd largest supplier with 348.5 thousand tonnes, at a market share of 10.7%. The US's imports from Canada increased by 0.6% from 2017 to 2021.
In 2021, the top two Canadian fish and seafood exports to US were frozen crabs and frozen lobsters. Total fish and seafood exports to US increased at a CAGR of 10.5% from 2017 to 2021, reaching $4,950 millions in 2021.
While seafood alternatives have not typically commanded as much consumer attention, they have experienced substantial growth in 2020 and 2021. Consumers are increasingly expressing interest in seafood alternatives for health and environmental reasons.
From 2017 to 2021, there are 944 new fish and seafood product lauches in the United States.
Trade overview and Canadian performance
The United States is a net importer of fish and fish products, importing US$30.2 billion in 2021. In the same year, total US's exports of fish and fish products were worth US$5.8 billion.
The US was the largest fish and seafood import market in the world (18.1% market shares). The US imports grew at CAGR of 7.1% from 2017 to 2021.
Canada ranked as the 14th largest import market from the world and had a market share of 2.2% in 2021. The top three countries were the U.S., China, and Japan, accounting for a combined total of 37.4% of the global market share (value) in 2021.
| Country | 2017 | 2018 | 2019 | 2020 | 2021 | CAGR* % 2017-2021 | Market share (%) in 2021 |
|---|---|---|---|---|---|---|---|
| Reporter's Total | 146.8 | 158.8 | 158.9 | 148.7 | 166.3 | 3.2 | 100.0 |
| United States | 23.0 | 24.0 | 23.5 | 23.0 | 30.2 | 7.1 | 18.1 |
| China | 11.1 | 14.7 | 18.4 | 15.3 | 17.8 | 12.4 | 10.7 |
| Japan | 15.4 | 15.8 | 15.6 | 13.6 | 14.3 | −1.9 | 8.6 |
| Spain | 8.1 | 8.7 | 8.2 | 7.4 | 8.9 | 2.4 | 5.3 |
| France | 6.9 | 7.2 | 6.8 | 6.5 | 7.9 | 3.3 | 4.7 |
| Italy | 6.6 | 7.1 | 6.7 | 6.2 | 6.8 | −2.4 | 4.1 |
| South Korea | 5.2 | 6.1 | 5.7 | 5.5 | 6.0 | 3.8 | 3.6 |
| Germany | 5.9 | 6.2 | 6.0 | 6.1 | 5.9 | −0.03 | 3.5 |
| Sweden | 5.0 | 5.6 | 5.3 | 5.1 | 5.5 | 2.9 | 3.3 |
| Netherlands | 4.3 | 4.5 | 4.5 | 4.6 | 5.0 | 3.6 | 3.0 |
| Canada (14TH) | 3.0 | 3.1 | 3.3 | 3.0 | 3.7 | 5.2 | 2.2 |
|
Source: Global Trade Tracker, 2022 *CAGR: Compound Annual Growth Rate |
|||||||
In terms of value, from 2017 to 2021, Canada and Indian were the top suppliers of fish and seafood to the US with a market share of 16.8% and 11.1%, respectively. Canada was the largest supplier with US$5.0 billion, at a CAGR of 10.9% from 2017 to 2021.
| Country | 2017 | 2018 | 2019 | 2020 | 2021 | CAGR* % 2017-2021 | Market share (%) in 2021 |
|---|---|---|---|---|---|---|---|
| World | 22.6 | 23.6 | 23.1 | 22.0 | 29.7 | 7.1 | 100.0 |
| Canada | 3.3 | 3.3 | 3.5 | 3.1 | 5.0 | 10.9 | 16.8 |
| India | 2.4 | 2.4 | 2.8 | 2.5 | 3.3 | 8.3 | 11.1 |
| Chile | 2.1 | 2.3 | 2.4 | 2.4 | 3.1 | 10.2 | 10.4 |
| Indonesia | 1.9 | 2.0 | 1.9 | 2.2 | 2.6 | 8.2 | 8.8 |
| Viet-Nam | 1.4 | 1.6 | 1.3 | 1.4 | 2.0 | 9.3 | 6.7 |
| China | 2.8 | 3.0 | 2.0 | 1.7 | 1.9 | −9.2 | 6.4 |
| Ecuador | 0.8 | 0.8 | 0.8 | 1.1 | 1.7 | 20.7 | 5.7 |
| Norway | 0.9 | 1.0 | 1.0 | 0.9 | 1.3 | 9.6 | 4.4 |
| Thailand | 1.5 | 1.3 | 1.3 | 1.4 | 1.2 | −5.4 | 4.0 |
| Russia | 0.5 | 0.6 | 0.7 | 0.9 | 1.2 | 24.5 | 4.0 |
|
Source: Global Trade Tracker, 2022 *CAGR: Compound Annual Growth Rate |
|||||||
In terms of volume, from 2017 to 2021, China and India were the top suppliers of fish and seafood to the US, growing at a CAGR of −8.3%% and 12.1%, respectively (market share of 12.3% and 11.2% in 2021). Canada was the 3rd largest supplier with 348.5 thousand tonnes, at a market share of 10.7%. The US's imports from Canada increased by 0.6% from 2017 to 2021.
| Country | 2017 | 2018 | 2019 | 2020 | 2021 | CAGR* % 2017-2021 | Market share (%) in 2021 |
|---|---|---|---|---|---|---|---|
| World | 2,820.2 | 2,901.3 | 2,825.7 | 2,907.4 | 3,267.5 | 3.7 | 100 |
| China | 566.8 | 589.2 | 436.2 | 412.4 | 400.3 | −8.3 | 12.3 |
| India | 232.5 | 269.2 | 319.9 | 288.5 | 366.6 | 12.1 | 11.2 |
| Canada | 340.2 | 307.9 | 309.4 | 293.5 | 348.5 | 0.6 | 10.7 |
| Chile | 201.5 | 219.9 | 231.4 | 268.7 | 282.3 | 8.8 | 8.6 |
| Viet-Nam | 228.2 | 236.8 | 206.0 | 226.3 | 278.7 | 5.1 | 8.5 |
| Indonesia | 185.6 | 199.8 | 208.9 | 231.8 | 254.4 | 8.2 | 7.8 |
| Ecuador | 112.7 | 121.8 | 127.5 | 168.2 | 227.2 | 19.1 | 7.0 |
| Thailand | 199.6 | 183.7 | 190.9 | 222.6 | 182.8 | −2.2 | 5.6 |
| Mexico | 94.8 | 93.9 | 95.2 | 103.4 | 111.6 | 4.2 | 3.4 |
| Norway | 92.0 | 96.7 | 97.4 | 92.9 | 110.6 | 4.7 | 3.4 |
|
Source: Global Trade Tracker, 2022 *CAGR: Compound Annual Growth Rate |
|||||||
Frozen shrimps and prawns and fresh or chilled fillets of pacific salmon were the top two products that US imported from the world. These two products grew at a CAGR of 5.2% and 12.0%, respectively from 2017 to 2021.
| HS code | Description | 2017 | 2018 | 2019 | 2020 | 2021 | CAGR* % 2017-2021 |
|---|---|---|---|---|---|---|---|
| Total - imports | 22,967.0 | 23,988.6 | 23,519.6 | 22,,976.8 | 30,176.4 | 7.1 | |
| 030617 | Frozen shrimps and prawns, even smoked, whether in shell or not | 5,182.9 | 4,845.8 | 4,813.8 | 4,872.5 | 6,357.5 | 5.2 |
| 030441 | Fresh or chilled fillets of pacific salmon | 1,775.3 | 2,038.0 | 2,104.8 | 2,094.4 | 2,796.4 | 12.0 |
| 030614 | Frozen crabs, even smoked, whether in shell or not | 1.204.7 | 1,230.0 | 1,461.5 | 1,673.7 | 2,729.1 | 22.7 |
| 160521 | Shrimps and prawns, prepared or preserved, not in airtight containers (excluding smoked) | 1.413.7 | 1.428.2 | 1.235.9 | 1.626.0 | 1.863.9 | 7.2 |
| 030481 | Frozen fillets of pacific salmon | 911.2 | 944.9 | 1.020.6 | 1.107.8 | 1.269.2 | 8.6 |
| 030214 | Fresh or chilled atlantic salmon | 1.075.2 | 1.167.3 | 1.194.6 | 973.7 | 1.257.3 | 3.9 |
| 160414 | Prepared or preserved tunas, skipjack and atlantic bonito, whole or in pieces (excluding minced) | 976.5 | 1,102.9 | 1,130.4 | 1,288.9 | 1,060.4 | 2.1 |
| 160510 | Crab, prepared or preserved (excluding smoked) | 736.2 | 890.9 | 692.1 | 561.6 | 951.5 | 6.6 |
| 030612 | Frozen lobsters, even smoked, whether in shell or not | 432.1 | 527.4 | 589.5 | 449.7 | 864.9 | 18.9 |
| 030489 | Frozen fish fillets, nowhere else specified | 576.9 | 581.5 | 496.5 | 458.5 | 631.7 | 2.3 |
|
Source: Global Trade Tracker, 2022 *CAGR: Compound Annual Growth Rate |
|||||||
In 2021, the top two Canadian fish and seafood exports to US were frozen crabs and frozen lobsters. Total fish and seafood exports to US increased at a CAGR of 10.5% from 2017 to 2021, reaching $4,950 millions in 2021.
| HS code | Description | 2017 | 2018 | 2019 | 2020 | 2021 | CAGR* % 2017-2021 |
|---|---|---|---|---|---|---|---|
| Total - imports | 3,324.2 | 3,306.7 | 3,453.1 | 3,079 | 4,950 | 10.5 | |
| 030614 | Frozen crabs, even smoked, whether in shell or not | 683.9 | 619.6 | 717.2 | 698.1 | 1353.7 | 18.6 |
| 030612 | Frozen lobsters, even smoked, whether in shell or not | 430.3 | 524.8 | 586.6 | 448.4 | 859.8 | 18.9 |
| 030214 | Fresh or chilled atlantic salmon and danube salmon | 565.4 | 562.9 | 547.2 | 483.7 | 619.2 | 2.3 |
| 160530 | Lobster, prepared or preserved (excluding smoked) | 285.0 | 239.9 | 257.7 | 226.7 | 522.6 | 16.4 |
| 030632 | Lobsters, whether in shell or not, live, fresh or chilled | 397.9 | 401.3 | 396.4 | 322.9 | 421.3 | 1.4 |
| 030221 | Fresh or chilled lesser or greenland halibut and pacific halibut | 87.1 | 92.4 | 97.2 | 90.7 | 120.0 | 8.3 |
| 030441 | Fresh or chilled fillets of pacific salmon atlantic salmon and danube salmon | 105.1 | 109.5 | 94.9 | 113.8 | 119.4 | 3.2 |
| 030633 | Crabs, whether in shell or not, live, fresh or chilled | 5.1 | 7.2 | 30.3 | 37.0 | 97.0 | 108.8 |
| 030721 | Live, fresh or chilled, scallops, including queen scallops | 49.5 | 42.1 | 48.8 | 41.0 | 59.7 | 4.8 |
| 030489 | Frozen fish fillets, nowhere else specified | 47.8 | 50.7 | 53.2 | 36.3 | 54.9 | 3.5 |
|
Source: Global Trade Tracker, 2022 *CAGR: Compound Annual Growth Rate |
|||||||
Canadian provinces' fish and seafood exports to the United States
In 2021, Canada exported US$5,063.8 million of fish and seafood to the US. New Brunswick was the largest Canadian province, accounting for US$1,557 million, followed by Nova Scotia and Newfoundland and Labrador at US$987.7 million and US$803.8 million. COVID-19 did not affect total Canadian exports, from 2017 to 2021 the export increased to a CAGR of 10 7%.
| Province | 2017 | 2018 | 2019 | 2020 | 2021 | CAGR* % 2017-2021 |
|---|---|---|---|---|---|---|
| Total | 3,366.6 | 3,341.9 | 3,501.8 | 3,144.4 | 5,063.8 | 10.7 |
| New Brunswick (NB) | 1,041.0 | 1,058.5 | 1,100.0 | 871.5 | 1,557.0 | 10.6 |
| Nova Scotia (NS) | 764.7 | 758.9 | 774.9 | 702.1 | 978.7 | 6.4 |
| Newfoundland and Labrador | 333.5 | 339.7 | 358.3 | 378.1 | 803.8 | 24.6 |
| British Columbia | 598.9 | 592.4 | 638.7 | 625.4 | 744.3 | 5.6 |
| Prince Edward Island (PEI) | 180.2 | 167.2 | 190.6 | 193.4 | 373.5 | 19.9 |
| Quebec | 282.8 | 258.8 | 264.6 | 204.2 | 348.4 | 5.4 |
| Ontario | 123.9 | 124.9 | 132.9 | 137.7 | 213.3 | 14.6 |
| Manitoba | 39.1 | 39.8 | 38.2 | 29.4 | 41.8 | 1.7 |
| Saskatchewan | 2.0 | 0.8 | 2.2 | 1.9 | 1.7 | −3.9 |
| Alberta | 0.5 | 0.9 | 1.2 | 0.7 | 1.2 | 24.5 |
|
Source: Global Trade Tracker 2022 *CAGR: Compound Annual Growth Rate |
||||||
New Brunswick exported mainly lobsters to the US. It exported frozen lobsters at US$498.1 millions in 2021 and it exported prepared or preserved lobster at US$331.8 millions in 2021. The top three fish and seafood exports have been growing positively from 2017 to 2021.
| HS codes | Description | 2017 | 2018 | 2019 | 2020 | 2021 | CAGR* % 2017-2021 |
|---|---|---|---|---|---|---|---|
| Total - exports | 1,041 | 1,058.5 | 1,100 | 871.5 | 1,557 | 10.6 | |
| 030612 | Frozen lobsters, smoked, whether in shell or not | 231.7 | 307.5 | 360.0 | 253.8 | 498.1 | 21.1 |
| 160530 | Lobster, prepared or preserved (excluding smoked) | 170.3 | 154.6 | 164.5 | 138.8 | 331.8 | 18.2 |
| 030214 | Fresh or chilled atlantic salmon and danube salmon | 193.2 | 213.2 | 177.9 | 135.5 | 261.9 | 7.9 |
| 030614 | Frozen crabs, smoked, whether in shell or not | 170.1 | 133.4 | 171.9 | 151.8 | 255.5 | 10.7 |
| 030632 | Lobsters, whether in shell or not, live, fresh or chilled | 101.0 | 101.1 | 109.7 | 71.0 | 75.8 | −6.9 |
| 030441 | Fresh or chilled fillets of pacific salmon , atlantic salmon and danube salmon | 91.2 | 76.0 | 39.4 | 40.9 | 41.1 | −18.1 |
| 160413 | Prepared or preserved sardines, sardinella and brisling or sprats, whole or in pieces (excluding minced) | 16.7 | 13.0 | 12.0 | 12.9 | 11.0 | −9.9 |
| 160412 | Prepared or preserved herrings, whole or in pieces (excluding minced) | 9.1 | 7.5 | 7.1 | 9.3 | 9.8 | 1.9 |
| 030711 | Oysters, in shell, live, fresh or chilled | 4.4 | 4.5 | 5.6 | 3.9 | 9.1 | 19.9 |
| 051191 | Products of fish or crustaceans, molluscs or other aquatic invertebrates | 3.8 | 4.4 | 5.9 | 5.3 | 8.2 | 21.2 |
|
Source: Global Trade Tracker, 2022 *CAGR: Compound Annual Growth Rate |
|||||||
Lobsters and frozen crabs from Nova Scotia are their main exports to the US, representing the value of US$307.4 million and US$211.2 millions respectively in 2021. They grew positively at the CAGR of 3.8% and 15.7% from 2017 to 2021.
| HS codes | Description | 2017 | 2018 | 2019 | 2020 | 2021 | CAGR* % 2017-2021 |
|---|---|---|---|---|---|---|---|
| Total - exports | 764.7 | 758.9 | 774.9 | 702.1 | 978.7 | 6.4 | |
| 030632 | Lobsters, whether in shell or not, live, fresh or chilled | 264.9 | 265.4 | 247.0 | 212.4 | 307.4 | 3.8 |
| 030614 | Frozen crabs, even smoked, whether in shell or not | 118.0 | 98.7 | 139.4 | 131.8 | 211.2 | 15.7 |
| 030612 | Frozen lobsters, even smoked, whether in shell or not | 74.4 | 85.3 | 78.8 | 50.6 | 84.1 | 3.1 |
| 030221 | Fresh or chilled lesser or greenland halibut and pacific halibut | 43.9 | 53.8 | 55.3 | 54.9 | 69.5 | 12.2 |
| 030721 | Live, fresh or chilled, scallops, including queen scallops | 38.0 | 33.9 | 40.2 | 33.7 | 52.4 | 8.4 |
| 160530 | Lobster, prepared or preserved (excluding smoked) | 32.5 | 31.9 | 27.8 | 26.2 | 41.9 | 6.6 |
| 160419 | Prepared or preserved fish, whole or in pieces | 35.2 | 34.0 | 34.5 | 34.6 | 40.9 | 3.8 |
| 030722 | Scallops, including queen scallops, frozen, even in shell | 21.4 | 31.5 | 24.6 | 30.6 | 25.8 | 4.8 |
| 160411 | Prepared or preserved salmon, whole or in pieces (excluding minced) | 12.8 | 14.2 | 13.7 | 16.0 | 20.5 | 12.5 |
| 030247 | Fresh or chilled swordfish | 11.6 | 7.0 | 8.6 | 12.1 | 12.4 | 1.7 |
|
Source: Global Trade Tracker, 2022 *CAGR: Compound Annual Growth Rate |
|||||||
Newfoundland and Labrador's main fish and seafood exports to the US is frozen crabs. In 2021, it more than doubles the value of 2020, that is, from US$264.3 million in 2020 to reach US$644.4 million in 2021. The growth rate is at the CAGR of 31.5% from 2017 to 2021.
| HS codes | Description | 2017 | 2018 | 2019 | 2020 | 2021 | CAGR* % 2017-2021 |
|---|---|---|---|---|---|---|---|
| Total - exports | 333.5 | 339.7 | 358.3 | 378.1 | 803.8 | 24.6 | |
| 030614 | Frozen crabs, even smoked, whether in shell or not | 215.5 | 221.3 | 236.4 | 264.3 | 644.4 | 31.5 |
| 030612 | Frozen lobsters, even smoked, whether in shell or not | 20.8 | 22.6 | 22.6 | 23.8 | 42.2 | 19.4 |
| 160530 | Lobster, prepared or preserved (excluding smoked) | 7.7 | 7.5 | 10.9 | 15.1 | 21.6 | 29.4 |
| 030221 | Fresh or chilled lesser or greenland halibut, atlantic halibut and pacific halibut | 8.9 | 9.6 | 10.3 | 10.0 | 12.8 | 9.5 |
| 030471 | Frozen fillets of cod | 8.0 | 9.9 | 7.8 | 6.5 | 12.3 | 11.4 |
| 030772 | Frozen, even in shell, clams, cockles and ark shells | 11.1 | 11.9 | 14.1 | 9.6 | 10.0 | −2.6 |
| 030632 | Lobsters "homarus spp.", whether in shell or not, live, fresh or chilled | 8.3 | 10.8 | 8.5 | 7.0 | 8.6 | 0.9 |
| 030359 | Frozen anchovies, indian mackerels, seerfishes, sailfishes and spearfish | 4.2 | 4.7 | 5.3 | 6.7 | 7.0 | 13.6 |
| 030339 | Frozen flat fish (excluding halibut, plaice, sole and turbot) | 7.1 | 4.4 | 6.3 | 5.1 | 6.2 | −3.3 |
| 160412 | Prepared or preserved herrings, whole or in pieces (excluding minced) | 5.9 | 5.7 | 5.3 | 5.2 | 5.2 | −3.1 |
|
Source: Global Trade Tracker, 2022 *CAGR: Compound Annual Growth Rate |
|||||||
BC's total export of fish and seafood to the US grew at a CAGR of 5.6% from 2017 to 2021. Especially the live, freh or chilled crab grow significantly at a CAGR of 126.1%, the value in 2021 nearly tripled the one in 2020, reaching US$96.7 million.
| HS code | Description | 2017 | 2018 | 2019 | 2020 | 2021 | CAGR* % 2017-2021 |
|---|---|---|---|---|---|---|---|
| Total - exports | 598.9 | 592.4 | 638.7 | 625.4 | 744.3 | 5.6 | |
| 030214 | Fresh or chilled atlantic salmon and danube salmon | 368.8 | 338.6 | 359.6 | 347.4 | 356.6 | −0.8 |
| 030633 | Crabs, whether in shell or not, live, fresh or chilled | 3.7 | 6.5 | 29.7 | 36.4 | 96.7 | 126.1 |
| 030441 | Fresh or chilled fillets of pacific salmon, atlantic salmon and danube salmon | 12.1 | 31.7 | 55.0 | 72.7 | 67.5 | 53.7 |
| 030221 | Fresh or chilled lesser or greenland halibut, atlantic halibut and pacific halibut | 29.2 | 24.1 | 26.1 | 20.6 | 32.6 | 2.8 |
| 030213 | Fresh or chilled pacific salmon | 31.2 | 42.2 | 22.1 | 21.9 | 29.0 | −1.8 |
| 030481 | Frozen fillets of pacific salmon. atlantic salmon and danube salmon | 19.2 | 28.3 | 24.3 | 22.7 | 26.7 | 8.6 |
| 030487 | Frozen fillets of tuna, skipjack or stripe-bellied bonito | 14.7 | 11.8 | 12.5 | 11.3 | 20.0 | 8.0 |
| 030449 | Fresh or chilled fillets of fish, nowhere else specified | 15.3 | 15.8 | 14.5 | 14.3 | 14.3 | −1.7 |
| 030711 | Oysters, even in shell, live, fresh or chilled | 10.5 | 8.5 | 11.2 | 6.1 | 13.4 | 6.3 |
| 030312 | Frozen pacific salmon (excluding sockeye salmon "red salmon") | 14.4 | 12.8 | 9.6 | 11.5 | 12.4 | −3.7 |
|
Source: Global Trade Tracker, 2022 *CAGR: Compound Annual Growth Rate |
|||||||
The total fish and seafood exports of PEI to the US doubled at a CAGR of 19.9% from US$180.2 million in 2017 to US$373.5 million in 2021. All of the top 10 products have grown except live, fresh or chilled mussels with a small decrease at a CAGR of −1,3% from 20217 to 2021.
| HS codes | Description | 2017 | 2018 | 2019 | 2020 | 2021 | CAGR* % 2017-2021 |
|---|---|---|---|---|---|---|---|
| Fish and Seafood Total | 180.2 | 167.2 | 190.6 | 193.4 | 373.5 | 19.9 | |
| 030612 | Frozen lobsters, smoked, whether in shell or not | 67.3 | 67.5 | 85.9 | 94.8 | 173.3 | 26.7 |
| 160530 | Lobster, prepared or preserved (excluding smoked) | 45.9 | 29.5 | 38.4 | 36.3 | 89.2 | 18.1 |
| 030731 | Live, fresh or chilled, not smoked, mussels, with or without shell | 32.5 | 31.6 | 30.6 | 22.9 | 30.8 | −1.3 |
| 030614 | Frozen crabs, even smoked, whether in shell or not | 4.6 | 5.1 | 2.2 | 8.8 | 24.8 | 52.4 |
| 030711 | Oysters, in shell, live, fresh or chilled | 8.1 | 9.0 | 10.5 | 6.3 | 17.9 | 21.9 |
| 160510 | Crab, prepared or preserved (excluding smoked) | 5.1 | 9.4 | 8.6 | 10.3 | 14.0 | 28.7 |
| 030632 | Lobsters, whether in shell or not, live, fresh or chilled | 5.7 | 3.3 | 4.5 | 4.6 | 8.1 | 9.2 |
| 160540 | Crustaceans, prepared or preserved (excluding smoked, crabs, shrimps, prawns and lobster) | 1.3 | 2.1 | 3.5 | 2.8 | 4.1 | 33.3 |
| 160553 | Mussels, prepared or preserved (excluding smoked) | 1.9 | 1.5 | 0.7 | 1.1 | 2.4 | 6.0 |
| 030739 | Mussels, smoked, dried, salted or in brine, even in shell | 0.1 | 1.5 | 1.7 | 1.6 | 2.2 | 116.6 |
|
Source: Global Trade Tracker, 2022 *CAGR: Compound Annual Growth Rate |
|||||||
The top three Quebec's exports of fish and seafood in 2021 are frozen crabs, frozen lobsters and prepared or preserved lobsters. They grew at a CAGR of 5.2%, 13.6% and 6.9% respectively from 2017 to 2022.
| HS codes | Description | 2017 | 2018 | 2019 | 2020 | 2021 | CAGR* % 2017-2021 |
|---|---|---|---|---|---|---|---|
| Fish and Seafood Total | 282.8 | 258.8 | 264.6 | 204.2 | 348.4 | 5.4 | |
| 030614 | Frozen crabs, smoked, whether in shell or not | 173.3 | 152.8 | 163.6 | 136.2 | 212.3 | 5.2 |
| 030612 | Frozen lobsters, smoked, whether in shell or not | 35.5 | 41.2 | 39.1 | 25.2 | 59.1 | 13.6 |
| 160530 | Lobster, prepared or preserved (excluding smoked) | 28.5 | 16.5 | 15.9 | 10.1 | 37.2 | 6.9 |
| 030632 | Lobsters, whether in shell or not, live, fresh or chilled | 17.8 | 20.2 | 20.4 | 17.8 | 21.4 | 4.7 |
| 030221 | Fresh or chilled lesser or greenland halibut, atlantic halibut and pacific halibut | 4.3 | 4.4 | 4.9 | 4.8 | 5.0 | 3.8 |
| 160521 | Shrimps and prawns, prepared or preserved, not in airtight containers (excluding smoked) | 2.8 | 1.5 | 2.9 | 1.2 | 2.5 | −2.8 |
| 160510 | Crab, prepared or preserved (excluding smoked) | 2.1 | 1.6 | 1.8 | 1.3 | 2.0 | −1.2 |
| 160529 | Shrimps and prawns, prepared or preserved, in airtight containers (excluding smoked) | 3.8 | 4.2 | 4.0 | 1.3 | 1.8 | −17.0 |
| 121221 | Seaweeds and other algae, fresh, chilled, frozen or dried, whether or not ground, fit for human consumption | 4.9 | 1.1 | 2.4 | 1.7 | 1.4 | −26.9 |
| 160552 | Scallops, including queen scallops, prepared or preserved (excluding smoked) | 0.0 | 0.0 | 0.0 | 0.2 | 0.6 | 200 |
|
Source: Global Trade Tracker, 2022 *CAGR: Compound Annual Growth Rate |
|||||||
Ontario's top two exports of fish and seafood to the US were frozen crabs and frozen fish fillet, representing the value of US$54.2 million and US$31.5 million respectively in 2021.
| HS codes | Description | 2017 | 2018 | 2019 | 2020 | 2021 | CAGR* % 2017-2021 |
|---|---|---|---|---|---|---|---|
| Fish and Seafood Total | 123.9 | 124.9 | 132.9 | 137.7 | 213.3 | 14.5 | |
| 030614 | Frozen crabs, even smoked, whether in shell or not, | 8.8 | 11.9 | 18.3 | 36.2 | 54.2 | 57.5 |
| 030489 | Frozen fish fillets, nowhere else specified | 26.3 | 26.8 | 27.6 | 18.9 | 31.5 | 4.6 |
| 030449 | Fresh or chilled fillets of fish, nowhere else specified | 17.2 | 18.6 | 15.8 | 13.2 | 17.5 | 0.4 |
| 030289 | Fresh or chilled fish, nowhere else specified | 17.7 | 15.0 | 13.0 | 10.3 | 14.5 | −4.9 |
| 030441 | Fresh or chilled fillets of pacific salmon, atlantic salmon and danube salmon | 1.3 | 1.4 | 0.9 | 2.3 | 12.4 | 75.7 |
| 160300 | Extracts and juices of meat, fish or crustaceans, molluscs and other aquatic invertebrates | 3.9 | 4.3 | 9.2 | 8.6 | 11.4 | 30.8 |
| 030495 | Frozen meat, whether or not minced of fish of the families bregmacerotidae, euclichthyidae, gadidae, macrouridae, melanonidae, merlucciidae, moridae and muraenolepididae | 0.0 | 0.1 | 0.2 | 0.0 | 9.2 | 351.4 |
| 160412 | Prepared or preserved herrings, whole or in pieces (excluding minced) | 6.5 | 6.4 | 6.1 | 6.4 | 6.1 | −1.6 |
| 030532 | Fillets, dried, salted or in brine, but not smoked | 0.1 | 0.9 | 6.1 | 5.7 | 5.2 | 168.5 |
| 030481 | Frozen fillets of pacific salmon atlantic, salmon and danube salmon | 2.4 | 2.4 | 1.3 | 2.2 | 4.5 | 17.0 |
|
Source: Global Trade Tracker, 2022 *CAGR: Compound Annual Growth Rate |
|||||||
Manitoba's exports of fish and seafood is frozen fish fillet at the value of US$25.0 million in 2021. It grew at CAGR of 0.6% from 2017 to 2022.
| HS codes | Description | 2017 | 2018 | 2019 | 2020 | 2021 | CAGR* % 2017-2021 |
|---|---|---|---|---|---|---|---|
| Fish and Seafood Total | 39.1 | 39.8 | 38.2 | 29.4 | 41.8 | 1.7 | |
| 030489 | frozen fish fillets, nowhere else specified | 24.4 | 24.4 | 23.0 | 15.9 | 25.0 | 0.6 |
| 030459 | fresh or chilled fish meat, whether or not minced (excluding all fillets, tilapias, catfish, carp, eels, nile perch, snakeheads, salmonidae, swordfish, toothfish, rays, skates, dogfish and other sharks and fish of the families | 3.5 | 3.9 | 4.3 | 3.5 | 4.1 | 4.0 |
| 051000 | ambergris, castoreum, civet and musk; cantharides; bile, whether or not dried; glands and other animal products | 2.8 | 2.1 | 2.3 | 3.6 | 3.8 | 7.9 |
| 030289 | fresh or chilled fish, nowhere else specified | 2.6 | 3.4 | 3.0 | 2.1 | 3.0 | 3.6 |
| 030389 | frozen fish, nowhere else specified | 1.5 | 2.4 | 2.6 | 1.9 | 2.5 | 13.6 |
| 030449 | fresh or chilled fillets of fish, nowhere else specified | 1.9 | 1.9 | 1.9 | 1.3 | 2.4 | 6.0 |
| 160432 | caviar substitutes prepared from fish eggs | 0.2 | 0.3 | 0.2 | 0.1 | 0.3 | 10.7 |
| 030499 | frozen fish meat, nowhere else specified (excluding fillets) | 1.3 | 1.2 | 0.3 | 0.3 | 0.2 | −37.4 |
| 030452 | fresh or chilled meat, whether or not minced, of salmonidae (excluding fillets) | 0.0 | 0.0 | 0.0 | 0.0 | 0.2 | N/C |
| 030314 | frozen trout | 0.0 | 0.0 | 0.0 | 0.2 | 0.2 | N/C |
|
Source: Global Trade Tracker, 2022 *CAGR: Compound Annual Growth Rate N/C: Not Cacaluable |
|||||||
Saskachewan's exports of fish and seafood to the US decreased at a CAGR of −3.9% from 2017 to 2021.
| HS codes | Description | 2017 | 2018 | 2019 | 2020 | 2021 | CAGR* % 2017-2021 |
|---|---|---|---|---|---|---|---|
| Fish and Seafood Total | 2.0 | 0.8 | 2.2 | 1.9 | 1.7 | −3.9 | |
| 030211 | Fresh or chilled trout | 1.0 | 0.0 | 0.1 | 0.8 | 0.7 | −8.5 |
| 050790 | Tortoiseshell, whalebone and its hair, horns, antlers, hooves, nails, claws and beaks, unworked or simply prepared, their powder and waste (excluding cut to shape and ivory) | 0.4 | 0.3 | 0.3 | 0.7 | 0.6 | 10.7 |
| 051000 | Ambergris, castoreum, civet and musk; cantharides; bile, whether or not dried; glands and other animal products | 0.2 | 0.1 | 0.2 | 0.2 | 0.2 | 0 |
|
Source: Global Trade Tracker, 2022 *CAGR: Compound Annual Growth Rate |
|||||||
Alberta's export of fish and seafood to the US has gew at a CAGR of 24.5% from 2017 to 2021. In 2021, it reached the value of US$1.2 million.
| HS codes | Description | 2017 | 2018 | 2019 | 2020 | 2021 | CAGR* % 2017-2021 |
|---|---|---|---|---|---|---|---|
| Fish and Seafood Total | 0.5 | 0.9 | 1.2 | 0.7 | 1.2 | 24.5 | |
| 051000 | Ambergris, castoreum, civet and musk; cantharides; bile, whether or not dried; glands and other animal products | 0.0 | 0.3 | 0.6 | 0.2 | 0.4 | N/C |
| 050710 | Ivory, unworked or simply prepared, its powder and waste (excluding cut to shape) | 0.2 | 0.3 | 0.3 | 0.3 | 0.4 | 18.9 |
| 050790 | Tortoiseshell, whalebone and its hair, horns, antlers, hooves, nails, claws and beaks, unworked or prepared, their powder and waste (excluding cut to shape and ivory) | 0.1 | 0.1 | 0.3 | 0.1 | 0.2 | 18.9 |
| 121229 | Seaweeds and other algae, fresh, chilled, frozen or dried, whether or not ground, unfit for human consumption | 0.0 | 0.0 | 0.0 | 0.1 | 0.1 | N/C |
|
Source: Global Trade Tracker, 2022 *CAGR: Compound Annual Growth Rate N/C: Not Cacaluable |
|||||||
Market size in the United States
Total retail sales in 2021 reached US$28.5 billion.
Crustaceans is the best performing category in 2021, with total retail sales growing by 14.4% to US$10.9 billion.
Total retail sales are set to increase at a CAGR of 5% over the forecast period to US$37.5 billion in 2026.
Meat alternatives have gained market share and popularity in recent years, not only amongst vegetarians and vegans, but also amongst consumers looking to reduce their meat intake. While seafood alternatives have not typically commanded as much consumer attention, they have experienced substantial growth in 2020 and 2021. Consumers are increasingly expressing interest in seafood alternatives for health and environmental reasons.
| Category | 2017 | 2021 | CAGR* 2017-2021 | 2022 | 2026 | CAGR* 2017-2021 |
|---|---|---|---|---|---|---|
| Fish and Seafood | 18,404,8 | 28,497.9 | 11.6 | 30,819.0 | 37,512.3 | 5 |
| Crustaceans | 6,409.1 | 10,986.6 | 14.4 | 12,075.8 | 15,098.1 | 5.7 |
| Fish | 5,653.1 | 8,679.4 | 11.3 | 9,333.9 | 11,187.4 | 4.6 |
| Molluscs and cephalopods | 6,342.6 | 8,831.8 | 8.6 | 9,409.3 | 11,226.7 | 4.5 |
| Processed seafood | 4,867.0 | 6,475.4 | 7.4 | 6,233.5 | 6,803.8 | 2.2 |
| Shelf stable seafood | 2,194.1 | 2,727.0 | 5.6 | 2,722.4 | 2,985.0 | 2.3 |
| Chilled processed seafood | 624.3 | 889.6 | 9.3 | 822.8 | 885.3 | 1.8 |
| Frozen processed seafood | 2,048.5 | 2,858.7 | 8.7 | 2,688.4 | 2,933.4 | 2.2 |
|
Source: Euromoitor 2022 *CAGR: Compound Annual Growth Rate |
||||||
Product launches
From 2017 to 2021, there are 944 new fish and seafood product lauches in the USA. In 2021, there are 218 new product launches in the United States.
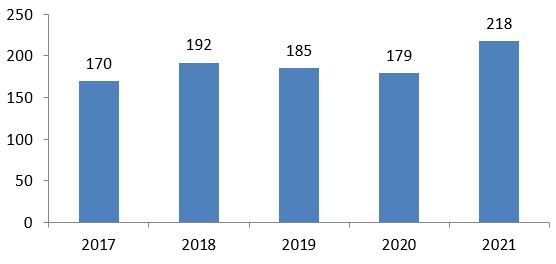
Description of above image
| Date published | Number of variants |
|---|---|
| 2017 | 170 |
| 2018 | 192 |
| 2019 | 185 |
| 2020 | 179 |
| 2021 | 218 |
| Total Sample | 944 |
Source: Mintel 2022
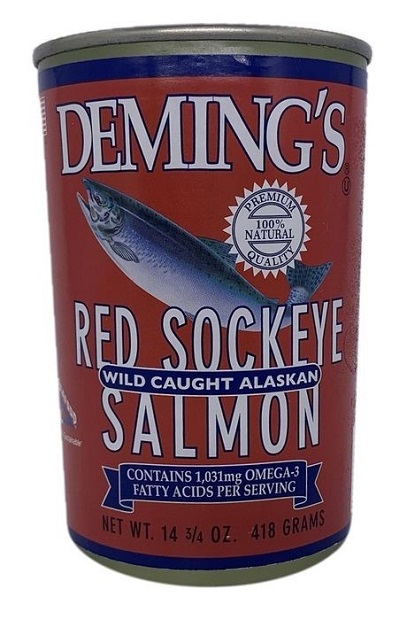
Red Sockeye Wild Caught Alaskan Salmon
| Record ID | 9256954 |
|---|---|
| Company | PeterPan Seafoods |
| Distributor | PeterPan Seafoods |
| Brand | Deming's |
| Category | Processed fish, meat and egg products |
| Sub-category | Fish products |
| Market | United States |
| Location of manufacture | United States |
| Import status | Not imported |
| Store name | Amazon.com |
| Store type | Internet / mail order |
| Date published | December 2021 |
| Product source | Shopper |
| Launch type | New variety / range extension |
| Price in local currency | $16.95 |
| Price in Euros | 14.98 |
| Barcode | 021100021016 |
Deming's Red Sockeye Wild Caught Alaskan Salmon contains 1031 milligrams of omega 3 fatty acids per serving. This 100% natural, premium quality and kosher certified product retails in a 14.75 ounce pack featuring the Alaska Seafood logo and a recipe instructions.
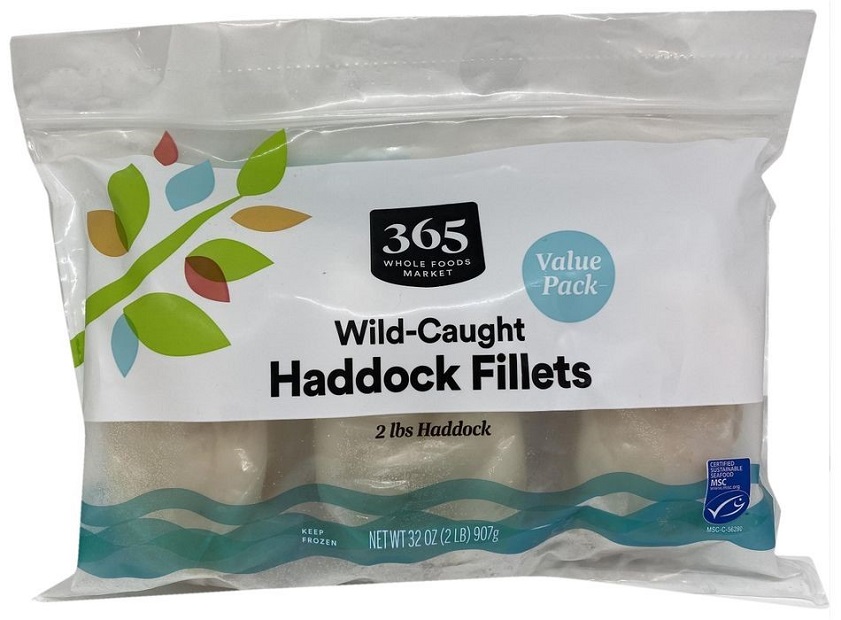
Wild-Caught Haddock Fillets
| Record ID | 9068982 |
|---|---|
| Company | Whole Foods Market |
| Brand | 365 Whole Foods Market |
| Category | Processed fish, meat and egg products |
| Sub-category | Fish products |
| Market | United States |
| Location of manufacture | Iceland |
| Production code | IS H072 EFTA |
| Import status | Imported product |
| Store name | Whole Foods Market |
| Store type | Natural / health food store |
| Store Address | Northbrook 60062 |
| Date published | October 2021 |
| Product source | Shopper |
| Launch type | New variety / range extension |
| Price in local currency | $19.99 |
| Price in Euros | 17.05 |
| Barcode | 099482477912 |
365 Whole Foods Market Wild-Caught Haddock Fillets are sourced from fisheries that are certified sustainable to the Marine Stewardship Council (MSC) standard or rated either "Green" or "Yellow" by Monterey Bay Aquarium's Seafood Watch. The wild-caught and traceable fish is free from added preservatives such as sodium bisulfite, sodium tri-polyphosphate (STP) and sodium metabisulfite, and retails in a 32 ounce value pack bearing the MSC (Marine Stewardship Council) - Certified Sustainable Seafood logo.
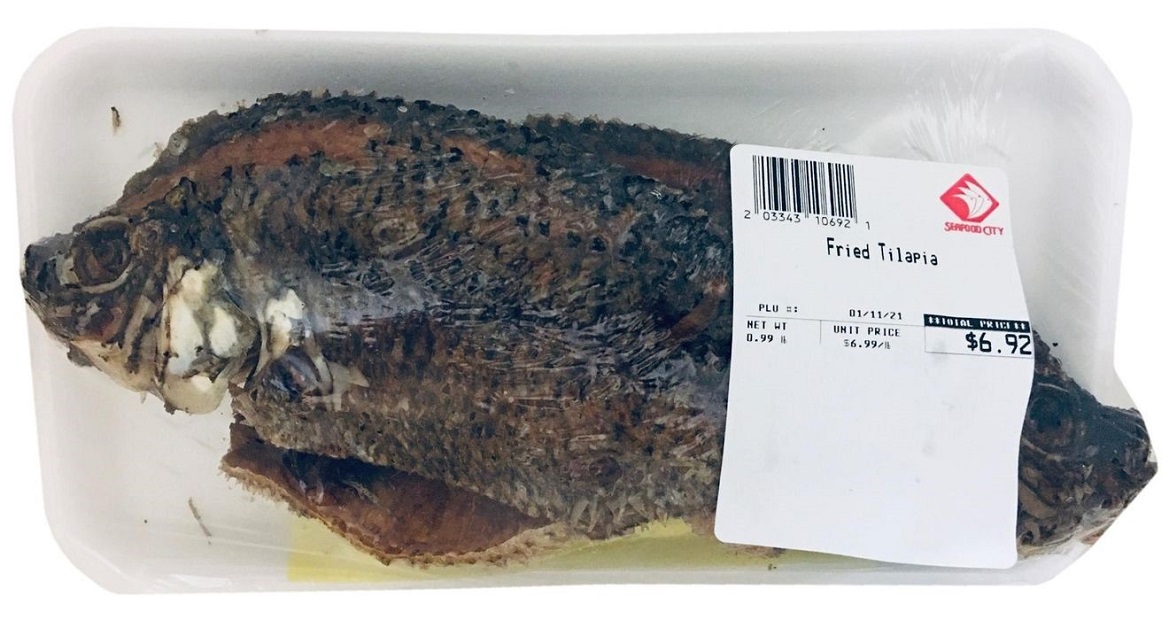
Fried Tilapia
| Record ID | 8419441 |
|---|---|
| Company | Seafood City |
| Brand | Seafood City |
| Category | Processed fish, meat and egg products |
| Sub-category | Fish products |
| Market | United States |
| Store name | Seafood City |
| Store type | Supermarket |
| Store address | Los Angeles 90041 |
| Date published | January 2021 |
| Product source | Shopper |
| Launch type | New variety / range extension |
| Price in local currency | $6.92 |
| Price in Euros | 5.66 |
| Barcode | 203343106921 |
Seafood City Fried Tilapia is now available. The product retails in 0.99 pound pack.
For more information
The Canadian Trade Commissioner Service:
International Trade Commissioners can provide Canadian industry with on-the-ground expertise regarding market potential, current conditions and local business contacts, and are an excellent point of contact for export advice.
More agri-food market intelligence:
International agri-food market intelligence
Discover global agriculture and food opportunities, the complete library of Global Analysis reports, market trends and forecasts, and information on Canada's free trade agreements.
Agri-food market intelligence service
Canadian agri-food and seafood businesses can take advantage of a customized service of reports and analysis, and join our email subscription service to have the latest reports delivered directly to their inbox.
More on Canada's agriculture and agri-food sectors:
Canada's agriculture sectors
Information on the agriculture industry by sector. Data on international markets. Initiatives to support awareness of the industry in Canada. How the department engages with the industry.
For additional information on the Seafood Expo Global (SEG) 2022, please contact:
Ben Berry, Deputy Director
Trade Show Strategy and Delivery
Agriculture and agri-food Canada
ben.berry@agr.gc.ca
Resources
- Global Trade Tracker, 2021
- Euromonitor 2022
- Mintel 2022
Sector Trend Analysis – Fish and seafood trends in the United States
Global Analysis Report
Prepared by: Hongli Wang, Senior Market Analyst
© Her Majesty the Queen in Right of Canada, represented by the Minister of Agriculture and Agri-Food (2022).
Photo credits
All photographs reproduced in this publication are used by permission of the rights holders.
All images, unless otherwise noted, are copyright Her Majesty the Queen in Right of Canada.
To join our distribution list or to suggest additional report topics or markets, please contact:
Agriculture and Agri-Food Canada, Global Analysis1341 Baseline Rd, Tower 5, 3rd floor
Ottawa ON K1A 0C5
Canada
Email: aafc.mas-sam.aac@agr.gc.ca
The Government of Canada has prepared this report based on primary and secondary sources of information. Although every effort has been made to ensure that the information is accurate, Agriculture and Agri-Food Canada (AAFC) assumes no liability for any actions taken based on the information contained herein.
Reproduction or redistribution of this document, in whole or in part, must include acknowledgement of agriculture and agri-food Canada as the owner of the copyright in the document, through a reference citing AAFC, the title of the document and the year. Where the reproduction or redistribution includes data from this document, it must also include an acknowledgement of the specific data source(s), as noted in this document.
Agriculture and Agri-Food Canada provides this document and other report services to agriculture and food industry clients free of charge.