

Note: This report includes forecasting data that is based on baseline historical data.
Executive summary
The United States (U.S.) was the world's second largest beer market in 2021, with US$104.9 billion in sales. The U.S. beer market is dominated by lager, with premium lager expected to be the fastest growing lager beer by a Compound Annual Growth Rate (CAGR) of 5.8%. The fastest growing beer categories over 2021 to 2026 are expected to be non/low alcoholic beer at a CAGR of 11.4%, followed by stout (8.9%), and dark beer (8.6%). Non-craft beer sales in the U.S. have been slowly decreasing over the past several years, while craft beer sales have seen a slow increase over 2017 to 2021.
Over 2016 to 2021, U.S. beer on and off trade has seen a role reversal with off-trade now exceeding on-trade, representing 54.7% of the market. On-trade sales fell over 2016 to 2021 while off-trade sales grew, as on-trade took a major hit during the pandemic, with closures affecting beer sales at bars and restaurants and consumers staying at home.
In 2021, the market share of store-based retailing totaled 91.3% with most U.S. consumers purchasing beer from forecourt retailers (gas stations), supermarkets, and traditional grocery retailers.
In 2021, the top ten brands in the U.S. represented 59.7% market share. Among them, Michelob Ultra saw a highest market share growth at a CAGR of 17.5% from 2017 to 2021, followed by Modelo (15.4%).
U.S. beer drinkers are shifting to higher quality ingredients out of concerns over ingredient sourcing and sustainability. The pandemic has made consumers develop a more compassionate mindset about community, caring more for the environment, labourers, and supporting smaller businesses.
The craft industry is expected to largely benefit from this trend, as consumers seek to support local businesses, as well as receive a higher quality beer with fresh ingredients.
In 2021, the US imported US$8.3 billion in beer, growing at a CAGR of 4.7% from 2017 to 2021. Top three supplier markets were Mexico (75.1%), Netherlands (12.0%), and Belgium 3.7$). Canada was the fifth largest beer supplier to the U.S. at a value of US$129 million.
Market overview
The U.S. was the world's second largest beer market in 2021, with US$104.9 billion in sales. U.S. beer sales were stagnant from 2016 to 2021 but are expected to grow at a CAGR of 5.0% over 2021 to 2026. U.S. beer sales are expected to reach US$133.7 billion by 2026.
| Country | 2016 | 2021 | CAGR* % 2016-2021 | 2022 | 2026 | CAGR* % 2021-2026 |
|---|---|---|---|---|---|---|
| World | 584.0 | 650.9 | 2.2 | 735.6 | 997.3 | 8.9 |
| China | 83.3 | 106.5 | 5.0 | 111.0 | 151.5 | 7.3 |
| United States | 102.7 | 104.9 | 0.4 | 118.3 | 133.7 | 5.0 |
| Brazil | 23.9 | 42.9 | 12.5 | 51.4 | 81.6 | 13.7 |
| Mexico | 17.5 | 28.0 | 9.8 | 32.6 | 44.6 | 9.8 |
| United Kingdom | 28.0 | 27.3 | −0.5 | 31.3 | 38.1 | 6.9 |
| Germany | 34.1 | 26.6 | −4.9 | 31.8 | 36.8 | 6.7 |
| Japan | 37.3 | 25.1 | −7.7 | 26.0 | 27.5 | 1.9 |
| Russia | 12.5 | 15.3 | 4.1 | 18.0 | 25.5 | 10.8 |
| Spain | 16.3 | 16.8 | 0.6 | 18.4 | 24.4 | 7.7 |
| Argentina | 0.6 | 3.5 | 42.1 | 5.9 | 22.9 | 45.5 |
| Canada (14) | 13.8 | 12.9 | −1.3 | 14.4 | 17.1 | 5.8 |
|
Source: Euromonitor International, 2022 *CAGR: Compound Annual Growth Rate |
||||||
The U.S. beer market is dominated by lager, which saw US$84.0 billion in sales in 2021, accounting for 80.0% of total beer sales in 2021. This category is expected to see a of CAGR 3.9% in sales over 2021 to 2026, with premium lager expected to grow the fastest by a CAGR of 5.8%. The fastest growing beer categories over 2021 to 2026 are expected to be no/low alcoholic beer at a CAGR of 11.4%, followed by stout (8.9%), and dark beer (8.6%).
| Category | 2016 | 2021 | CAGR* % 2016-2021 | 2022 | 2026 | CAGR* % 2021-2026 |
|---|---|---|---|---|---|---|
| Beer | 102,745.6 | 104,897.0 | 0.4 | 118,320.7 | 133,717.8 | 5.0 |
| Lager | 81,433.3 | 84,031.7 | 0.6 | 92,647.8 | 101,903.6 | 3.9 |
| Flavoured Lager | 1,304.1 | 1,370.6 | 1.0 | 1,429.0 | 1,714.3 | 4.6 |
| Standard Lager | 80,129.2 | 82,661.1 | 0.6 | 91,218.8 | 100,189.3 | 3.9 |
| Premium Lager | 32,514.7 | 40,758.3 | 4.6 | 43,175.8 | 54,009.2 | 5.8 |
| Mid-Priced Lager | 32,553.7 | 28,646.7 | −2.5 | 33,392.7 | 31,834.1 | 2.1 |
| Economy Lager | 15,060.8 | 13,256.1 | −2.5 | 14,650.2 | 14,346.0 | 1.6 |
| Standard Lager (Origin) | 80,129.2 | 82,661.1 | 0.6 | 91,218.8 | 100,189.3 | 3.9 |
| Dark Beer | 18,423.2 | 17,359.8 | −1.2 | 21,623.6 | 26,281.9 | 8.6 |
| Ale | 13,594.5 | 13,420.9 | −0.3 | 16,886.4 | 21,531.0 | 9.9 |
| Wheat Beer | 4,828.8 | 3,938.9 | −4.0 | 4,737.1 | 4,751.0 | 3.8 |
| Non/Low Alcohol Beer | 733.4 | 916.1 | 4.5 | 1,058.7 | 1,569.9 | 11.4 |
| Low Alcohol Beer | 334.2 | 246.5 | −5.9 | 277.3 | 363.3 | 8.1 |
| Non Alcoholic Beer | 399.2 | 669.6 | 10.9 | 781.4 | 1,206.6 | 12.5 |
| Stout | 2,155.6 | 2,589.4 | 3.7 | 2,990.7 | 3,962.4 | 8.9 |
|
Source: Euromonitor International, 2022 *CAGR: Compound Annual Growth Rate |
||||||
Non-craft beer sales in the U.S. have been slowly decreasing while craft beer sales have seen a slow increase over 2017 to 2021. Craft beer took a major hit during the pandemic, with foodservice closures affecting its main points of sale. However, according to Euromonitor, craft beer sales are expected to return to prepandemic sales levels and then some. Craft beer performed better in 2021, a year when U.S. consumers were not only itching to get out and socialize but they wanted to specifically support local bars/pubs and were willing to pay premium prices to do so. Craft beer has also benefited from multiple trends that work in its favour, from premiumisation to innovative flavours and the reopening of sales channels. Pandemic related challenges facing craft beer include supply chain issues and the cost of ingredients, which are rising; as well as space issues - where to store packaging that must now be purchased by the tonne in order to fill an order.
| Brand (Company) | 2017 | 2018 | 2019 | 2020 | 2021 | CAGR* 2017-2021 |
|---|---|---|---|---|---|---|
| Craft | 2,836.0 | 2,943.4 | 3,029.7 | 2,849.2 | 2,978.0 | 1.0 |
| Non-Craft | 21,080.0 | 20,694.4 | 20,454.3 | 20,091.1 | 20,433.7 | −0.6 |
| Total | 23,916.0 | 23,637.8 | 23,484.0 | 22,940.3 | 23,411.6 | −0.4 |
|
Source: Euromonitor International, 2022 *CAGR: Compound Annual Growth Rate |
||||||
Off-trade and on-trade
Over 2016 to 2021, on and off trade in the U.S. beer market has seen a role reversal with off-trade now exceeding on-trade, representing 54.7% of the market. On-trade sales fell over 2016 to 2021 by a CAGR of −2.9%, while off-trade sales grew by 3.7%, as on-trade took a major hit during the pandemic, with closures affecting beer sales at bars and restaurants and with consumers staying at home.
Over 2021 to 2026, on-trade is expected to see faster sales growth by a CAGR of 7.3% as it rebounds from the pandemic, reaching US$67.5 billion in 2026. Off-trade sales are expected to grow more slowly by a CAGR of 2.9% reaching US$66.2 billion by 2026. Numerous beer categories, especially dark beer, stout, and low/non-alcoholic beer, are expected to see the fastest on-trade sales growth.
| Category | Off-trade / on trade | 2016 | 2021 | CAGR* 2016-2021 | 2022 | 2026 | CAGR* 2021-2026 |
|---|---|---|---|---|---|---|---|
| Beer | Off-trade | 47,808.4 | 57,378.9 | 3.7 | 57,400.5 | 66,169.2 | 2.9 |
| On-trade | 54,937.2 | 47,518.1 | −2.9 | 60,920.2 | 67,548.6 | 7.3 | |
| Dark Beer | Off-trade | 6,014.4 | 7,015.3 | 3.1 | 7,457.0 | 10,504.3 | 8.4 |
| On-trade | 12,408.8 | 10,344.6 | −3.6 | 14,166.6 | 15,777.6 | 8.8 | |
| Lager | Off-trade | 40,772.2 | 48,879.8 | 3.7 | 48,338.5 | 53,560.9 | 1.8 |
| On-trade | 40,661.1 | 35,151.9 | −2.9 | 44,309.3 | 48,342.7 | 6.6 | |
| Non/Low Alcohol Beer | Off-trade | 315.1 | 500.8 | 9.7 | 573.4 | 878.7 | 11.9 |
| On-trade | 418.3 | 415.2 | −0.1 | 485.3 | 691.2 | 10.7 | |
| Stout | Off-trade | 706.6 | 983.0 | 6.8 | 1,031.7 | 1,225.3 | 4.5 |
| On-trade | 1,449.0 | 1,606.4 | 2.1 | 1,959.0 | 2,737.2 | 11.2 | |
|
Source: Euromonitor International, 2022 *CAGR: Compound Annual Growth Rate |
|||||||
Distribution channels
In 2021, the market share of store-based retailing totaled 91.3% with most U.S. consumers purchasing beer from forecourt retailers (gas stations), supermarkets, and traditional grocery retailers. Sales at other grocery retailers grew fastest among store based retailers, by a CAGR of 20.8%, followed by discounters (12.5%), and mass merchandisers (12.0%).
E-commerce beer sales grew the fastest amongst all retail distribution channels, at a CAGR of 35.1% over 2017 to 2021, with growth spiking in 2020. According to Rabobank, in addition to consumers' adoption of E-commerce during the pandemic, changes in U.S. state laws have also buoyed growth in alcohol sales in grocery and E-commerce channels. Ten states representing 12% of the U.S. population have so far passed laws making it easier for grocers to sell alcohol online (particularly by enabling third party delivery) and increasing the market for online alcohol sales.
| Outlet type | 2017 | 2018 | 2019 | 2020 | 2021 | CAGR* 2017-2021 |
|---|---|---|---|---|---|---|
| Grocery Retailers | 93.0 | 92.9 | 92.8 | 91.6 | 91.3 | −0.5 |
| Modern Grocery Retailers | 62.2 | 62.3 | 62.5 | 59.6 | 57.5 | −1.9 |
| Convenience Stores | 7.6 | 7.5 | 7.7 | 6.8 | 6.6 | −3.5 |
| Discounters | 0.5 | 0.5 | 0.6 | 0.8 | 0.8 | 12.5 |
| Forecourt Retailers | 31.8 | 31.9 | 32.3 | 27.6 | 26.7 | −4.3 |
| Hypermarkets | 2.9 | 3.1 | 3.1 | 3.5 | 3.3 | 3.3 |
| Supermarkets | 19.5 | 19.2 | 18.8 | 20.9 | 20.0 | 0.6 |
| Traditional Grocery Retailers | 30.7 | 30.7 | 30.3 | 32.0 | 33.8 | 2.4 |
| Food/drink/tobacco specialists | 23.3 | 23.4 | 23.3 | 24.4 | 23.3 | 0.0 |
| Independent Small Grocers | 4.4 | 4.3 | 4.1 | 4.1 | 3.9 | −3.0 |
| Other Grocery Retailers | 3.1 | 3.0 | 2.9 | 3.5 | 6.6 | 20.8 |
| Non-Grocery Specialists | 2.9 | 2.7 | 2.4 | 2.1 | 2.0 | −8.9 |
| Drugstores/parapharmacies | 2.9 | 2.7 | 2.4 | 2.1 | 2.0 | −8.9 |
| Mixed Retailers | 3.6 | 3.7 | 4.1 | 4.5 | 4.6 | 6.3 |
| Mass Merchandisers | 0.7 | 0.8 | 0.9 | 1.0 | 1.1 | 12.0 |
| Variety Stores | 0.1 | 0.1 | 0.1 | |||
| Warehouse Clubs | 2.9 | 3.0 | 3.1 | 3.4 | 3.5 | 4.8 |
| E-Commerce | 0.6 | 0.6 | 0.7 | 1.8 | 2.0 | 35.1 |
| Total | 100.0 | 100.0 | 100.0 | 100.0 | 100.0 | 0.0 |
|
Source: Euromonitor International, 2022 *CAGR: Compound Annual Growth Rate |
||||||
Competitive landscape
In 2021, the top ten brands in the U.S. represented 59.7% market share. Among them, Michelob Ultra saw the highest market share growth at a CAGR of 17.5% over 2017 to 2021, followed by Modelo (15.4%).
According to Euromonitor, consumers are becoming more mindful of what they drink, and this can be seen with the uptick in sales of no/low alcohol beers, which have growing rapidly. In response, companies are investing in innovative products with claims that meet consumer demands. For example, Anheuser-Busch InBev has announced it is launching the first zero carb beer, Bud Light Next.
Companies such as Athletic Brewing Co and Heineken have also seen immense growth of their non-alcoholic beer brands. Athletic Brewing Co is set to open another facility in California with the backing of notable celebrities and athletes, while AB InBev has pledged one fifth of its total production to go towards the no/low alcohol segment by the year 2025.
U.S. beer drinkers are also shifting to higher quality ingredients out of concerns over ingredient sourcing and sustainability. The pandemic has made consumers develop a more compassionate mindset about community, caring more for the environment, labourers, and supporting smaller businesses. There is an increased willingness to pay more for commodities if it means a higher quality product. The craft industry is expected to largely benefit from this trend, as consumers seek to support local businesses, as well as receive a higher quality beer with fresh ingredients.
| Brand (Company) | 2017 | 2018 | 2019 | 2020 | 2021 | CAGR* 2017-2021 |
|---|---|---|---|---|---|---|
| Bud Light (Anheuser-Busch InBev NV) | 16.6 | 16.1 | 15.3 | 15.0 | 14.4 | −3.5 |
| Coors Light (Molson Coors Brewing Co) | 8.2 | 8.0 | 7.8 | 7.7 | 7.4 | −2.5 |
| Michelob Ultra (Anheuser-Busch InBev NV) | 3.3 | 3.8 | 4.6 | 6.0 | 6.3 | 17.5 |
| Miller Lite (Molson Coors Brewing Co) | 6.3 | 6.2 | 6.3 | 6.4 | 6.3 | 0.0 |
| Modelo Especial (Constellation Brands Inc) | 3.5 | 4.1 | 4.7 | 5.7 | 6.2 | 15.4 |
| Budweiser (Anheuser-Busch InBev NV) | 5.9 | 5.7 | 5.4 | 5.4 | 5.2 | −3.1 |
| Corona Extra (Constellation Brands Inc) | 4.2 | 4.1 | 4.2 | 4.7 | 4.8 | 3.4 |
| Busch Light (Anheuser-Busch InBev NV) | 3.3 | 3.3 | 3.3 | 3.7 | 3.8 | 3.6 |
| Natural Light (Anheuser-Busch InBev NV) | 3.2 | 3.3 | 3.3 | 3.4 | 3.3 | 0.8 |
| Busch (Anheuser-Busch InBev NV) | 2.4 | 2.3 | 2.2 | 2.1 | 2.0 | −4.5 |
| Total | 56.9 | 56.9 | 57.1 | 60.1 | 59.7 | 1.2 |
|
Source: Euromonitor International, 2022 *CAGR: Compound Annual Growth Rate |
||||||
Foreign beer in the United States
In 2021, the US imported US$8.3 billion in beer, growing at a CAGR of 4.7% over 2017 to 2021. Top three supplier markets were Mexico (75.1%), Netherlands (12.0%), and Belgium (3.7%). Canada was the fifth largest beer supplier to the U.S. at a value of US$129 million.
| Market | 2017 | 2018 | 2019 | 2020 | 2021 | CAGR* % 2017-2021 | Market share (%) in 2021 |
|---|---|---|---|---|---|---|---|
| World | 6,917.7 | 7,211.9 | 7,757.4 | 8,001.6 | 8,296.3 | 4.7 | 100 |
| Mexico | 4,428.6 | 4,786.4 | 5,375.0 | 5,685.9 | 6,230.3 | 8.9 | 75.1 |
| Netherlands | 1,086.1 | 1,053.8 | 1,019.8 | 1,155.3 | 998.5 | −2.1 | 12.0 |
| Belgium | 434.3 | 447.2 | 536.3 | 488.3 | 304.2 | −8.5 | 3.7 |
| Ireland | 287.0 | 276.8 | 292.5 | 230.5 | 228.0 | −5.6 | 2.8 |
| Canada | 149.9 | 144.9 | 144.8 | 138.0 | 128.9 | −3.7 | 1.6 |
| Germany | 249.2 | 144.3 | 123.8 | 103.6 | 116.0 | −17.4 | 1.4 |
| Poland | 13.2 | 15.3 | 15.8 | 14.1 | 52.3 | 41.0 | 0.6 |
| Italy | 30.2 | 30.5 | 38.7 | 35.5 | 46.3 | 11.3 | 0.6 |
| Jamaica | 34.1 | 34.4 | 26.7 | 26.3 | 30.5 | −2.8 | 0.4 |
| UK | 65.8 | 30.6 | 27.9 | 19.9 | 19.0 | −26.7 | 0.2 |
|
Source: Global Trade Tracker, 2022 *CAGR: Compound Annual Growth Rate |
|||||||
Over 2017 to 2021, American imports of Canadian beer decreased from US$150 million in 2017 to US$129 million in 2021, at a CAGR of −3.7%. Sales of beer in kegs fell the fastest by a CAGR of −11.0% followed by canned beer (−5.2%).
| HS Code | Description | 2017 | 2018 | 2019 | 2020 | 2021 | CAGR* % 2017-2021 |
|---|---|---|---|---|---|---|---|
| 2203 | Beer | 149.9 | 144.9 | 144.8 | 138.0 | 128.9 | −3.7 |
| 2203000060 | Beer in non-glass containers under 4 liters | 78.6 | 76.5 | 75.1 | 76.9 | 63.5 | −5.2 |
| 2203000030 | Beer in glass containers under 4 liters | 60.9 | 57.9 | 59.2 | 56.7 | 58.9 | −0.9 |
| 2203000090 | Beer in containers over 4 liters | 10.4 | 10.5 | 10.6 | 4.4 | 6.6 | −11.0 |
|
Source: Global Trade Tracker *CAGR: Compound Annual Growth Rate |
|||||||
New product launches
Over 2017 to 2021, 299 craft beer products were launched to the U.S., with the greatest number of new products introduced in 2019. The most popular product claims were environmentally friendly packaging and recycling. Dogfish Head Craft Brewery launched the greatest number of products, followed by Boston Beer.
| Product attributes | Number of new product by year | Total | ||||
|---|---|---|---|---|---|---|
| 2017 | 2018 | 2019 | 2020 | 2021 | ||
| Yearly product launches | 33 | 44 | 93 | 58 | 71 | 299 |
| Top 5 claims | ||||||
| Ethical - Environmentally Friendly Package | 12 | 29 | 56 | 39 | 43 | 179 |
| Ethical - Recycling | 11 | 28 | 55 | 39 | 42 | 175 |
| Social Media | 3 | 7 | 24 | 11 | 21 | 66 |
| Seasonal | 3 | 7 | 12 | 8 | 8 | 38 |
| Not Specified | 9 | 3 | 9 | 7 | 8 | 36 |
| Top 5 companies | ||||||
| Dogfish Head Craft Brewery | 6 | 3 | 5 | 1 | 1 | 16 |
| Boston Beer | 1 | 0 | 8 | 1 | 1 | 11 |
| New Belgium Brewing | 1 | 2 | 5 | 2 | 0 | 10 |
| Blue Moon Brewing | 3 | 3 | 0 | 0 | 0 | 6 |
| Lavery Brewing | 0 | 0 | 2 | 1 | 3 | 6 |
| Top 5 flavours (including blend) | ||||||
| Unflavoured/Plain | 26 | 31 | 75 | 44 | 58 | 234 |
| Honey | 1 | 2 | 0 | 1 | 0 | 4 |
| Pumpkin/Squash | 0 | 1 | 2 | 0 | 1 | 4 |
| Lemon | 0 | 0 | 3 | 0 | 0 | 3 |
| Orange/Sweet Orange | 0 | 2 | 1 | 0 | 0 | 3 |
| Top 5 package types | ||||||
| Can | 11 | 19 | 56 | 41 | 54 | 181 |
| Bottle | 22 | 25 | 36 | 17 | 17 | 117 |
| Not Specified | 0 | 0 | 1 | 0 | 0 | 1 |
| Launch types | ||||||
| New Variety/Range Extension | 15 | 22 | 60 | 31 | 25 | 153 |
| New Packaging | 13 | 10 | 16 | 12 | 17 | 68 |
| New Product | 5 | 8 | 10 | 14 | 27 | 64 |
| Relaunch | 0 | 4 | 7 | 1 | 2 | 14 |
| Source: Mintel GNPD, 2022 | ||||||
Examples of new products
Light Craft Lager
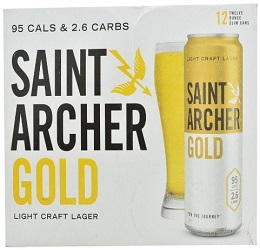
Source: Mintel GNPD
| Company | Saint Archer Brewing |
|---|---|
| Launch type | New product |
| Price in US dollars | 14.99 |
| Product description | Saint Archer Gold Light Craft Lager contains 95 calories and 2.6 carbs per can. The product retails in a recyclable pack, containing 12 12 ounce slim cans. |
Claims: Ethical (vegan / no animal ingredients, social media).
Pecan Porter
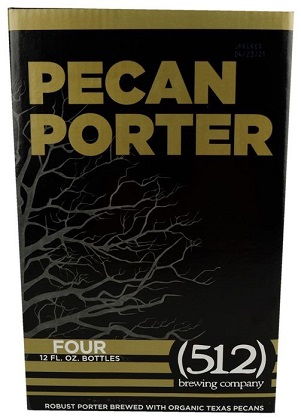
Source: Mintel GNPD
| Company | (512) Brewing |
|---|---|
| Launch type | New product |
| Price in US dollars | 9.99 |
| Product description | (512) Brewing Co Pecan Porter is described as a robust porter brewed with organic Texas pecans and carbonated using Earthly Labs CO2 collection system, which collects and purifies CO2 directly from primary fermentation. The vegan conscious craft beer is 83% organic, and retails in a recyclable pack of four 12 ounce bottles with YouTube link. The brewer is part of the Certified Independent Craft Brewers Association. |
Claims: Organic, Ethical (environmentally friendly package, vegan/no animal ingredients, recycling), Social media.
Mama's Keys Key Lime Pie Gose
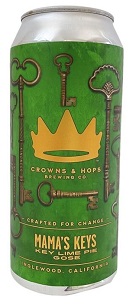
Source: Mintel GNPD
| Company | Crowns & Hops Brewing Co. |
|---|---|
| Launch type | New product |
| Price in US dollars | 5.99 |
| Product description | This vegan friendly product has been brewed with key lime puree, cinnamon, coriander, sea salt, vanilla, and graham crackers. It retails in a 1-pint pack featuring a QR code and the Certified Independent Craft Brewers Association, Instagram, Facebook and Twitter logos. |
Claims: Ethical (vegan/no animal ingredients, social media).
Black Is Beautiful Imperial Stout
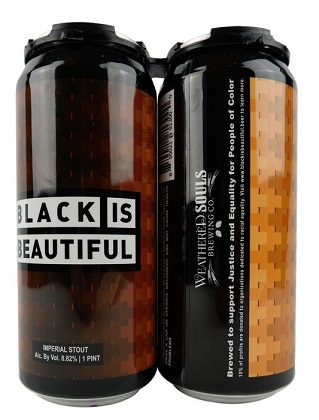
Source: Mintel GNPD
| Company | Weathered Souls Brewing |
|---|---|
| Launch type | New product |
| Price in US dollars | 9.98 |
| Product description | Weathered Souls Brewing Co. Black Is Beautiful Imperial Stout is said to be brewed to support justice and equality for people of colour. The kosher product retails in a 100% recycled and recyclable pack of two 1 pint cans, bearing the Independent Craft Brewers Association Certified logo. The manufacturer claims to donate 10% of profits to organizations dedicated to racial equality. |
Claims: Kosher, Ethical (environmentally friendly package, charity, recycling).
For more information
The Canadian Trade Commissioner Service:
International Trade Commissioners can provide Canadian industry with on-the-ground expertise regarding market potential, current conditions and local business contacts, and are an excellent point of contact for export advice.
More agri-food market intelligence:
International agri-food market intelligence
Discover global agriculture and food opportunities, the complete library of Global Analysis reports, market trends and forecasts, and information on Canada's free trade agreements.
Agri-food market intelligence service
Canadian agri-food and seafood businesses can take advantage of a customized service of reports and analysis, and join our email subscription service to have the latest reports delivered directly to their inbox.
More on Canada's agriculture and agri-food sectors:
Canada's agriculture sectors
Information on the agriculture industry by sector. Data on international markets. Initiatives to support awareness of the industry in Canada. How the department engages with the industry.
For additional information on the National Beer Wholesalers Association' Annual Convention & Product Showcase, please contact:
Matthew C Waldron
Trade Commissioner
matthew.waldron@international.gc.ca
Telephone: 305-579-1610
Resources
- Euromonitor International: Beer in the USA (July 2022)
- Rabobank: 2022 Alcohol E-commerce Playbook (December 2021)
- Mintel GNPD, 2022
- Global Trade Tracker, 2022
Customized Report Services – Sector Trend Analysis – Beer in the United States
Global Analysis Report
Prepared by: Kris Clipsham, Market Analyst
© His Majesty the King in Right of Canada, represented by the Minister of Agriculture and Agri-Food (2022).
Photo credits
All photographs reproduced in this publication are used by permission of the rights holders.
All images, unless otherwise noted, are copyright His Majesty the King in Right of Canada.
To join our distribution list or to suggest additional report topics or markets, please contact:
Agriculture and Agri-Food Canada, Global Analysis1341 Baseline Rd, Tower 5, 3rd floor
Ottawa ON K1A 0C5
Canada
Email: aafc.mas-sam.aac@agr.gc.ca
The Government of Canada has prepared this report based on primary and secondary sources of information. Although every effort has been made to ensure that the information is accurate, Agriculture and Agri-Food Canada (AAFC) assumes no liability for any actions taken based on the information contained herein.
Reproduction or redistribution of this document, in whole or in part, must include acknowledgement of agriculture and agri-food Canada as the owner of the copyright in the document, through a reference citing AAFC, the title of the document and the year. Where the reproduction or redistribution includes data from this document, it must also include an acknowledgement of the specific data source(s), as noted in this document.
Agriculture and Agri-Food Canada provides this document and other report services to agriculture and food industry clients free of charge.