

Note: This report includes forecasting data that is based on baseline historical data.
Executive summary
Of the major meat suppliers to the United States (US) by value, Canada was ranked as the largest (valued at US$4,360.3 million in 2021 and accounted for 32.5% of the market share in US in 2021. Canada increased at a compound annual growth rate (CAGR) of 11.9% from 2017 to 2021.
In 2021, the top three Canada meat products exported to the US were frozen meat of swine at US$1,880.4 million, fresh/chilled meat of swine at US$818.5 million and fresh or chilled bovine cuts at US$364.8 million. Fresh or chilled bovine cuts recorded the highest CAGR of 32.3% from 2017 to 2021.
In terms of export volume by province, Alberta exported 306.5 thousand tonnes of meat to the USA in 2021, followed by Ontario at 261.8 thousand tonnes and Quebec at 210.2 thousand tonnes.
The top three meat products that Alberta exported to the US in 2021 were: fresh or chilled bovine meat at US$1,482.1 million; fresh or chilled bovine cuts at US$312.1 million; and frozen edible bovine offal at US$86.8 million. Fresh or chilled bovine cuts had the biggest growth at a CAGR of 39.6% from 2017 to 2021.
The total volume of sales of meat in the US reached 21,220.2 thousand tonnes in 2021. Poultry accounted for the largest volume of meat sold in USA in 2021 at 10,314 thousand tonnes (almost 50% of the total meat sales), followed by beef and veal at 7,149.6 thousand tonnes and pork at 3,525.0 thousand tonnes. Beef and veal had the highest CAGR of 2.3%.
The retail sales value of the US meat sector increased from US$85,218.9 million in 2016 to US$89,919.3 million in 2021, registering a CAGR of 1.1%.
United States' meat production
For the market year 2022, US meat production (beef and veal, pork and chicken) totaled 45,618 thousand tonnes, with beef and veal accounting for 12,724 thousand tonnes, chicken for 20,568 thousand tonnes and pork for 12,326 thousand tonnes. All of their production saw moderate growth from 2017 to 2022
| Commodity | 2017 | 2018 | 2019 | 2020 | 2021 | 2022 | CAGR* % 2017-2022 |
|---|---|---|---|---|---|---|---|
| Beef and Veal | 11,943 | 12,256 | 12,385 | 12,389 | 12,734 | 12,724 | 1.3 |
| Chicken | 18,938 | 19,361 | 19,941 | 20,255 | 20,391 | 20,568 | 1.7 |
| Swine | 11,611 | 11,943 | 12,543 | 12,845 | 12,560 | 12,326 | 1.2 |
| Total | 42,492 | 43,560 | 44,869 | 45,489 | 45,685 | 45,618 | 1.4 |
|
Source: United States Department of Agriculture (USDA) 2021 *CAGR: Compound Annual Growth Rate |
|||||||
Chickens and pigs are the US's primary livestock, producing 9.2 billion and 77.3 million heads respectively in 2020. Only sheep experienced declining CAGR of 0.5% from 2016 to 2020. Pigs in particular, experienced the largest increase in CAGR (2.0%) as volume of livestock production increased from 71.3 million heads in 2016 to 77.3 million heads in 2020.
| Livestock (head) | 2016 | 2017 | 2018 | 2019 | 2020 | CAGR* % 2017-2022 |
|---|---|---|---|---|---|---|
| Chickens | 8,776,700,000 | 8,913,800,000 | 175,772,000 | 9,038,300,000 | 9,222,100,000 | 1.2 |
| Pigs | 71,345,400 | 73,144,900 | 75,070,200 | 78,227,600 | 77,312,000 | 2.0 |
| Horses | 10,261,593 | 10,404,177 | 10,436,104 | 10,481,944 | 10,527,653 | 0.6 |
| Ducks | 7,478,000 | 7,548,000 | 7,584,000 | 7,656,000 | 7,689,000 | 0.7 |
| Sheep | 5,295,000 | 5,270,000 | 5,265,000 | 5,230,000 | 5,200,000 | −0.5 |
| Goats | 2,615,000 | 2,627,000 | 2,639,000 | 2,622,000 | 2,655,000 | 0.4 |
| Source: FAOSTAT Agricultural Production, 2022 | ||||||
The United States' trade summary
Of the major meat suppliers to US by value, Canada was ranked as the largest (valued at US$4,360.3 million in 2021) and accounted for 32.5% of the market share in US in 2021. Canada increased at a CAGR of 11.9% from 2017 to 2021. Due to the strong demand for meat, all of the top 10 countries exporting meat to US had a steady CAGR from 2017 to 2021, ranging from 31.3% (Brazil) to as low as 2.8% (Australia).
| Country | 2017 | 2018 | 2019 | 2020 | 2021 | CAGR* % 2017-2021 | Market share % in 2021 |
|---|---|---|---|---|---|---|---|
| World | 9,052.5 | 9,411.2 | 9,836.5 | 10,543.4 | 13,401.1 | 10.3 | 100.0 |
| Canada | 2,776.9 | 2,853.1 | 3,024.7 | 3,124.4 | 4,360.3 | 11.9 | 32.5 |
| Australia | 2,126.2 | 2,134.7 | 2,425.2 | 2,373.0 | 2,373.6 | 2.8 | 17.7 |
| Mexico | 1,166.2 | 1,239.1 | 1,418.8 | 1,620.6 | 2,160.7 | 16.7 | 16.1 |
| New Zealand | 1,218.1 | 1,318.4 | 1,071.2 | 1249.7 | 1,432.2 | 4.1 | 10.7 |
| Brazil | 294.8 | 304.7 | 356.7 | 456.4 | 874.9 | 31.3 | 6.5 |
| Nicaragua | 213.2 | 244.7 | 304.7 | 327.0 | 385.8 | 16.0 | 2.9 |
| Chile | 160.1 | 185.4 | 171.6 | 206.0 | 326.1 | 19.5 | 2.4 |
| Uruguay | 246.5 | 244.2 | 267.5 | 316.8 | 314.9 | 6.3 | 2.3 |
| Italy | 123.3 | 141.1 | 147.1 | 142.5 | 202.7 | 13.2 | 1.5 |
| Denmark | 153.9 | 152.6 | 111.4 | 135.4 | 190.2 | 5.4 | 1.4 |
|
Source: Global Trade Tracker, 2022 *CAGR: Compound Annual Growth Rate |
|||||||
Of the major meat suppliers to US by volume, Canada ranked as the largest in 2021, exporting 803.3 thousand tonnes and accounting for 38.2% of the of the market share in US. Canada increased at a CAGR of 3.3% from 2017 to 2021. Among the top 10 suppliers, Brazil reached the highest CAGR of 29.5% from 2017 to 2021.
| Country | 2017 | 2018 | 2019 | 2020 | 2021 | CAGR* % 2017-2021 | Market share % in 2021 |
|---|---|---|---|---|---|---|---|
| World | 1,852.7 | 1,833.7 | 1,810.9 | 1,899.8 | 2,102.8 | 3.2 | 100.0 |
| Canada | 706.5 | 676.2 | 672.0 | 665.0 | 803.3 | 3.3 | 38.2 |
| Mexico | 247.4 | 229.4 | 259.4 | 298.6 | 327.6 | 7.3 | 15.6 |
| Australia | 334.3 | 332.5 | 353.5 | 340.1 | 282.8 | −4.1 | 13.4 |
| New Zealand | 222.4 | 225.5 | 165.7 | 201.6 | 207.5 | −1.7 | 9.9 |
| Brazil | 42.7 | 43.8 | 49.9 | 69.3 | 120.2 | 29.5 | 5.7 |
| Chile | 43.9 | 51.9 | 51.9 | 60.3 | 70.1 | 12.4 | 3.3 |
| Nicaragua | 46.1 | 54.4 | 63.6 | 65.8 | 68.0 | 10.2 | 3.2 |
| Uruguay | 41.8 | 40.1 | 40.9 | 48.9 | 45.6 | 2.2 | 2.2 |
| Denmark | 33.9 | 38.5 | 27.4 | 29.2 | 39.1 | 3.6 | 1.9 |
| Poland | 70.7 | 71.2 | 56.2 | 30.6 | 34.4 | −16.5 | 1.6 |
|
Source: Global Trade Tracker, 2022 *CAGR: Compound Annual Growth Rate |
|||||||
In 2021, the top three Canada meat products exported to the US were frozen meat of swine at US$1,880.4 million, fresh/chilled meat of swine at US$618.5 million and fresh or chilled bovine cuts at US$364.8 million. Fresh or chilled bovine cuts recorded the highest CAGR of 32.3% from 2017 to 2021.
| HS code | Description | 2017 | 2018 | 2019 | 2020 | 2021 | CAGR* % 2017-2021 |
|---|---|---|---|---|---|---|---|
| Total | 2,777.4 | 2,853.0 | 3,024.8 | 3,124.3 | 4,360.2 | 11.9 | |
| 020130 | Fresh or chilled bovine meat, boneless | 1,041.1 | 1,186.4 | 1,365.6 | 1,353.0 | 1,880.4 | 15.9 |
| 020319 | Fresh or chilled meat of swine | 582.0 | 494.9 | 441.6 | 432.3 | 618.5 | 1.5 |
| 020120 | Fresh or chilled bovine cuts, with bone in | 119.2 | 163.5 | 168.9 | 252.6 | 364.8 | 32.3 |
| 160232 | Meat or offal of fowls of the species prepared or preserved | 179.7 | 202.2 | 211.5 | 230.8 | 274.5 | 11.2 |
| 020312 | Fresh or chilled hams, shoulders and cuts thereof of swine, with bone in | 173.7 | 131.2 | 125.2 | 127.0 | 187.0 | 1.9 |
| 020329 | Frozen meat of swine | 97.0 | 92.3 | 86.3 | 71.9 | 137.9 | 9.2 |
| 021012 | Bellies "streaky" and cuts thereof of swine, salted, in brine, dried or smoked | 64.4 | 57.3 | 80.7 | 99.0 | 133.9 | 20.1 |
| 020230 | Frozen, boneless meat of bovine animals | 41.7 | 45.3 | 44.3 | 47.8 | 103.9 | 25.6 |
| 020629 | Frozen edible bovine offal (excluding tongues and livers) | 40.1 | 47.6 | 62.7 | 70.9 | 101.7 | 26.2 |
| 160241 | Hams of swine and cuts thereof, prepared or preserved | 30.8 | 42.7 | 58.3 | 67.1 | 83.5 | 28.3 |
|
Source: Global Trade Tracker, 2022 *CAGR: Compound Annual Growth Rate |
|||||||
In terms of trade volume, Canada's top exports in 2021 were fresh or chilled bovine meat at 267.8 thousand tonnes, and fresh/chilled meat of swine at 167.7 thousand tonnes. Fresh or chilled edible offal of swine had the highest CAGR of 21.3% from 2017 to 2021.
| HS code | Description | 2017 | 2018 | 2019 | 2020 | 2021 | CAGR* % 2017-2021 |
|---|---|---|---|---|---|---|---|
| Total | 706.4 | 676.2 | 671.6 | 664.7 | 803.3 | 3.3 | |
| 020130 | Fresh or chilled bovine meat, boneless | 220.9 | 236.6 | 255.8 | 242.2 | 267.8 | 4.9 |
| 020319 | Fresh or chilled meat of swine | 175.6 | 151.8 | 134.5 | 135.2 | 167.7 | −1.1 |
| 020312 | Fresh or chilled hams, shoulders and cuts thereof of swine, with bone in | 72.6 | 54.1 | 47.6 | 46.7 | 63.5 | −3.3 |
| 020329 | Frozen meat of swine | 39.6 | 39.2 | 35.7 | 25.5 | 45.2 | 3.4 |
| 160232 | Meat or offal of fowls of the species | 33.0 | 35.3 | 34.3 | 36.2 | 39.9 | 4.9 |
| 020120 | Fresh or chilled bovine cuts, with bone in | 15.5 | 18.9 | 19.5 | 25.3 | 29.2 | 17.2 |
| 021012 | Bellies "streaky" and cuts thereof of swine, salted, in brine, dried or smoked | 14.6 | 12.7 | 17.7 | 20.4 | 24.4 | 13.7 |
| 020230 | Frozen, boneless meat of bovine animals | 9.6 | 8.9 | 9.6 | 10.6 | 20.2 | 20.4 |
| 020629 | Frozen edible bovine offal (excluding tongues and livers) | 13.9 | 12.0 | 15.7 | 16.0 | 17.4 | 5.8 |
| 020630 | Fresh or chilled edible offal of swine | 6.6 | 7.5 | 5.5 | 10.0 | 14.3 | 21.3 |
|
Source: Global Trade Tracker, 2022 *CAGR: Compound Annual Growth Rate |
|||||||
Canada's meat export to the United States by provinces
In terms of export value broken down by Canadian provinces, Alberta led with a value of US$2,121.4 million in 2021, which accounted for 48.7% of Canada's total meat exports to the US. Ontario ranked second, exporting US$1,034 million of meat in 2021, followed by Quebec at US$838.1 million.
| Province | 2017 | 2018 | 2019 | 2020 | 2021 | CAGR* % 2017-2021 | Market share % |
|---|---|---|---|---|---|---|---|
| Total | 2,784.2 | 2,862.6 | 3,022.1 | 3,122.0 | 4,357.7 | 11.9 | 100 |
| Alberta | 1,078.1 | 1,215.3 | 1,373.3 | 1,473.1 | 2,121.4 | 18.4 | 48.7 |
| Ontario | 687.1 | 666.0 | 684.2 | 729.6 | 1,034.7 | 10.8 | 23.7 |
| Quebec | 826.3 | 800.7 | 765.7 | 703.9 | 838.1 | 0.4 | 19.2 |
| Manitoba | 171.5 | 161.1 | 173.5 | 185.7 | 318.3 | 16.7 | 7.3 |
| British Columbia | 15.0 | 15.8 | 16.5 | 19.4 | 27.3 | 16.2 | 0.6 |
| Saskatchewan | 4.8 | 2.5 | 7.9 | 9.6 | 12.7 | 27.5 | 0.3 |
| New Brunswick | 1.2 | 1.1 | 0.9 | 0.7 | 5.2 | 44.3 | 0.1 |
|
Source: Global Trade Tracker, 2022 *CAGR: Compound Annual Growth Rate |
|||||||
In terms of export volume by province, Alberta exported 306.5 thousand tonnes of meat to the US in 2021, followed by Ontario at 261.8 thousand tonnes and Quebec at 210.2 thousand tonnes.
| Province | 2017 | 2018 | 2019 | 2020 | 2021 | CAGR* % 2017-2021 |
|---|---|---|---|---|---|---|
| Total | 775.9 | 747.0 | 736.2 | 731.0 | 873.7 | 3.0 |
| Alberta | 240.6 | 247.3 | 259.9 | 263.7 | 306.5 | 6.2 |
| Ontario | 215.9 | 206.9 | 202.3 | 213.1 | 261.8 | 4.9 |
| Quebec | 257.8 | 235.2 | 215.5 | 190.9 | 210.2 | −5.0 |
| Manitoba | 53.6 | 50.3 | 50.5 | 55.7 | 83.0 | 11.6 |
| British Columbia | 6.6 | 6.2 | 6.1 | 5.6 | 7.5 | 3.2 |
| New Brunswick | 0.5 | 0.5 | 0.4 | 0.4 | 2.9 | 55.2 |
| Saskatchewan | 0.9 | 0.5 | 1.4 | 1.6 | 1.8 | 18.9 |
|
Source: Global Trade Tracker, 2021 *CAGR: Compound Annual Growth Rate |
||||||
1) Alberta
The top three meat products that Alberta exported to the US in 2021 were: fresh or chilled bovine meat at US$1,482.1 million; fresh or chilled bovine cuts at US$312.1 million; and frozen edible bovine offal at US$86.8 million. Fresh or chilled bovine cuts had the biggest growth at a CAGR of 39.6% from 2017 to 2021.
| HS code | Description | 2017 | 2018 | 2019 | 2020 | 2021 | CAGR* % 2017-2021 |
|---|---|---|---|---|---|---|---|
| Total | 1,078.2 | 1,215.3 | 1,373.6 | 1,472.9 | 2,121.2 | 18.4 | |
| 020130 | Fresh or chilled bovine meat, boneless | 767.3 | 904.3 | 1,055.1 | 1,049.1 | 1,482.1 | 17.9 |
| 020120 | Fresh or chilled bovine cuts, bone in | 82.1 | 122.6 | 130.7 | 216.9 | 312.1 | 39.6 |
| 020629 | Frozen edible bovine offal | 31.6 | 36.4 | 50.8 | 59.0 | 86.8 | 28.7 |
| 020319 | Fresh or chilled meat of swine | 83.2 | 55.0 | 36.7 | 38.9 | 59.4 | −8.1 |
| 020230 | Frozen, boneless meat of bovine animals | 26.3 | 27.2 | 28.8 | 32.1 | 56.8 | 21.2 |
| 160232 | Meat or offal of fowls of the species, prepared or preserved | 11.9 | 15.9 | 19.7 | 23.3 | 27.7 | 23.5 |
| 020610 | Fresh or chilled edible offal of bovine animals | 26.0 | 16.2 | 20.1 | 12.4 | 26.6 | 0.6 |
| 020312 | Fresh or chilled hams, shoulders and cuts thereof of swine, with bone in | 11.1 | 5.2 | 2.0 | 8.6 | 26.0 | 23.7 |
| 020329 | Frozen meat of swine | 15.1 | 12.7 | 10.4 | 11.5 | 15.2 | 0.2 |
| 020621 | Frozen edible bovine tongues | 9.7 | 6.6 | 7.0 | 7.6 | 10.8 | 2.7 |
|
Source: Global Trade Tracker, 2022 *CAGR: Compound Annual Growth Rate |
|||||||
2) Ontario
The top three meat products that Ontario exported to the US in 2021 were: fresh or chilled bovine meat, boneless at a value of US$380.5 million, fresh or chilled meat of swine at a value of US$253.3 million and frozen, boneless meat of bovine animals at a value of US$40.8 million. Frozen, boneless meat of bovine animals had a fastest growth of CAGR 64.3% from 2017 to 2021.
| HS code | Description | 2017 | 2018 | 2019 | 2020 | 2021 | CAGR* % 2017-2021 |
|---|---|---|---|---|---|---|---|
| Total | 686.8 | 666.0 | 684.1 | 729.7 | 1,034.6 | 10.8 | |
| 020130 | Fresh or chilled bovine meat, boneless | 252.9 | 261.5 | 288.6 | 289.5 | 380.5 | 10.8 |
| 020319 | Fresh or chilled meat of swine | 188.8 | 158.5 | 154.2 | 152.8 | 253.3 | 7.6 |
| 020230 | Frozen, boneless meat of bovine animals | 5.6 | 9.7 | 9.0 | 10.2 | 40.8 | 64.3 |
| 020120 | Fresh or chilled bovine cuts, with bone in | 21.3 | 23.8 | 20.3 | 23.2 | 38.1 | 15.7 |
| 020329 | Frozen meat of swine | 36.7 | 30.3 | 20.1 | 22.9 | 28.7 | −6.0 |
| 160241 | Hams of swine and cuts thereof, prepared or preserved | 4.3 | 7.5 | 12.2 | 18.9 | 26.5 | 57.6 |
| 160100 | Sausages and similar products, of meat, offal or blood; food preparations based on these products | 16.3 | 18.0 | 22.9 | 23.9 | 25.7 | 12.1 |
| 160232 | Meat or offal of fowls of the species , prepared or preserved | 20.9 | 23.5 | 16.0 | 12.5 | 24.1 | 3.6 |
| 020714 | Frozen cuts and edible offal of fowls of the species | 13.1 | 21.2 | 16.0 | 21.2 | 23.8 | 16.1 |
| 020610 | Fresh or chilled edible offal of bovine animals | 15.2 | 16.5 | 16.9 | 14.8 | 22.5 | 10.3 |
|
Source: Global Trade Tracker, 2022 *CAGR: Compound Annual Growth Rate |
|||||||
3) Quebec
The top three meat products that Quebec exported to the US in 2021 were: meat or offal of fowls of the species prepared or preserved at a value of US$221.9 million, fresh or chilled meat of swine at a value of US$214.9 million and fresh or chilled hams, shoulders and cuts thereof of swine at a value of US69.1 million.
| HS code | Description | 2017 | 2018 | 2019 | 2020 | 2021 | CAGR* % 2017-2021 |
|---|---|---|---|---|---|---|---|
| Total | 826.1 | 800.7 | 765.4 | 703.9 | 838.2 | 0.4 | |
| 160232 | Meat or offal of fowls of the species prepared or preserved | 146.7 | 162.1 | 175.2 | 194.8 | 221.9 | 10.9 |
| 020319 | Fresh or chilled meat of swine | 251.4 | 232.3 | 212.1 | 202.1 | 214.9 | −3.9 |
| 020312 | Fresh or chilled hams, shoulders and cuts thereof of swine, with bone in | 105.5 | 88.5 | 87.2 | 59.8 | 69.1 | −10.0 |
| 020329 | Frozen meat of swine | 41.9 | 43.4 | 34.6 | 26.6 | 57.3 | 8.1 |
| 021012 | Bellies "streaky" and cuts thereof of swine, salted, in brine, dried or smoked | 32.1 | 32.1 | 34.6 | 37.4 | 49.4 | 11.4 |
| 020713 | Fresh or chilled cuts and edible offal of fowls of the species gallus domesticus | 26.0 | 25.6 | 38.3 | 35.3 | 39.2 | 10.8 |
| 160250 | Prepared or preserved meat or offal of bovine animals | 26.4 | 35.6 | 39.7 | 28.7 | 33.1 | 5.8 |
| 020110 | Carcases or half-carcases of bovine animals, fresh or chilled | 25.4 | 27.8 | 15.6 | 15.2 | 25.1 | −0.3 |
| 160241 | Hams of swine and cuts thereof, prepared or preserved | 23.2 | 24.3 | 25.1 | 21.4 | 22.7 | −0.5 |
| 020130 | Fresh or chilled bovine meat, boneless | 19.6 | 19.7 | 20.1 | 12.8 | 17.1 | −3.4 |
|
Source: Global Trade Tracker, 2022 *CAGR: Compound Annual Growth Rate |
|||||||
4) Manitoba
The top three meat products that Manitoba exported to the US in 2021 were: fresh or chilled meat of swine at a value of US$89.9 million, fresh or chilled hams, shoulders and cuts thereof of swine at a value of US$69.2 million and bellies "streaky" and cuts thereof of swine at a value of US$64.3 million. The fastest growth from 2017 to 2021 was fresh or chilled edible offal of sheep, goats, horses, asses, mules and hinnies at a CAGR of 425.0%.
| HS code | Description | 2017 | 2018 | 2019 | 2020 | 2021 | CAGR* % 2017-2021 |
|---|---|---|---|---|---|---|---|
| Total | 171.3 | 161.3 | 173.4 | 185.8 | 318.4 | 16.8 | |
| 020319 | Fresh or chilled meat of swine | 56.4 | 48.1 | 37.1 | 37.8 | 89.9 | 12.4 |
| 020312 | Fresh or chilled hams, shoulders and cuts thereof of swine, with bone in | 38.3 | 25.6 | 26.9 | 47.2 | 69.2 | 15.9 |
| 021012 | Bellies "streaky" and cuts thereof of swine, salted, in brine, dried or smoked | 23.3 | 18.3 | 34.3 | 48.1 | 64.3 | 28.9 |
| 020329 | Frozen meat of swine | 11.7 | 15.6 | 19.1 | 9.8 | 35.0 | 31.5 |
| 160241 | Hams of swine and cuts thereof, prepared or preserved | 3.1 | 10.8 | 20.9 | 26.7 | 34.0 | 82.0 |
| 020649 | Edible offal of swine, frozen (excluding livers) | 13.7 | 15.0 | 17.8 | 8.0 | 13.1 | −1.1 |
| 020630 | Fresh or chilled edible offal of swine | 0.2 | 0.5 | 0.2 | 1.2 | 4.2 | 114.1 |
| 021019 | Meat of swine, salted, in brine, dried or smoked | 0.9 | 0.2 | 4.9 | 2.9 | 2.8 | 32.8 |
| 020680 | Fresh or chilled edible offal of sheep, goats, horses, asses, mules and hinnies | 0.0 | 0.0 | 0.0 | 0.4 | 2.1 | 425.0 |
| 020322 | Frozen hams, shoulders and cuts thereof of swine, with bone in | 3.5 | 0.5 | 0.2 | 2.2 | 1.4 | −20.5 |
|
Source: Global Trade Tracker, 2022 *CAGR: Compound Annual Growth Rate |
|||||||
5) British Columbia
The top three meat products that British Columbia exported to the US in 2021 were: frozen fowls of the species gallus domesticus at a value of US$7.4 million, preparations of liver of any animal at a value of US$6.7 million.The fastest CAGR growth from 2017 to 2021 were prepared or preserved meat or offal of bovine animals and meat or offal of fowls of the species prepared or preserved both at a CAGR of 41.4%.
| HS code | Description | 2017 | 2018 | 2019 | 2020 | 2021 | CAGR* % 2017-2021 |
|---|---|---|---|---|---|---|---|
| Total | 14.8 | 15.7 | 16.4 | 19.3 | 27.3 | 16.5 | |
| 020712 | Frozen fowls of the species gallus domesticus, not cut in pieces | 4.9 | 5.2 | 5.5 | 6.2 | 7.4 | 10.9 |
| 160220 | Preparations of liver of any animal | 0.0 | 0.0 | 0.1 | 0.5 | 6.7 | N/C[1] |
| 160249 | Prepared or preserved meat and offal of swine, incl. mixtures | 1.3 | 1.5 | 1.4 | 4.0 | 3.4 | 27.2 |
| 160100 | Sausages and similar products, of meat, offal or blood; food preparations based on these products | 2.5 | 2.9 | 2.8 | 3.1 | 2.2 | −3.2 |
| 160250 | Prepared or preserved meat or offal of bovine animals | 0.5 | 0.4 | 0.5 | 1.5 | 2.0 | 41.4 |
| 020713 | Fresh or chilled cuts and edible offal of fowls of the species gallus domesticus | 1.4 | 1.6 | 1.5 | 0.9 | 1.3 | −1.8 |
| 020711 | Fresh or chilled fowls of the species gallus domesticus, not cut in pieces | 0.8 | 1.2 | 1.1 | 0.2 | 0.9 | 3.0 |
| 020319 | Fresh or chilled meat of swine | 1.5 | 0.5 | 1.4 | 0.2 | 0.9 | −12.0 |
| 160232 | Meat or offal of fowls of the species prepared or preserved | 0.2 | 0.7 | 0.5 | 0.2 | 0.8 | 41.4 |
| 020714 | Frozen cuts and edible offal of fowls of the species gallus domesticus | 0.4 | 0.5 | 0.7 | 0.7 | 0.6 | 10.7 |
|
Source: Global Trade Tracker, 2022 *CAGR: Compound Annual Growth Rate 1: Non Calculable |
|||||||
6) Saskatchewan
The top three meat products that Saskatchewan exported to the US in 2021 were: prepared or preserved meat and offal of swine, incl. mixtures at a value of US$10.5 million, sausages and similar products, of meat, offal or blood; food preparations based on these products at a value of US$1.0 million and fresh or chilled hams, shoulders and cuts thereof of swine, with bone at a value of US$0.7 million.
| HS code | Description | 2017 | 2018 | 2019 | 2020 | 2021 | CAGR* % 2017-2021 |
|---|---|---|---|---|---|---|---|
| Total | 4.9 | 2.5 | 7.9 | 9.5 | 12.7 | 26.9 | |
| 160249 | Prepared or preserved meat and offal of swine, incl. mixtures | 0.0 | 1.3 | 6.2 | 7.5 | 10.5 | 100.6 |
| 160100 | Sausages and similar products, of meat, offal or blood; food preparations based on these products | 1.2 | 0.5 | 0.8 | 1.0 | 1.0 | −4.5 |
| 020312 | Fresh or chilled hams, shoulders and cuts thereof of swine, with bone in | 0.0 | 0.0 | 0.0 | 0.1 | 0.7 | 600.0 |
| 020230 | Frozen, boneless meat of bovine animals | 2.8 | 0.3 | 0.3 | 0.3 | 0.3 | −42.8 |
| 020649 | Edible offal of swine, frozen (excluding livers) | 0.0 | 0.0 | 0.0 | 0.0 | 0.2 | N/C[1] |
|
Source: Global Trade Tracker, 2022 *CAGR: Compound Annual Growth Rate 1: Non Calculable |
|||||||
7) New Brunswick
The top three meat products that New Brunswick exported to the US in 2021 were: sausages and similar products, of meat, offal or blood; food preparations at a value of US$4.5 million, bellies "streaky" and cuts thereof of swine, salted, in brine, dried or smoked at value of US$0.4 million and frozen meat of swine at a value of US$0.2 million. Sausages and similar products, of meat, offal or blood; food preparations had the fastest CAGR growth of 117.8% from 2017 to 2021.
| HS code | Description | 2017 | 2018 | 2019 | 2020 | 2021 | CAGR* % 2017-2021 |
|---|---|---|---|---|---|---|---|
| Total | 1.1 | 1.0 | 1.0 | 0.8 | 5.3 | 48.2 | |
| 160100 | Sausages and similar products, of meat, offal or blood; food preparations based on these products | 0.2 | 0.2 | 0.4 | 0.3 | 4.5 | 117.8 |
| 021012 | Bellies "streaky" and cuts thereof of swine, salted, in brine, dried or smoked | 0.7 | 0.6 | 0.5 | 0.4 | 0.4 | −13.1 |
| 020329 | Frozen meat of swine | 0.1 | 0.0 | 0.1 | 0.0 | 0.2 | 18.9 |
| 160232 | Meat or offal of fowls of the species "gallus domesticus", prepared or preserved | 0.1 | 0.0 | 0.0 | 0.1 | 0.1 | N/C[1] |
| 020319 | Fresh or chilled meat of swine | 0.0 | 0.1 | 0.0 | 0.0 | 0.1 | N/C[1] |
|
Source: Global Trade Tracker, 2022 *CAGR: Compound Annual Growth Rate 1: Non Calculable |
|||||||
It is important for Canadian exporters to work closely with their importing partners to ensure that the US import requirements are met and that the necessary documentation is provided. Please note that only federally registered meat establishments meeting certain criteria are eligible to export meat products to the US. Please visit the Canadian Food Inspection Agency (CFIA) website: United States of America (US) - Export requirements for meat and poultry products. Canadian meat exporters are encouraged to verify if their information is accurately reflected on the CFIA website before shipping their products to the US in order to avoid potential delay or rejection at the US ports because of information discrepancies.
Consumption and spending
1) Market size
The total volume of sales of meat in US reached 21,220.2 thousand tonnes in 2021. Poultry accounted for the largest volume of meat sold in US in 2021 at 10,314 thousand tonnes (almost 50% of the total meat sales), followed by beef and veal at 7,149.6 thousand tonnes and pork at 3,525.0 thousand tonnes. Beef and veal had the highest CAGR of 2.3%. It is forecast that by 2026, total meat sales in the US will reach 23,976.7 thousand tonnes. Beef and veal is projected to have a CAGR of 2.9%, followed by poultry at 2.3% from 2021 to 2026.
| Category | 2016 | 2021 | CAGR* % 2016-2021 | 2022 | 2026 | CAGR* % 2021-2026 |
|---|---|---|---|---|---|---|
| Meat | 20,070.8 | 21,220.2 | 1.1 | 21,766.0 | 23,976.7 | 2.5 |
| Beef and Veal | 6,396.5 | 7,149.6 | 2.3 | 7,333.4 | 8,259.3 | 2.9 |
| Lamb, Mutton and Goat | 97.7 | 105.6 | 1.6 | 108.1 | 116.5 | 2.0 |
| Pork | 3,569.4 | 3,526.0 | −0.2 | 3,615.1 | 3,893.0 | 2.0 |
| Poultry | 9,878.5 | 10,314.8 | 0.9 | 10,582.6 | 11,572.3 | 2.3 |
| Other Meat | 128.7 | 124.2 | −0.7 | 126.7 | 135.6 | 1.8 |
|
Source: Euromonitor International, 2022 *CAGR: Compound Annual Growth Rate |
||||||
Per capita consumption of meat by the US consumers was 63.9 kilograms in 2021, up from 61.9 kilograms in 2016, and it is projected to reach 70.6 kilograms by 2026.
| Geography | 2016 | 2021 | CAGR* % 2016-2021 | 2022 | 2026 | CAGR* % 2021-2026 |
|---|---|---|---|---|---|---|
| Meat | 61.9 | 63.9 | 0.6 | 65.3 | 70.6 | 2.0 |
| Beef and Veal | 19.7 | 21.5 | 1.8 | 22.0 | 24.3 | 2.5 |
| Lamb, Mutton and Goat | 0.3 | 0.3 | 0 | 0.3 | 0.3 | 0.0 |
| Pork | 11.0 | 10.6 | −0.7 | 10.9 | 11.5 | 1.6 |
| Poultry | 30.5 | 31.1 | 0.4 | 31.8 | 34.1 | 1.9 |
| Other Meat | 0.4 | 0.4 | 0 | 0.4 | 0.4 | 0.0 |
|
Source: Euromonitor International, 2022 *CAGR: Compound Annual Growth Rate |
||||||
2) Retail sales value
The retail sales value of the US meat sector increased from US$85,218.9 million in 2016 to US$89,919.3 million in 2021, registering a CAGR of 1.1%. The sector is expected to reach to US$1.0 billion by 2026, growing at a CAGR of 2.4% from 2021 to 2026.
| Category | 2016 | 2021 | CAGR* % 2016-2021 | 2022 | 2026 | CAGR* % 2021-2026 |
|---|---|---|---|---|---|---|
| Meat | 85,218.9 | 89,919.3 | 1.1 | 93,198.7 | 101,014.9 | 2.4 |
| Beef and Veal | 33,055.9 | 37,612.9 | 2.6 | 39,637.4 | 45,014.9 | 3.7 |
| Lamb, Mutton and Goat | 364.6 | 412.9 | 2.5 | 422.8 | 454.2 | 1.9 |
| Pork | 22,703.8 | 23,093.9 | 0.3 | 23,569.7 | 24,791.5 | 1.4 |
| Poultry | 27,228.6 | 27,005.6 | −0.2 | 27,752.5 | 28,828.1 | 1.3 |
| Other Meat | 1,866.0 | 1,794.0 | −0.8 | 1,816.2 | 1,926.3 | 1.4 |
|
Source: Euromonitor International,2022 *CAGR: Compound Annual Growth Rate |
||||||
3) Leading companies in the United States processed meat sector
Tyson Foods Inc was the leading company in the US processed meat sector, representing 15.2% of the market share, followed by Kraft Heinz Co representing 10.9% of the market share. Private labels held 16.7% of the market share, while other companies held 27.7% of the market share in 2021.
| Company | Retail sales (US$ millions) | Market share % |
|---|---|---|
| Tyson Foods Inc | 5,072.7 | 15.2 |
| Kraft Heinz Co | 3,615.2 | 10.9 |
| Hormel Foods Corp | 2,712.3 | 8.1 |
| WH Group | 2,147.7 | 6.5 |
| Johnsonville Sausage LLC | 972.3 | 2.9 |
| ConAgra Brands Inc | 958.5 | 2.9 |
| Bar-S Foods | 657.1 | 2.0 |
| Land O'Frost Inc | 506.8 | 1.5 |
| Perdue Farms Inc | 358.8 | 1.1 |
| Bob Evans Farms Inc | 233.5 | 0.7 |
| Private Label | 5,566.1 | 16.7 |
| Others | 9,221.3 | 27.7 |
| Total | 33,296.5 | 100.0 |
|
Source: Euromonitor International,2022 *CAGR: Compound Annual Growth Rate |
||
The top brand in the processed meat sector in 2021 was Oscar Mayer, at a value of US$3,615.2 million, representing a market share 10.9% of the US processed meat market. Tyson's market share was 5.7%, Hillshire Farm's market share was 3.4% in 2021.
| Brand name | Company name (GBO) | Retail sales (US$ millions) | Market share % |
|---|---|---|---|
| Oscar Mayer | Kraft Heinz Co | 3,615.2 | 10.9 |
| Tyson | Tyson Foods Inc | 1,883.8 | 5.7 |
| Hillshire Farm | Tyson Foods Inc | 1,143.2 | 3.4 |
| Hormel | Hormel Foods Corp | 1,092.0 | 3.3 |
| Smithfield | WH Group | 1,031.0 | 3.1 |
| Spam | Hormel Foods Corp | 1,018.1 | 3.1 |
| Johnsonville Sausage LLC) | Johnsonville Sausage LLC | 972.3 | 2.9 |
| Jimmy Dean | Tyson Foods Inc | 752.9 | 2.3 |
| Bar-S | Bar-S Foods | 657.1 | 2.0 |
| Ball Park | Tyson Foods Inc | 625.3 | 1.9 |
| Private Label | Private Label | 5,566.1 | 16.7 |
| Others | Others | 9,631.0 | 28.9 |
| Total | Total | 33,296.5 | 100.0 |
|
Source: Euromonitor International,2022 *CAGR: Compound Annual Growth Rate |
|||
New product launch analysis
According to Mintel's Global New Products Database (GNPD), there were 13,428 new meat and meat food products launched, in the US between January 2017 and July 2022. The number of yearly product launches has decreased from 2,530 meat and meat products as an ingredient, launched in 2017 to 2,264 meat and meat products in 2021.
Meat products, poultry products, fish products, meat snacks and prepared meals were the top sub-categories of newly released meat and meat product (as an ingredient) launches while microwaveable and Low/No/Reduced Allergen were top claims associated with new meat and meat products as an ingredient, released during the prescribed period.
The top packaging types included skin pack (3,446 products), flexible (2,908 products) and tray (2,581 products). The new product launches were released as new variety/range extension (5,817 products), new packaging (3,967 products) and new product (2,643 products) released between January 2017 and July 2022. Unflavoured/plain, and smoke were top flavours (including blends), while salt, waters, and spices are top ingredients identified during this period.
| Product attributes | Yearly launch counts | Total | |||||
|---|---|---|---|---|---|---|---|
| 2017 | 2018 | 2019 | 2020 | 2021 | 2022 (January-July) | ||
| Yearly product launches | 2,530 | 2,451 | 2,295 | 2,401 | 2,264 | 1,487 | 13,428 |
| Top five sub-categories | |||||||
| Meat Products | 681 | 541 | 473 | 681 | 578 | 444 | 3,398 |
| Poultry Products | 472 | 469 | 463 | 454 | 398 | 245 | 2,501 |
| Fish Products | 385 | 444 | 342 | 356 | 454 | 317 | 2,298 |
| Meat Snacks | 199 | 193 | 216 | 174 | 163 | 74 | 1,019 |
| Prepared Meals | 135 | 175 | 119 | 94 | 83 | 34 | 640 |
| Top five claims | |||||||
| Microwaveable | 901 | 1,038 | 848 | 972 | 873 | 549 | 5,181 |
| Low/No/Reduced Allergen | 889 | 883 | 883 | 767 | 760 | 492 | 4,674 |
| No Additives/Preservatives | 803 | 887 | 818 | 759 | 668 | 405 | 4,340 |
| Gluten Free | 842 | 812 | 795 | 713 | 709 | 455 | 4,326 |
| Ease of Use | 521 | 603 | 533 | 605 | 444 | 315 | 3,021 |
| Imported status | |||||||
| Not imported | 586 | 488 | 530 | 547 | 488 | 337 | 2,976 |
| Imported | 333 | 340 | 315 | 349 | 402 | 303 | 2,042 |
| Top packaged types | |||||||
| Skinpack | 676 | 654 | 577 | 599 | 547 | 393 | 3,446 |
| Flexible | 568 | 476 | 558 | 524 | 478 | 304 | 2,908 |
| Tray | 396 | 501 | 425 | 475 | 475 | 309 | 2,581 |
| Flexible stand-up pouch | 207 | 184 | 181 | 181 | 177 | 120 | 1,050 |
| Can | 198 | 212 | 102 | 151 | 189 | 87 | 939 |
| Top launch types | |||||||
| New Variety/Range Extension | 1,005 | 1,045 | 997 | 1,094 | 999 | 677 | 5,817 |
| New Packaging | 840 | 762 | 623 | 611 | 670 | 461 | 3,967 |
| New Product | 506 | 433 | 494 | 519 | 437 | 254 | 2,643 |
| Relaunch | 162 | 203 | 170 | 164 | 151 | 92 | 942 |
| New Formulation | 17 | 8 | 11 | 13 | 7 | 3 | 59 |
| Top five flavours (including blend) | |||||||
| Unflavoured/Plain | 797 | 818 | 688 | 900 | 871 | 640 | 4,714 |
| Smoke | 108 | 106 | 93 | 85 | 67 | 64 | 523 |
| Chicken | 73 | 85 | 57 | 43 | 43 | 31 | 332 |
| Beef | 47 | 37 | 46 | 33 | 46 | 24 | 233 |
| Roasted/Toasted | 67 | 37 | 37 | 25 | 33 | 21 | 220 |
| Top five ingredients | |||||||
| Salt (Food) | 1,816 | 1,681 | 1,628 | 1,579 | 1,465 | 928 | 9,097 |
| Waters (Food) | 1,570 | 1,496 | 1,323 | 1,341 | 1,227 | 753 | 7,710 |
| Spices (Food) | 978 | 960 | 941 | 912 | 755 | 432 | 4,978 |
| White Sugar (Food) | 1,008 | 860 | 830 | 833 | 745 | 492 | 4,768 |
| Natural X Flavourings (Food) | 903 | 832 | 843 | 754 | 654 | 436 | 4,422 |
| Top five companies | |||||||
| Aldi | 101 | 122 | 109 | 95 | 64 | 76 | 567 |
| Kroger | 79 | 94 | 53 | 61 | 85 | 15 | 387 |
| H-E-B | 67 | 72 | 74 | 44 | 41 | 39 | 337 |
| Wegmans Food Markets | 15 | 46 | 52 | 61 | 79 | 69 | 322 |
| Wal-Mart | 120 | 56 | 27 | 43 | 20 | 11 | 277 |
Examples of new products
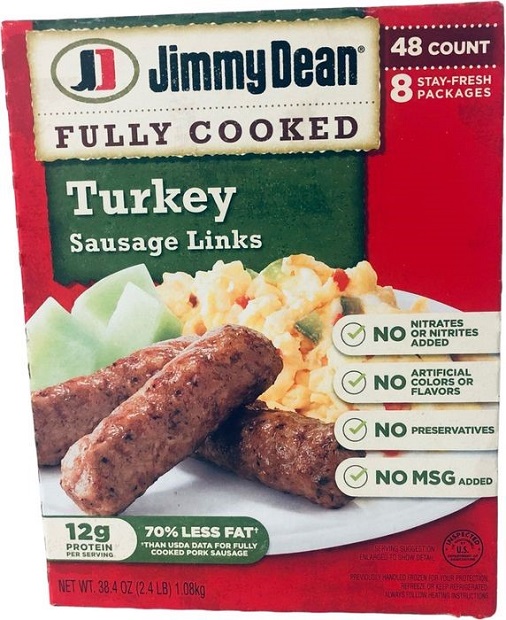
Fully Cooked Turkey Sausage Links
| Company | Hillshire Brands |
|---|---|
| Distributor | Hillshire Brands |
| Brand | Jimmy Dean |
| Category | Processed fish, meat and egg products |
| Sub-category | Poultry products |
| Market | United States |
| Store name | Costco |
| Store type | Club store |
| Store address | Los Feliz 90039 |
| Date published | July 2022 |
| Product source | Shopper |
| Launch type | New packaging |
| Price in local currency | $10.89 |
| Price in Euros | 10.40 |
Jimmy Dean Fully Cooked Turkey Sausage Links have been repackaged in a newly designed 38.4 ounce recyclable pack made of 100% recycleed paperboard, containing 48 units in eighth stay-fresh packages, and bearing preparation instructions. This USDA inspected product is made of turkey that has no added hormones, contains 12 grams protein per serving, and 70% less fat than USDA data for fully cooked pork sausages, and can be prepared in a microwave in as little as 40 seconds. It is said to be simple and guilt free, suitable for home-freezing and contains no nitrates or added nitrites, artificial flavors or colors, preservatives or added MSG.
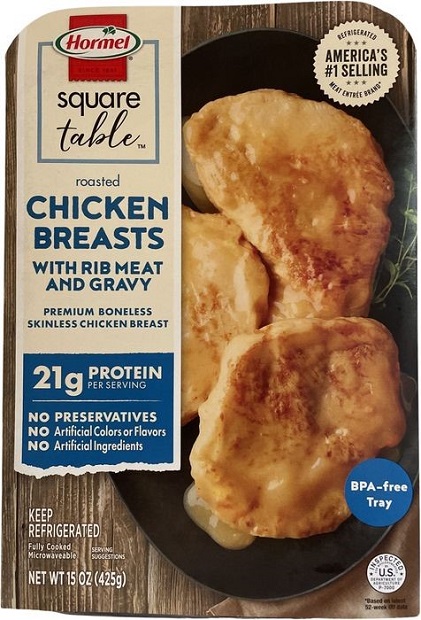
Roasted Chicken Breasts with Rib Meat and Gravy
| Company | Hormel Foods |
|---|---|
| Distributor | Hormel Foods |
| Brand | Hormel Square Table |
| Category | Processed fish, meat and egg products |
| Sub-category | Poultry products |
| Market | United States |
| Store name | H-E-B |
| Store type | Supermarket |
| Store address | The Woodlands 77382 |
| Date published | July 2022 |
| Product source | Shopper |
| Launch type | Relaunch |
| Price in local currency | $6.97 |
| Price in Euros | 6.91 |
Hormel Square Table Roasted Chicken Breasts with Rib Meat and Gravy, previously under Hormel Simple Ideas, have been relaunched featuring a new brand and in a redesigned 15 ounce recyclable pack containing a BPA free tray and featuring serving suggestions and heating instructions. This fully cooked, microwaveable and USDA inspected product is made with premium boneless skinless chicken breast, provides 21 grams protein and 0 grams trans fat per serving per serving and contains no preservatives, artificial colors, flavors or artificial ingredients.
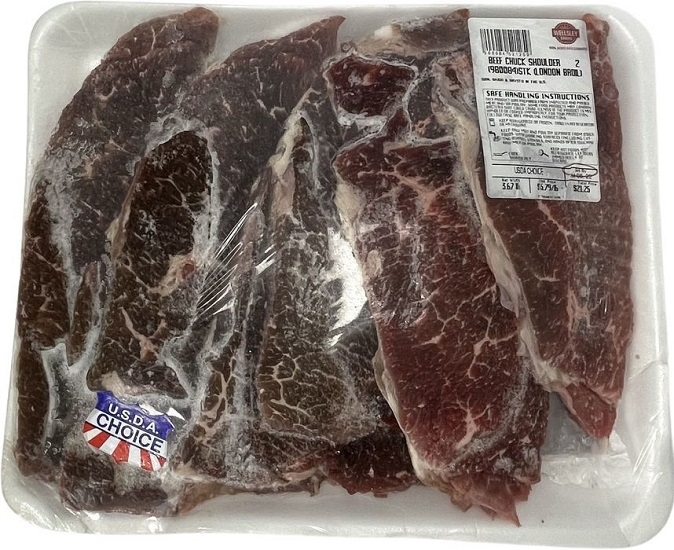
Beef Chuck Shoulder
| Company | Wellsley Farms |
|---|---|
| Distributor | Wellsley Farms |
| Category | Processed fish, meat and egg products |
| Sub-category | Meat products |
| Market | United States |
| Store name | BJ’s Wholesale Club |
| Store type | Club store |
| Store address | Charlotte 28134 |
| Date published | July 2022 |
| Product source | Shopper |
| Launch type | New variety / range extension |
| Price in local currency | $21.25 |
| Price in Euros | 20.38 |
Wellsley Farms Beef Chuck Shoulder is now available. The product is freezable, can be thawed in the microwave, and retails in a 3.67 pound pack featuring the USDA Choice logo.
For more information
The Canadian Trade Commissioner Service:
International Trade Commissioners can provide Canadian industry with on-the-ground expertise regarding market potential, current conditions and local business contacts, and are an excellent point of contact for export advice.
More agri-food market intelligence:
International agri-food market intelligence
Discover global agriculture and food opportunities, the complete library of Global Analysis reports, market trends and forecasts, and information on Canada's free trade agreements.
Agri-food market intelligence service
Canadian agri-food and seafood businesses can take advantage of a customized service of reports and analysis, and join our email subscription service to have the latest reports delivered directly to their inbox.
More on Canada's agriculture and agri-food sectors:
Canada's agriculture sectors
Information on the agriculture industry by sector. Data on international markets. Initiatives to support awareness of the industry in Canada. How the department engages with the industry.
For additional information on the American Food and Beverage Show, please contact:
Cecile Landgrebe
Trade Commissioner
Consulate General of Canada
Government of Canada
cecile.landgrebe@international.gc.ca
Resources
- Euromonitor International 2022
- FAOSTAT Agricultural Production, 2022
- Global Trade Tracker, 2022
- United States Department of Agriculture (USDA), 2022. USDA production, supply and distribution
Sector Trend Analysis – Meat trends in the United States
Global Analysis Report
Prepared by: Hongli Wang, Senior Market Analyst
© His Majesty the King in Right of Canada, represented by the Minister of Agriculture and Agri-Food (2022).
Photo credits
All photographs reproduced in this publication are used by permission of the rights holders.
All images, unless otherwise noted, are copyright His Majesty the King in Right of Canada.
To join our distribution list or to suggest additional report topics or markets, please contact:
Agriculture and Agri-Food Canada, Global Analysis1341 Baseline Rd, Tower 5, 3rd floor
Ottawa ON K1A 0C5
Canada
Email: aafc.mas-sam.aac@agr.gc.ca
The Government of Canada has prepared this report based on primary and secondary sources of information. Although every effort has been made to ensure that the information is accurate, Agriculture and Agri-Food Canada (AAFC) assumes no liability for any actions taken based on the information contained herein.
Reproduction or redistribution of this document, in whole or in part, must include acknowledgement of agriculture and agri-food Canada as the owner of the copyright in the document, through a reference citing AAFC, the title of the document and the year. Where the reproduction or redistribution includes data from this document, it must also include an acknowledgement of the specific data source(s), as noted in this document.
Agriculture and Agri-Food Canada provides this document and other report services to agriculture and food industry clients free of charge.