

Note: This report includes forecasting data that is based on baseline historical data.
Executive summary
The pet population in Thailand has increased by a compound annual growth rate (CAGR) of 2.3% from 2016-2021, rising from 16.5 million to 18.5 million over the historic period.
Thai imports of pet food were modest in 2021, totalling US$66.5 million in 2021, making Thailand the forty-eighth largest import market for pet food in the world. Thai imports grew at a CAGR of 4.3% from 2016-2021. Canada was Thailand's seventh largest supplier in 2021, with US$1.9 million in pet food exports to Thailand for the year. In 2021, Canada was supplied 2.8% of Thailand's pet food imports.
Retail sales of pet food in Thailand increased by a CAGR of 9.7% from 2016-2021, reaching a total value of US$1.4 billion in 2021. From 2021-2026, growth is forecast to occur at a CAGR of 8.4%, with total sales reaching US$2.0 billion in 2026. In 2021, the largest categories of pet food were dog and cat food, which had retail sales of US$1.0 billion (70.8% market share) and US$0.3 billion (24.9% market share) respectively.
The largest company in 2021 was Mars Inc, which controlled 40.0% of the market in 2021. Of Thailand's top 10 companies, Charoen Pokphand Group saw the fastest growth in market share, with its market share rising from 16.6% in 2016 to 19.6% in 2021. Together the five largest companies held 74.8% of the market in 2021.
Pet food sales in Thailand were distributed primarily through store-based retailing, which accounted for 83.3% of the market. Veterinary clinics had a 9.6% market share, while e-commerce accounted for the remaining 7.1% of pet food sales.
According to Mintel's Global New Products Database (GNPD) there were 675 pet food product launches in Thailand from January 2016 to December of 2021. Top sub-categories were dog snacks & treats, dog food dry and dog food wet.
Pet population and ownership
There were a total of 18.5 million pets in Thailand in the year 2021, up from 16.5 million in 2016. Total pet population rose at a CAGR of 2.3% from 2016-2021, and is expected to increase at a CAGR of 2.4% from 2021-2026. In 2021, dogs were the most popular pet, with a total of 8.3 million in Thailand, accounting for 44.8% of the total Thai pet population. Of dogs, small dogs were the most popular in 2021.4.1 million, or 49.8% of the dog population, weighed less than 9 kilograms. Fish were the second largest category of pets, with 4.5 million in Thailand in 2021, or 24.4% of the total pet population. Cats were the third largest category, with a population of 3.7 million and accounting for 19.9% of the pet population.
Cats registered the fastest growth in population from 2016-2021. Over the historic period, the cat population rose from 3.0 million individuals to 3.7 million, representing a CAGR of 3.9%. Growth is expected to accelerate from 2021-2026, with the population reaching 4.7 million by 2026. Growth from 2021-2026 is forecast to occur at a CAGR of 4.9%.
| Category | 2016 | 2021 | CAGR* % 2016-2021 | 2022 | 2026 | CAGR* % 2021-2026 |
|---|---|---|---|---|---|---|
| Pet Population | 16,519.0 | 18,499.7 | 2.3 | 18,921.3 | 20,792.2 | 2.4 |
| Birds | 1,258.0 | 1,271.8 | 0.2 | 1,274.9 | 1,288.6 | 0.3 |
| Cats | 3,035.6 | 3,682.6 | 3.9 | 3,848.4 | 4,675.6 | 4.9 |
| Dogs (total) | 7,380.8 | 8,294.3 | 2.4 | 8,462.7 | 9,133.4 | 1.9 |
| Small Dogs (up to 20 pounds or 9 kilograms) | 3,572.3 | 4,131.0 | 2.9 | 4,245.1 | 4,712.4 | 2.7 |
| Medium Dogs (20 to 50 pounds or 9 to 23 kilograms) | 2,258.5 | 2,475.6 | 1.9 | 2,507.2 | 2,622.6 | 1.2 |
| Large Dogs (Over 50 pounds or over 23 kilograms) | 1,550.0 | 1,687.8 | 1.7 | 1,710.3 | 1,798.4 | 1.3 |
| Fish | 4,136.3 | 4,513.4 | 1.8 | 4,591.5 | 4,929.8 | 1.8 |
| Small mammal/reptiles (total) | 708.3 | 737.6 | 0.8 | 743.8 | 764.8 | 0.7 |
| Small mammals | 553.2 | 603.0 | 1.7 | 612.3 | 642.0 | 1.3 |
| Small Reptiles | 155.2 | 134.6 | −2.8 | 131.6 | 122.7 | −1.8 |
|
Source: Euromonitor International, 2022 *CAGR: Compound Annual Growth Rate Historical data: 2016 to 2021 Forecastdata: 2022 to 2026 |
||||||
From 2016-2021, the percentage of Thai households that owned a cat rose from 10.0% to 11.1%, while the number of households owning cats grew at a CAGR of 3.7%. Meanwhile, the percentage of Thai households that owned a dog rose from 22.8% to 24.3%, and the number of households owning a dog rose by a CAGR of 2.8% over this period. Overall, there were significantly more households which owned dogs than cats, although the number of households which owned cats experienced faster growth.
| Category | 2016 | 2017 | 2018 | 2019 | 2020 | 2021 | CAGR* % 2016-2021 |
|---|---|---|---|---|---|---|---|
| Cat | 2,343.0 | 2,472.4 | 2,536.7 | 2,628.6 | 2,722.8 | 2,808.4 | 3.7 |
| % share | 10.0 | 10.4 | 10.4 | 10.7 | 10.9 | 11.1 | 2.1 |
| Dog | 5,342.1 | 5,453.1 | 5,583.2 | 5,757.7 | 5,941.2 | 6,146.6 | 2.8 |
| % share | 22.8 | 22.9 | 23.0 | 23.4 | 23.7 | 24.3 | 1.3 |
|
Source: Euromonitor International, 2022 *CAGR: Compound Annual Growth Rate |
|||||||
Retail market size
Sales of pet food in Thailand have seen strong growth from 2016-2021, with sales growth driven both by rising pet populations and by trends towards the premiumization of pet food. Pet owners are viewing their pets as more anthropomorphized, and it is becoming common for pets to be considered part of the family. Over the course of the pandemic, consumers have become more interested both in their own health and the health of their pets. Premium pet foods that offer specific nutritional benefits have seen strong growth (Euromonitor International, 2022).
Dog food was the largest market in 2021, with sales totaling US$1.0 billion, and comprising 70.8% of the pet food market. Cat food was the next largest market, with sales of US$0.3 billion and comprising 24.9% of the pet food market. Together, dog and cat food made up 95.7% of pet food sales. Cat food saw the fastest growth in sales from 2016-2021, with sales growing at a CAGR of 13.1% over this period, far outpacing the 3.9% CAGR of the cat population. Fish food sales saw much slower growth, rising at a CAGR of 4.2% over the historic period, compared with a CAGR of 3.1% for small mammal and reptile food and a CAGR of −0.6% for bird food.
Dog food sales also saw fast growth, with sales rising at a CAGR of 9.2%, compared with a CAGR of 2.4% for the dog population in Thailand. Cat food is forecast to see the fastest growth from 2021-2026, rising at a CAGR of 11.0%, while dog food sales grow at a CAGR of 7.7%. In 2026, sales of dog food are forecast to reach US$1.4 billion, comprising 68.5% of the pet food market. Cat food sales are expected to reach US$0.6 billion in 2026, by which time they will make up 28.0% of the pet food market.
| Category | 2016 | 2021 | CAGR* % 2016-2021 | 2022 | 2026 | CAGR* % 2021-2026 |
|---|---|---|---|---|---|---|
| Pet food total | 851.6 | 1,352.6 | 9.7 | 1,450.3 | 2,025.3 | 8.4 |
| Bird Food | 18.3 | 17.8 | −0.6 | 17.4 | 19.4 | 1.7 |
| Cat Food | 182.0 | 336.4 | 13.1 | 372.9 | 566.5 | 11.0 |
| Dog Food | 618.7 | 958.6 | 9.2 | 1,018.1 | 1,387.7 | 7.7 |
| Fish Food | 31.3 | 38.4 | 4.2 | 40.4 | 50.0 | 5.4 |
| Small Mammal/Reptile Food | 1.2 | 1.4 | 3.1 | 1.5 | 1.7 | 4.0 |
|
Source: Euromonitor International, 2022 *CAGR: Compound Annual Growth Rate |
||||||
Company shares
In 2021, the largest players in the pet food market were Mars Inc with a 37.2% market share and Charoen Pokphand Group with a 20.8% share. Together these companies controlled most of the market, representing 59.0% of total sales, up from 52.7% in 2016. The next largest market shares were Hunter Group Ltd with 5.1%, Nestlé SA with 4.0%, and Colgate-Palmolive Co with 3.5%, all of which saw negative growth in market share over the historic period. Collectively these 5 players made up 71.6% of the market. Private label products accounted for 1.8% of the market.
| Company | 2016 | 2017 | 2018 | 2019 | 2020 | 2021 | CAGR* % 2016-2021 |
|---|---|---|---|---|---|---|---|
| Total | 100.0 | 100.0 | 100.0 | 100.0 | 100.0 | 100.0 | 0.0 |
| Mars Inc | 34.4 | 35.3 | 36.0 | 36.4 | 36.8 | 37.2 | 1.6 |
| Charoen Pokphand Group | 18.3 | 18.7 | 19.3 | 19.9 | 20.5 | 20.8 | 2.6 |
| Hunter Group Ltd | 5.2 | 5.4 | 5.3 | 5.2 | 5.1 | 5.1 | −0.4 |
| Nestlé SA | 4.2 | 4.1 | 4.1 | 4.4 | 4.0 | 4.0 | −1.0 |
| Colgate-Palmolive Co | 4.2 | 4.0 | 3.7 | 3.6 | 3.5 | 3.5 | −3.6 |
| Betagro Agro Group PCL | 3.8 | 3.7 | 3.5 | 3.4 | 3.4 | 3.3 | −2.8 |
| See-All Aquariums Co Ltd | 1.7 | 1.6 | 1.5 | 1.5 | 1.4 | 1.4 | −3.8 |
| Thai Union Frozen Products PCL | 1.2 | 1.2 | 1.1 | 1.1 | 1.1 | 1.1 | −1.7 |
| Inaba Pet Food Co Ltd | 0.4 | 0.6 | 0.8 | 0.9 | N/C | ||
| Kingfisher Holdings Ltd | 0.6 | 0.5 | 0.5 |
0.5 |
0.4 | 0.4 | −7.8 |
| Private Label | 2.3 | 2.3 | 2.1 | 2.0 | 1.9 | 1.8 | −4.8 |
| Others | 24.1 | 23.2 | 22.5 | 21.4 | 21.1 | 20.5 | −3.2 |
|
Source: Euromonitor International, 2022 *CAGR: Compound Annual Growth Rate N/C: Not calculable |
|||||||
Brand shares
In 2021 of the top 5 brands pet food brands, 3 are owned by Mars Inc (Pedigree, Royal Canin, and Whiskas) while the other two are owned by Charoen Pokphand Group (Jerhigh, SmartHeart). Pedigree (Mars Inc) alone had a 23.4% share of the total pet food market, up from 22.4% in 2016. Royal Canin (Mars Inc) was the second largest player with an 8.0% share, up from 7.1% in 2016. Jerhigh (Charoen Pokphand Group) had a 6.7% share, Whiskas (Mars Inc) had a 5.2% share, and SmartHeart (Charoen Pokphand Group) had a 4.7% share. Of the top 5 brands, Jerhigh saw the fastest growth, with market share rising from 5.2% in 2016 to 6.7% in 2021.
| Brand | 2016 | 2017 | 2018 | 2019 | 2020 | 2021 | CAGR* % 2016-2021 |
|---|---|---|---|---|---|---|---|
| Total | 100.0 | 100.0 | 100.0 | 100.0 | 100.0 | 100.0 | 0.0 |
| Pedigree (Mars Inc) | 22.4 | 23.3 | 23.9 | 23.9 | 23.7 | 23.4 | 0.9 |
| Royal Canin (Mars Inc) | 7.1 | 7.0 | 7.1 | 7.4 | 7.6 | 8.0 | 2.4 |
| Jerhigh (Charoen Pokphand Group) | 5.2 | 5.5 | 6.0 | 6.4 | 6.5 | 6.7 | 5.2 |
| Whiskas (Mars Inc) | 4.4 | 4.4 | 4.5 | 4.6 | 5.0 | 5.2 | 3.4 |
| SmartHeart (Charoen Pokphand Group) | 4.4 | 4.4 | 4.5 | 4.6 | 4.8 | 4.7 | 1.3 |
| Me-O (Charoen Pokphand Group) | 3.5 | 3.6 | 3.7 | 3.8 | 4.3 | 4.5 | 5.2 |
| Sleeky (Hunter Group Ltd) | 4.1 | 4.3 | 4.5 | 4.3 | 4.3 | 4.4 | 1.4 |
| Hill's Science Diet (Colgate-Palmolive Co) | 4.2 | 4.0 | 3.7 | 3.6 | 3.5 | 3.5 | −3.6 |
| A Pro (Charoen Pokphand Group) | 2.7 | 2.7 | 2.7 | 2.7 | 2.6 | 2.6 | −0.8 |
| ONE (Nestlé SA) | 1.5 | 1.5 | 1.6 | 1.6 | 1.8 | 2.0 | 5.9 |
| Private Label | 1.7 | 1.6 | 1.5 | 1.5 | 1.4 | 1.4 | −4.8 |
| Others | 38.2 | 37.0 | 35.7 | 35.1 | 34.0 | 33.2 | −2.8 |
|
Source: Euromonitor International, 2022 *CAGR: Compound Annual Growth Rate |
|||||||
Market segmentation
Dog food
The market for Dog Food in Thailand is increasingly being shaped by changing attitudes among pet owners, as dogs become increasingly anthropomorphized and viewed as part of the family. The coronavirus pandemic has caused many consumers to pay more attention to their own health, and the health of their pets as well. This has allowed consumer spending on dog food to continue growing in spite of an economic downturn caused by the Covid-19 pandemic (Euromonitor International, 2022).
Historically it has been common for dogs to be fed scraps, pet owners in Thailand are moving away from this in favour of more premium options that are believed to support health and wellbeing, in addition to taste and enjoyment. Dog owners in Thailand are now looking for prepared options that feature balanced nutrition, particularly natural and functional foods that are high in protein. Meanwhile the increasing concern for enjoyment of anthropomorphized dogs is stimulating demand for treats. Meanwhile, as growth in dog food sales is stimulated by increasing trends towards premiumization, it is also being driven by robust growth in the dog population (Euromonitor International, 2022).
As higher protein options gain popularity, players seeking to innovate have begun introducing grain free options as well as options based on insect protein. Players are also coming out with lines of dog food tailored to individual breeds, age, and level of physical activity. Dry dog food continues to be more popular than its wet counterpart, due to ease of storage and long shelf life (Euromonitor International, 2022).
In 2021, total sales of dog food were US$1.0 billion, up from US$0.6 billion in 2016, having grown at a CAGR of 9.2% from 2016-2021. This compares with a growth rate of 2.4% in the dog population over this same period. Dry dog food saw US$0.6 billion in sales in 2021, making up 62.0% of the dog food market. Of dry dog food, economy food saw US$0.1 billion (24.4% of dry sales) of sales, mid price saw US$0.3 billion (53.6%) of sales, and premium had US$0.1 billion (22.0%) of sales. Dog treats and mixes was the second most popular category of dog food, with US$0.2 billion in sales in 2021, accounting for 23.9% of the total dog food market. Wet dog food accounted for the remaining US$0.1 billion in sales, or 14.1%. Economy wet dog food saw sales of US$0.06 billion (4.7% of wet sales), while mid-priced wet food saw sales of US$0.1 billion (81.7%), and premium wet food saw US$0.02 billion in sales (13.4%).
Dog treats and mixes saw by far the fastest growth from 2016-2021, as indulging one's pets became more popular. This category saw a CAGR of 13.5% from 2016-2021 and is expected to repeat this rate of growth from 2021-2026. Dry dog food is expected to slightly outperform wet dog food from 2021-2026, with dry food growing at a CAGR of 5.6%, while wet food grows at a CAGR of 5.4%. For both wet and dry food, premium options are expected to see by far the fastest growth, while mid-priced dog food remains the most popular. In 2026, total dog food sales are expected to be US$1.4 billion, of which US$0.8 billion (56.2%) will be dry food, US$0.4 billion (31.2%) will be dog treats and mixes, and US$0.2 billion (12.7%) will be wet food.
| Category | 2016 | 2017 | 2018 | 2019 | 2020 | 2021 |
|---|---|---|---|---|---|---|
| Dog Food Total | 618.7 | 697.0 | 774.5 | 846.8 | 898.4 | 958.6 |
| Dry Dog Food | 406.4 | 451.3 | 493.2 | 533.0 | 562.5 | 594.0 |
| Economy Dry Dog Food | 104.3 | 114.4 | 122.8 | 128.9 | 137.2 | 145.0 |
| Mid-Priced Dry Dog Food | 213.4 | 242.9 | 269.4 | 293.0 | 306.5 | 318.5 |
| Premium Dry Dog Food | 88.7 | 94.0 | 101.0 | 111.1 | 118.9 | 130.4 |
| Wet Dog Food | 90.7 | 101.6 | 111.5 | 121.0 | 128.1 | 135.1 |
| Economy Wet Dog Food | 5.4 | 5.6 | 5.9 | 6.0 | 6.2 | 6.4 |
| Mid-Priced Wet Dog Food | 74.0 | 83.4 | 91.8 | 99.7 | 105.4 | 110.6 |
| Premium Wet Dog Food | 11.2 | 12.5 | 13.8 | 15.3 | 16.5 | 18.1 |
| Dog Treats and Mixers | 121.7 | 144.2 | 169.8 | 192.8 | 207.8 | 229.5 |
| Source: Euromonitor International, 2022 | ||||||
| Category | Annual growth % 2020-2021 | CAGR* % 2016-2021 | Total growth % 2016-2021 |
|---|---|---|---|
| Dog Food Total | 6.7 | 9.2 | 54.9 |
| Dry Dog Food | 5.6 | 7.9 | 46.2 |
| Economy Dry Dog Food | 5.7 | 6.8 | 39.0 |
| Mid-Priced Dry Dog Food | 3.9 | 8.3 | 49.3 |
| Premium Dry Dog Food | 9.7 | 8.0 | 47.0 |
| Wet Dog Food | 5.5 | 8.3 | 49.0 |
| Economy Wet Dog Food | 3.2 | 3.5 | 18.5 |
| Mid-Priced Wet Dog Food | 4.9 | 8.4 | 49.5 |
| Premium Wet Dog Food | 9.7 | 10.1 | 61.6 |
| Dog Treats and Mixers | 10.4 | 13.5 | 88.6 |
|
Source: Euromonitor International, 2022 *CAGR: Compound Annual Growth Rate |
|||
| Category | 2022 | 2023 | 2024 | 2025 | 2026 |
|---|---|---|---|---|---|
| Dog Food Total | 1,018.1 | 1,109.8 | 1,195.5 | 1,287.7 | 1,387.7 |
| Dry Dog Food | 624.1 | 663.5 | 703.2 | 741.7 | 779.4 |
| Economy Dry Dog Food | 152.6 | 162.5 | 172.4 | 182.1 | 191.7 |
| Mid-Priced Dry Dog Food | 329.5 | 344.8 | 359.9 | 374.0 | 387.2 |
| Premium Dry Dog Food | 142.1 | 156.2 | 170.8 | 185.6 | 200.5 |
| Wet Dog Food | 141.8 | 150.7 | 159.4 | 167.8 | 175.8 |
| Economy Wet Dog Food | 6.6 | 6.9 | 7.2 | 7.5 | 7.7 |
| Mid-Priced Wet Dog Food | 115.5 | 122.1 | 128.4 | 134.3 | 140.0 |
| Premium Wet Dog Food | 19.7 | 21.7 | 23.8 | 25.9 | 28.1 |
| Dog Treats and Mixers | 252.1 | 295.5 | 332.9 | 378.3 | 432.5 |
| Source: Euromonitor International, 2022 | |||||
| Category | Annual growth % 2021-2022 | CAGR* % 2021-2026 | Total growth % 2021-2026 |
|---|---|---|---|
| Dog Food Total | 6.2 | 7.7 | 44.8 |
| Dry Dog Food | 5.1 | 5.6 | 31.2 |
| Economy Dry Dog Food | 5.2 | 5.7 | 32.2 |
| Mid-Priced Dry Dog Food | 3.5 | 4.0 | 21.6 |
| Premium Dry Dog Food | 9.0 | 9.0 | 53.8 |
| Wet Dog Food | 5.0 | 5.4 | 30.1 |
| Economy Wet Dog Food | 3.1 | 3.8 | 20.3 |
| Mid-Priced Wet Dog Food | 4.4 | 4.8 | 26.6 |
| Premium Wet Dog Food | 8.8 | 9.2 | 55.2 |
| Dog Treats and Mixers | 9.8 | 13.5 | 88.5 |
|
Source: Euromonitor International, 2022 *CAGR: Compound Annual Growth Rate |
|||
The Thai Dog Food market was lead in 2021 by international players, such as Mars Inc which alone held 40.0% of the market. More international companies were particularly dominant in markets for mid-priced and premium dog food, while domestic players had a stronger presence in the economy market. The rising popularity of premium blends has benefitted international companies, however domestic players are focusing on offering more premium options. After Mars Inc, the next largest player was Charoen Pokphand Group, with 19.6% of sales, followed by Hunter Group Ltd with 6.2%, Betagro Agro Group PCL with 4.7%, and Colgate-Palmolive Co with 4.3%.
| Company | 2016 | 2017 | 2018 | 2019 | 2020 | 2021 | CAGR* % 2016-2021 |
|---|---|---|---|---|---|---|---|
| Total | 100.0 | 100.0 | 100.0 | 100.0 | 100.0 | 100.0 | 0.0 |
| Mars Inc | 37.3 | 38.3 | 38.9 | 39.2 | 39.7 | 40.0 | 1.4 |
| Charoen Pokphand Group | 16.6 | 17.1 | 17.8 | 18.5 | 19.1 | 19.6 | 3.4 |
| Hunter Group Ltd | 5.6 | 5.9 | 6.1 | 5.9 | 6.0 | 6.2 | 2.1 |
| Betagro Agro Group PCL | 5.3 | 5.0 | 4.8 | 4.7 | 4.7 | 4.7 | −2.4 |
| Colgate-Palmolive Co | 5.1 | 4.8 | 4.5 | 4.4 | 4.3 | 4.3 | −3.4 |
| Nestlé SA | 1.9 | 1.8 | 1.8 | 1.9 | 1.2 | 1.1 | −10.4 |
| Thai Union Frozen Products PCL | 0.7 | 0.7 | 0.7 | 0.6 | 0.6 | 0.6 | −3.0 |
| Breeder's Choice Pet Foods Inc | 0.3 | 0.3 | 0.3 | 0.3 | 0.2 | 0.2 | −7.8 |
| Pet Supply Co Ltd | 0.3 | 0.3 | 0.2 | 0.2 | 0.2 | 0.2 | −7.8 |
| Kingfisher Holdings Ltd | 0.3 | 0.2 | 0.2 | 0.2 | 0.2 | 0.2 | −7.8 |
| Private Label | 2.6 | 2.4 | 2.3 | 2.2 | 2.1 | 2.0 | −5.1 |
| Others | 24.0 | 23.2 | 22.4 | 21.9 | 21.7 | 20.9 | −2.7 |
|
Source: Euromonitor International, 2022 *CAGR: Compound Annual Growth Rate |
|||||||
Cat food
Much like dog food, consumer expenditure on cat food has benefited from trends towards premiumization, driven by the humanization of pets. The pandemic has accelerated these trends, as owners spending more time at home have become closer to their household pets. Prepared food is becoming increasingly popular, particularly that which offers specific health or nutritional claims to meet a cat's individual needs. Products claiming to be low in sodium and fat, while being high in nutrients such as omega-6 and zinc are gaining traction. New product launches are increasingly focusing on functional and naturally healthy products, as com petition in the premium cat food sector intensifies (Euromonitor International, 2022).
Cat food has also benefitted from robust growth of the cat population. Although less popular than dogs, cats are seeing the fastest growth. As Thailand undergoes a demographic transition towards increasing numbers of single people, childless couples, and the elderly, cats are increasingly popular among those seeking companionship. Cats are popular among these groups as they require less work to take care of than dogs and can accommodate a busy schedule. Sales saw accelerated growth during the pandemic due to stockpiling, although as consumers started using up these stockpiles in 2021, sales growth slowed slightly (Euromonitor International, 2022).
Total sales of cat food in 2021 were US$336.4 million, up from US$182.0 million in 2021. Of these sales, US$220.9 million, or 65.7%, were dry cat food. Of dry cat food sales, economy dry cat food saw US$8.9 million or 4.0% of the dry cat food market. Mid-priced dry cat food was the most popular, accounting for US$137.1 million in sales, or 62.1% of dry food. Premium dry cat food saw US$74.9 million or 33.9%. Wet cat food was the next most popular category, with US$72.8 million in sales, or 21.6% of the market. Mid-priced cat food dominated this category with a 78.0% share, with the rest of the market being split between premium and economy options. Cat treats and mixes, meanwhile, saw US$42.6 million in sales, accounting for the remaining 12.7% of the cat food market.
Cat treats and mixes saw the fastest growth from 2016-2021 at a CAGR of 18.4%, while dry cat food grew at a CAGR of 13.0% and wet cat food grew at a CAGR of 10.7%. Premium categories saw the fastest growth, while economy options saw the most sluggish growth. From 2021-2026, cat treats and mixes, as well as premium dry cat food, are expected to see the fastest growth rates.
| Category | 2016 | 2017 | 2018 | 2019 | 2020 | 2021 |
|---|---|---|---|---|---|---|
| Cat Food Total | 182.0 | 204.8 | 228.0 | 257.1 | 298.0 | 336.4 |
| Dry Cat Food | 119.9 | 134.1 | 148.7 | 166.5 | 195.5 | 220.9 |
| Economy Dry Cat Food | 5.8 | 6.5 | 7.1 | 7.9 | 8.3 | 8.9 |
| Mid-Priced Dry Cat Food | 75.3 | 84.0 | 92.6 | 102.7 | 122.6 | 137.1 |
| Premium Dry Cat Food | 38.9 | 43.6 | 48.9 | 56.0 | 64.5 | 74.9 |
| Wet Cat Food | 43.8 | 48.9 | 53.7 | 59.3 | 66.3 | 72.8 |
| Economy Wet Cat Food | 6.5 | 6.9 | 7.1 | 7.3 | 7.3 | 7.5 |
| Mid-Priced Wet Cat Food | 32.6 | 36.7 | 40.6 | 45.0 | 51.5 | 56.8 |
| Premium Wet Cat Food | 4.8 | 5.4 | 6.1 | 7.0 | 7.5 | 8.4 |
| Cat Treats and Mixers | 18.3 | 21.8 | 25.6 | 31.3 | 36.2 | 42.6 |
| Source: Euromonitor International, 2022 | ||||||
| Category | Annual growth % 2020-2021 | CAGR* % 2016-2021 | Total growth % 2016-2021 |
|---|---|---|---|
| Cat Food Total | 12.9 | 13.1 | 84.8 |
| Dry Cat Food | 13.0 | 13.0 | 84.2 |
| Economy Dry Cat Food | 7.2 | 8.9 | 53.4 |
| Mid-Priced Dry Cat Food | 11.8 | 12.7 | 82.1 |
| Premium Dry Cat Food | 16.1 | 14.0 | 92.5 |
| Wet Cat Food | 9.8 | 10.7 | 66.2 |
| Economy Wet Cat Food | 2.7 | 2.9 | 15.4 |
| Mid-Priced Wet Cat Food | 10.3 | 11.7 | 74.2 |
| Premium Wet Cat Food | 12.0 | 11.8 | 75.0 |
| Cat Treats and Mixers | 17.7 | 18.4 | 132.8 |
|
Source: Euromonitor International, 2022 *CAGR: Compound Annual Growth Rate |
|||
| Category | 2022 | 2023 | 2024 | 2025 | 2026 |
|---|---|---|---|---|---|
| Cat Food Total | 372.9 | 418.2 | 465.8 | 515.1 | 566.5 |
| Dry Cat Food | 245.7 | 275.3 | 306.9 | 340.5 | 376.0 |
| Economy Dry Cat Food | 9.5 | 10.1 | 10.7 | 11.3 | 11.9 |
| Mid-Priced Dry Cat Food | 150.3 | 166.3 | 182.8 | 199.9 | 217.8 |
| Premium Dry Cat Food | 86.0 | 98.9 | 113.4 | 129.3 | 146.3 |
| Wet Cat Food | 79.1 | 87.0 | 95.0 | 103.2 | 111.6 |
| Economy Wet Cat Food | 7.7 | 8.0 | 8.3 | 8.5 | 8.8 |
| Mid-Priced Wet Cat Food | 62.1 | 68.5 | 75.2 | 82.0 | 89.0 |
| Premium Wet Cat Food | 9.3 | 10.4 | 11.5 | 12.6 | 13.8 |
| Cat Treats and Mixers | 48.0 | 56.0 | 63.9 | 71.4 | 78.9 |
| Source: Euromonitor International, 2022 | |||||
| Category | Annual growth % 2021-2022 | CAGR* % 2021-2026 | Total growth % 2021-2026 |
|---|---|---|---|
| Cat Food Total | 10.9 | 11.0 | 68.4 |
| Dry Cat Food | 11.2 | 11.2 | 70.2 |
| Economy Dry Cat Food | 6.7 | 6.0 | 33.7 |
| Mid-Priced Dry Cat Food | 9.6 | 9.7 | 58.9 |
| Premium Dry Cat Food | 14.8 | 14.3 | 95.3 |
| Wet Cat Food | 8.7 | 8.9 | 53.3 |
| Economy Wet Cat Food | 2.7 | 3.2 | 17.3 |
| Mid-Priced Wet Cat Food | 9.3 | 9.4 | 56.7 |
| Premium Wet Cat Food | 10.7 | 10.4 | 64.3 |
| Cat Treats and Mixers | 12.7 | 13.1 | 85.2 |
|
Source: Euromonitor International, 2022 *CAGR: Compound Annual Growth Rate |
|||
In 2021, Mars Inc was the clear leader of cat food sales, with a 35.6% market share. However, Mars Inc's strength was due in large part to the popularity of their mid-priced brands, however they face intensifying com petition in the premium market. Charoen Pokphand Group was the second largest player, with a 22.3% share, followed by Nestlé SA with a 13.2% share, Inaba Pet Food Co Ltd with a 3.6% share, and Hunter Group Ltd with a 3.0% share.
| Company | 2016 | 2017 | 2018 | 2019 | 2020 | 2021 | CAGR* % 2016-2021 |
|---|---|---|---|---|---|---|---|
| Total | 100.0 | 100.0 | 100.0 | 100.0 | 100.0 | 100.0 | 0.0 |
| Mars Inc | 34.3 | 34.4 | 34.7 | 35.2 | 35.3 | 35.6 | 0.7 |
| Charoen Pokphand Group | 20.3 | 20.6 | 21.0 | 21.3 | 21.9 | 22.3 | 1.9 |
| Nestlé SA | 13.2 | 13.1 | 12.9 | 13.5 | 13.3 | 13.2 | 0.0 |
| Inaba Pet Food Co Ltd | 1.7 | 2.8 | 3.2 | 3.6 | N/C | ||
| Hunter Group Ltd | 3.8 | 3.9 | 4.0 | 4.0 | 3.3 | 3.0 | −4.6 |
| Thai Union Frozen Products PCL | 3.0 | 3.0 | 3.0 | 2.9 | 2.8 | 2.6 | −2.8 |
| Colgate-Palmolive Co | 2.3 | 2.2 | 2.0 | 1.9 | 1.7 | 1.6 | −7.0 |
| Kingfisher Holdings Ltd | 1.7 | 1.6 | 1.5 | 1.4 | 1.2 | 1.1 | −8.3 |
| Procter & Gamble Co, The | |||||||
| Private Label | 2.2 | 2.2 | 2.1 | 1.8 | 1.6 | 1.5 | −7.4 |
| Others | 19.2 | 19.0 | 17.1 | 15.2 | 15.7 | 15.6 | −4.1 |
|
Source: Euromonitor International, 2022 *CAGR: Compound Annual Growth Rate N/C: Not calculable |
|||||||
Other pet food
Other pet food categories have not benefited from the same premiumization and humanization trends in the same way as dog and cat food. Other pet food categories have also faced headwind due to the coronavirus pandemic, as consumers have had their budgets squeezed and COVID restrictions have made interfered with traditional outlets for other pet food, such as wet markets. However, the demand for fish food has benefitted some from consumers spending increasing amounts of time at home as some consumers sought to acquire aquariums to create a more interesting home environment (Euromonitor International, 2022).
Consumer interest in pet wellbeing is increasing to some extent, leading to brands offering healthier ingredients becoming increasingly popular, particularly products offering natural ingredients. This is expected to benefit foreign brands which boast a wide selection of healthy and natural products. Higher protein options have also been having success. Foreign brands are expected to target younger consumers that have a greater affinity for Western products (Euromonitor International, 2022).
In 2021, total other pet food sales amounted to US$57.6 million, the majority of which were fish food sales. Total fish food sales amounted to US$38.4 million, or 66.7% of the other pet food market. Bird food accounted for US$17.8 million in sales, or 30.9% of the market, while small mammal and reptile food saw US$1.4 million in sales, representing the remaining 2.4% of the market. Fish food saw the fastest growth from 2016-2021, while fish also saw the fastest growth in population over the same period. Fish food sales grew at a CAGR of 4.2% over the historic period. Bird food, in contrast, grew at a CAGR of −0.6%, growing slightly from 2016-2019, and then contracting during the pandemic. Small mammal and reptile food grew at an approximate CAGR of 3.1%.
From 2021-2026, growth in the other pet food category is expected to accelerate, as covid restrictions are lifted and wet markets resume normal operations. fish food is expected to see the fastest growth once again, with growth occurring at a CAGR of 5.44, followed by small mammal and reptile food at a CAGR of 4.0%. Small mammal and reptile food is expected to see especially strong growth from 2021-2022, growing 7.1% for that year. Meanwhile, bird food is expected to return to positive growth, however this growth will be slower at a CAGR of 1.7% from 2021-2026. Bird food sales are expected to recover to their 2019 peak in 2026.
| Category | 2016 | 2017 | 2018 | 2019 | 2020 | 2021 |
|---|---|---|---|---|---|---|
| Other Pet Food | 50.8 | 53.1 | 53.0 | 55.6 | 56.5 | 57.6 |
| Bird Food | 18.3 | 18.8 | 19.1 | 19.4 | 18.8 | 17.8 |
| Fish Food | 31.3 | 33.1 | 32.5 | 34.8 | 36.3 | 38.4 |
| Small Mammal/Reptile Food | 1.2 | 1.2 | 1.3 | 1.4 | 1.4 | 1.4 |
| Source: Euromonitor International, 2022 | ||||||
| Category | Annual growth % 2020-2021 | CAGR* % 2016-2021 | Total growth % 2016-2021 |
|---|---|---|---|
| Other Pet Food | 1.9 | 2.5 | 13.4 |
| Bird Food | −5.3 | −0.6 | −2.7 |
| Fish Food | 5.8 | 4.2 | 22.7 |
| Small Mammal/Reptile Food | 0.0 | 3.1 | 16.7 |
|
Source: Euromonitor International, 2022 *CAGR: Compound Annual Growth Rate |
|||
| Category | 2022 | 2023 | 2024 | 2025 | 2026 |
|---|---|---|---|---|---|
| Other Pet Food | 59.3 | 62.3 | 65.3 | 68.2 | 71.1 |
| Bird Food | 17.4 | 17.8 | 18.3 | 18.8 | 19.4 |
| Fish Food | 40.4 | 43.0 | 45.4 | 47.8 | 50.0 |
| Small Mammal/Reptile Food | 1.5 | 1.5 | 1.6 | 1.6 | 1.7 |
| Source: Euromonitor International, 2022 | |||||
| Category | Annual growth % 2020-2021 | CAGR* % 2016-2021 | Total growth % 2016-2021 |
|---|---|---|---|
| Other Pet Food | 3.0 | 4.3 | 23.4 |
| Bird Food | −2.2 | 1.7 | 9.0 |
| Fish Food | 5.2 | 5.4 | 30.2 |
| Small Mammal/Reptile Food | 7.1 | 4.0 | 21.4 |
|
Source: Euromonitor International, 2022 *CAGR: Compound Annual Growth Rate |
|||
Domestic players are much stronger in the other pet food markets then they are in the markets for dog or cat food. In 2021, the leading player in the other pet food market was Charoen Pokphand Group, with a 33.9% share. See-All Aquariums Co Ltd was a close second, with a 32.9% share, while Hunter Group Ltd was a distant third with a 3.1% share.
| Company | 2016 | 2017 | 2018 | 2019 | 2020 | 2021 | CAGR* % 2016-2021 |
|---|---|---|---|---|---|---|---|
| Total | 100.0 | 100.0 | 100.0 | 100.0 | 100.0 | 100.0 | 0.0 |
| Charoen Pokphand Group | 32.0 | 32.9 | 35.2 | 34.9 | 34.3 | 33.9 | 1.2 |
| See-All Aquariums Co Ltd | 28.3 | 28.4 | 30.4 | 30.9 | 31.7 | 32.9 | 3.1 |
| Versele-Laga NV | 3.4 | 3.9 | 3.7 | 3.4 | 3.3 | 3.1 | −1.8 |
| Hunter Group Ltd | 5.4 | 5.4 | N/C | ||||
| Private Label | 0.4 | 0.3 | 0.3 | 0.2 | 0.2 | 0.2 | −12.9 |
| Others | 30.6 | 29.0 | 30.4 | 30.5 | 30.5 | 29.9 | −0.5 |
|
Source: Euromonitor International, 2022 *CAGR: Compound Annual Growth Rate N/C: Not calculable |
|||||||
Distribution channels
The vast majority of pet food sales in Thailand occurred through store-based retailing, which accounted for 83.3% of sales in 2021. The remaining sales were split between veterinary clinics (9.6% market share), and e-commerce (7.1% market share). Within store based-retailing, modern grocery retailers made up about half of sales. Hypermarkets accounted for 34.9% of grocery retail sales, and 29.1% of the total pet food markets. Supermarkets, meanwhile, accounted for 13.1% of grocery sales, and 10.9% of pet food sales. Traditional grocery retailers accounted for 11.3% of grocery sales, and 9.4% of the pet food market. Non-grocery specialists were another large category, accounting for 40.8% of grocery sales and 34.0% of pet food sales. This category was dominated by pet shops, while pet superstores also had a small presence.
In 2021, Modern Grocery retailers were more popular among cat owners than dog and other pet owners. Hypermarkets are especially prominent in the distribution of cat food, where they had a 38.5% share, compared with a 26.6% share for dog food and 15.3% share for other pet food. Supermarkets meanwhile had a 13.5% share for cat food, above the 10.0% share for dog food and 10.3% share for other pet food. E-commerce also plays a larger role in the distribution of cat food, with an 8.4% market share. Pet shops, meanwhile, are popular among dog owners, with a 35.7% share of dog food sales compared with 28.9% for cat food sales.
Store based retailing and veterinary clinics both lost market share from 2016-2021, while e-commerce enjoyed rapid growth. Supermarkets and Hypermarkets have both benefitted from the pandemic, as they remained open during lockdowns. Traditional grocery retailers and non-grocery specialists have suffered more, both seeing falls in markets share. Traditional grocery retailers, which already suffered from a declining market share, saw this decline accelerate. Modern grocery retailers are expected to see a partial reversal of their pandemic gains as the country reopens (Euromonitor International, 2022).
| Channel | 2016 | 2017 | 2018 | 2019 | 2020 | 2021 | CAGR* % 2016-2021 |
|---|---|---|---|---|---|---|---|
| Distribution channel (total) | 100.0 | 100.0 | 100.0 | 100.0 | 100.0 | 100.0 | 0.0 |
| Store-Based Retailing | 85.9 | 85.5 | 85.5 | 85.3 | 83.5 | 83.3 | −0.6 |
| Grocery Retailers | 49.7 | 49.2 | 48.8 | 48.2 | 49.4 | 49.3 | −0.2 |
| Modern Grocery Retailers | 38.7 | 38.5 | 38.3 | 38.0 | 39.9 | 40.0 | 0.7 |
| Hypermarkets | 28.6 | 28.3 | 28.1 | 27.8 | 29.1 | 29.1 | 0.3 |
| Supermarkets | 10.1 | 10.1 | 10.2 | 10.1 | 10.8 | 10.9 | 1.5 |
| Traditional Grocery Retailers | 11.0 | 10.7 | 10.5 | 10.2 | 9.6 | 9.4 | −3.1 |
| Non-Grocery Specialists | 36.1 | 36.35 | 36.7 | 37.2 | 34.0 | 34.0 | −1.2 |
| Pet superstores | 0.7 | 0.7 | 0.7 | 0.7 | 0.6 | 0.6 | −3.0 |
| Pet shops | 35.4 | 35.6 | 36.0 | 36.5 | 33.4 | 33.3 | −1.2 |
| Non-Store Retailing | 4.2 | 4.7 | 5.3 | 5.5 | 6.9 | 7.1 | 11.1 |
| E-Commerce | 4.2 | 4.7 | 5.3 | 5.5 | 6.9 | 7.1 | 11.1 |
| Non-retail channels | 9.9 | 9.8 | 9.3 | 9.2 | 9.6 | 9.6 | −0.6 |
| Veterinary clinics | 9.9 | 9.8 | 9.3 | 9.2 | 9.6 | 9.6 | −0.6 |
|
Source: Euromonitor International, 2022 *CAGR: Compound Annual Growth Rate |
|||||||
Trade overview
Global imports
Globally, the market for pet food increased at a CAGR if 12.8% from 2016-2021, with total imports reaching a value of US$20.6 billion in 2021. The largest markets were Germany with imports of US$2.0 billion (9.6% market share), the United States with imports of US$1.5 billion (7.5% market share) and Poland with imports of US$1.1 billion (5.6% market share).
Thailand was a relatively small pet food market, ranking forty-eighth for total pet food imports in 2021. Total imports were US$66.5 million, representing 0.3% of the global market. Imports grew at a CAGR of 4.3% from 2016-2021, well below the global growth rate.
| Country | 2016 | 2017 | 2018 | 2019 | 2020 | 2021 | CAGR* % 2016-2021 | Market share % 2021 |
|---|---|---|---|---|---|---|---|---|
| World (total) | 11,288.4 | 12,826.7 | 14,093.0 | 14,999.7 | 17,578.6 | 20,569.4 | 12.8 | 100.0 |
| Germany | 1,079.0 | 1,349.7 | 1,466.6 | 1,515.4 | 1,685.3 | 1,975.1 | 12.9 | 9.6 |
| United States | 783.6 | 847.0 | 986.4 | 1,032.0 | 1,236.7 | 1,540.4 | 14.5 | 7.5 |
| Poland | 214.3 | 440.4 | 570.6 | 695.8 | 989.3 | 1,149.7 | 39.9 | 5.6 |
| United Kingdom | 741.2 | 845.8 | 880.8 | 928.9 | 1,007.2 | 1,122.9 | 8.7 | 5.5 |
| Canada (5) | 621.4 | 668.7 | 683.2 | 799.9 | 898.2 | 1,064.1 | 11.4 | 5.2 |
| France | 653.8 | 684.4 | 702.4 | 720.9 | 903.2 | 1,054.8 | 10.0 | 5.1 |
| Italy | 572.3 | 617.2 | 633.9 | 681.7 | 708.8 | 852.7 | 8.3 | 4.1 |
| Netherlands | 480.4 | 537.2 | 638.3 | 611.0 | 700.1 | 782.1 | 10.2 | 3.8 |
| Belgium | 558.0 | 598.0 | 518.0 | 528.6 | 675.8 | 748.3 | 6.0 | 3.6 |
| Japan | 641.6 | 619.4 | 644.0 | 646.8 | 674.4 | 702.7 | 1.8 | 3.4 |
| Thailand (48) | 53.9 | 59.5 | 60.0 | 56.0 | 54.8 | 66.5 | 4.3 | 0.3 |
|
Source: Global Trade Tracker, 2022 *CAGR: Compound Annual Growth Rate |
||||||||
Thai imports
In 2021, The three largest suppliers of pet food to Thailand were South Korea with a 31.5% market share, China with a 21.8% share, and the United States, with a 19.1% share. Recently, South Korea and China have seen their pet food exports to China surge, with them having had negligible market shares as recently as 2018. The United States, meanwhile, has been a top exporter to Thailand for longer, with its exports growing at a CAGR of 6.2% from 2016-2021. France had been a top supplier of pet food to Thailand, however has seen its market share decline sharply since 2019, although it remains the fourth largest supplier. Canada was the seventh largest supplier of pet food to Thailand in 2021, with exports of US$1.9 million and a 13.7% market share.
| Country | 2016 | 2017 | 2018 | 2019 | 2020 | 2021 | CAGR* % 2016-2021 | Market share % 2021 |
|---|---|---|---|---|---|---|---|---|
| World (total) | 54.0 | 59.3 | 59.6 | 56.2 | 54.7 | 66.6 | 0.0 | 100.0 |
| South Korea | 0.1 | 0.0 | 0.0 | 3.8 | 17.4 | 21.0 | 191.4 | 31.5 |
| China | 0.8 | 0.2 | 0.2 | 0.2 | 3.7 | 14.5 | 78.5 | 21.8 |
| United States | 9.4 | 10.5 | 11.9 | 12.4 | 14.8 | 12.7 | 6.2 | 19.1 |
| France | 15.1 | 16.6 | 18.5 | 17.7 | 7.2 | 5.4 | −18.6 | 8.1 |
| Australia | 5.8 | 6.4 | 3.6 | 4.0 | 2.6 | 4.2 | −6.3 | 6.3 |
| Austria | 2.0 | 2.4 | 2.6 | 2.8 | 3.2 | 3.9 | 14.3 | 5.9 |
| Canada (7) | 1.0 | 0.9 | 1.0 | 1.0 | 1.2 | 1.9 | 13.7 | 2.8 |
| Thailand | 0.7 | 0.6 | 0.4 | 1.3 | 0.5 | 0.9 | 1.4 | 1.4 |
| Hungary | 0.0 | 0.2 | 0.4 | N/C* | 0.6 | |||
| United Kingdom | 0.1 | 0.1 | 0.3 | 0.3 | 0.3 | 0.4 | 32.0 | 0.6 |
|
Source: Global Trade Tracker, 2022 *CAGR: Compound Annual Growth Rate N/C: Not calculable |
||||||||
Thai import requirements
Thai imports of ready-to-eat dog, cat, and rabbit food (except rabbit food that is fresh or dried plant) are regulated by the Department of Livestock Development. Exporters seeking to sell dog and cat food to Thailand must register their products with this the Department of Livestock Development, and they must also obtain a permit from the Department. Pet food for birds, rodents, and fish are also regulated by the Department of Livestock Development, and the department must be notified of all such products being imported into the country. However, bird, rodent, and fish food are exempt from registration and import permit requirements. Ready-to-eat rabbit food that consists of fresh or dried plant regulated by the Department of Agriculture. (Flanders Investment and Trade).
Canada's performance
In 2021, Canada was Thailand's seventh largest supplier of pet food, with a 2.8% market share. Canadian exports to Thailand spiked sharply in 2021, rising from US$1.2 million to US$1.9 million. Overall, exports grew at a CAGR if 13.7% from 2016-2021. Thailand imported a total of 734,263 kilograms of Canadian pet food in 2021. Canada exported US$1.6 million worth of dog and cat food, as well as US$0.3 million worth of canary seed. Although dog and cat food exports made up the majority of Canada's supplies to Thailand, Canada held an 80.4% share of the canary seed market, compared to 2.4% for dog and cat food.
| HS code | Description | Import value (US$) | Import volume (kg) | Market share % |
|---|---|---|---|---|
| Pet food total | 1,871,652.0 | 734,263.0 | 2.8 | |
| 230910 | dog or cat food, put up for retail sale | 1,602,922.8 | 384,363.0 | 2.4 |
| 100830 | canary seed | 268,729.2 | 349,900.0 | 80.6 |
| Source: Global Trade Tracker, 2022 | ||||
According to Canadian export data, in 2021 Canada exported US$2.0 million worth of pet food to Thailand, including US$1.7 million worth of dog and cat food and US$0.3 million worth of canary seed. The top supplier of dog and cat food was Alberta, responsible for 92.9% of Canadian dog and cat food exports to Thailand. Meanwhile, Saskatchewan accounted for 80.4% of Canadian canary seed supplies to Thailand.
| HS code | Description | Export value (US$) | Export volume (kg) | Top provincial suppliers and market value share % | ||
|---|---|---|---|---|---|---|
| Pet food total | 2,003,665 | 1,135,000 | Alberta (80.1%) | Saskatchewan (11.1%) | British Columbia (7.4%) | |
| 230910 | Dog or cat food, put up for retail sale | 1,726,854 | 734,783 | Alberta (92.9%) | British Columbia (6.6%) | Ontario (0.5%) |
| 100830 | Canary seed | 276,811 | 400,217 | Saskatchewan (80.4%) | British Columbia (12.1%) | Manitoba (7.5%) |
| Source: Global Trade Tracker, 2022 | ||||||
Product launch analysis
According to Mintel's Global New Products Database (GNPD), the total number of new pet food product launches from January of 2016 to December of 2021 was 675. The number of new product launches declined over this period, falling from 126 launches in the year of 2016 to 95 launches in 2021, falling at a CAGR of 5.9% over the historic period.
The top subcategory was dog snacks and treats, accounting for 282 claims (41.8% of total launches). Dry dog food accounted for 110 launches (16.3%), while wet dog food accounted for 93 claims (13.8%). The top claims were skin and coat, which applied to 247 products (36.6% of total), pet - adult, which applied to 235 (34.8%), and vitamin/mineral fortified which accounted for 231 claims (34.2%). By far the most popular price grouping was US$0.31-4.30, with 73.9% of products falling in this range.
The three most popular packaging types were flexible packages (251 products, 37.2% of total launches), flexible stand-up pouches (195, 28.9%), and flexible sachets (15.3%). Top three launch types were new variety/range extension (274, 40.6%), new product (255, 37.8%), and new packaging (88, 13.0%). The top flavour was chicken with 74 launches, or 11.0% of the total. This was followed by plain with 71 launches and 10.5% of the total. The next most popular flavour was beef, with 39 launches, or 5.8%. Meanwhile, vitamins and chicken were tied for the most popular ingredient, with 246 products listing each as an ingredient. 36.4% of new product launches listed each as an ingredient.
| Product attributes | Yearly launch counts | Total | |||||
|---|---|---|---|---|---|---|---|
| 2016 | 2017 | 2018 | 2019 | 2020 | 2021 | ||
| Yearly product launches | 129 | 116 | 118 | 105 | 112 | 95 | 675 |
| Top subcategories | |||||||
| Dog Snacks & Treats | 56 | 52 | 45 | 45 | 49 | 35 | 282 |
| Dog Food Dry | 16 | 27 | 16 | 22 | 17 | 12 | 110 |
| Dog Food Wet | 19 | 15 | 26 | 12 | 14 | 7 | 93 |
| Cat Food Dry | 15 | 11 | 12 | 9 | 15 | 17 | 79 |
| Cat Food Wet | 12 | 3 | 14 | 8 | 7 | 12 | 56 |
| Top claims | |||||||
| Skin & Coat (Functional Pet) | 45 | 41 | 31 | 50 | 41 | 39 | 247 |
| Pet - Adult | 40 | 40 | 35 | 37 | 38 | 45 | 235 |
| Vitamin/Mineral Fortified | 17 | 30 | 49 | 46 | 42 | 47 | 231 |
| Social Media | 22 | 38 | 33 | 29 | 40 | 31 | 193 |
| Joints, Bones & Muscles (Functional Pet) | 34 | 27 | 21 | 36 | 41 | 29 | 188 |
| Top price groupings (US$) | |||||||
| 0.31 - 4.30 | 104 | 81 | 90 | 73 | 83 | 68 | 499 |
| 4.31 - 8.30 | 22 | 25 | 23 | 23 | 21 | 23 | 137 |
| 8.31 - 12.30 | 2 | 8 | 2 | 6 | 4 | 4 | 26 |
| 12.31 - 16.30 | 0 | 0 | 2 | 1 | 3 | 0 | 6 |
| 16.31 - 21.00 | 0 | 2 | 1 | 1 | 1 | 0 | 5 |
| Imported status | |||||||
| Imported | 3 | 8 | 11 | 5 | 3 | 1 | 31 |
| Not imported | 52 | 36 | 37 | 43 | 55 | 48 | 271 |
| Top packaged types | |||||||
| Flexible | 55 | 54 | 33 | 40 | 47 | 22 | 251 |
| Flexible stand-up pouch | 27 | 29 | 39 | 33 | 32 | 35 | 195 |
| Flexible sachet | 18 | 17 | 26 | 12 | 13 | 17 | 103 |
| Can | 18 | 11 | 13 | 12 | 8 | 8 | 70 |
| Skinpack | 6 | 1 | 0 | 5 | 4 | 2 | 18 |
| Top launch types | |||||||
| New Variety/Range Extension | 43 | 55 | 46 | 39 | 54 | 37 | 274 |
| New Product | 59 | 29 | 55 | 41 | 40 | 31 | 255 |
| New Packaging | 17 | 26 | 11 | 14 | 8 | 12 | 88 |
| Relaunch | 10 | 6 | 5 | 7 | 9 | 15 | 52 |
| New Formulation | 0 | 0 | 1 | 4 | 1 | 0 | 6 |
| Top flavours (including blend) | |||||||
| Chicken | 21 | 8 | 9 | 9 | 16 | 11 | 74 |
| Unflavoured/Plain | 12 | 18 | 8 | 12 | 13 | 8 | 71 |
| Beef | 8 | 7 | 6 | 8 | 5 | 5 | 39 |
| Salmon | 5 | 2 | 4 | 3 | 11 | 4 | 29 |
| Tuna | 5 | 4 | 4 | 4 | 4 | 7 | 28 |
| Top ingredients | |||||||
| Vitamins (Food) | 35 | 41 | 51 | 34 | 43 | 42 | 246 |
| Chicken Meat (Food) | 52 | 34 | 46 | 41 | 38 | 35 | 246 |
| Minerals (Food) | 35 | 38 | 42 | 33 | 40 | 39 | 227 |
| Food Colours | 50 | 30 | 36 | 27 | 39 | 38 | 220 |
| Preservatives | 41 | 34 | 35 | 36 | 38 | 34 | 218 |
Examples of new products
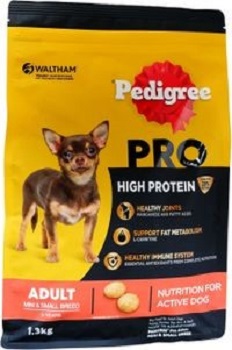
High Protein Dry Food For Adult Dogs
Source: Mintel, 2022
| Company | Mars Petcare |
|---|---|
| Brand | Waltham Pedigree Pro |
| Category | Pet food |
| Sub-category | Dog Food Dry |
| Market | Thailand |
| Store type | Mass merchandise / hypermarket |
| Date published | September 2022 |
| Launch type | New product |
| Price in US dollars | 5.59 ($0.43 per 100 grams) |
Waltham Pedigree Pro High Protein Dry Food For Adult Dogs is a new product which retails in a 1.3 kilogram pack. The product boats a number of health claims, including high protein, as well as other nutrients that supposedly support joint health, metabolism, and immune system.
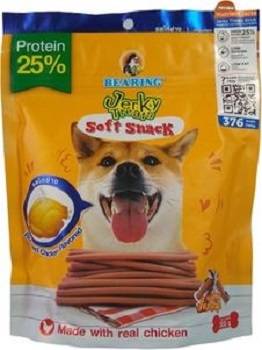
Roasted Chicken Flavoured Jerky Treat Sticks for Dogs
Source: Mintel, 2022
| Company | Bearing Petcare |
|---|---|
| Brand | Bearing |
| Category | Pet food |
| Sub-category | Dog snacks and treats |
| Market | Thailand |
| Store type | Supermarket |
| Date published | September 2022 |
| Launch type | New packaging |
| Price in US dollars | 3.58 ($1.19 per 100 grams) |
Bearing Roasted Chicken Flavoured Jerky Treat Sticks for Dogs now retails in a new 300 gram pack. The product emphasizes that it is made from real chicken, as well as its high protein content, low sodium and fat contents, and its softness of ease and digestion. The product also claims to be pleasurable to chew for the dog.
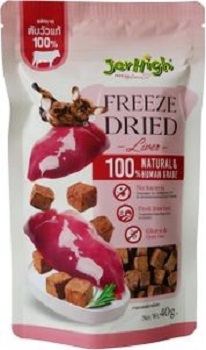
Freeze Dried Liver
Source: Mintel, 2022
| Company | Kelly and Companion |
|---|---|
| Brand | JerHigh |
| Category | Pet food |
| Sub-category | Dog snacks and treats |
| Market | Thailand |
| Store type | Supermarket |
| Date published | September 2022 |
| Launch type | New variety / range extension |
| Price in US dollars | 2.70 ($6.75 per 100 grams) |
JerHigh Freeze Dried Liver now retails in a 40g pack. The product claims to be made with beef liver that of high enough quality to be fit for human consumption, as well as to benefit from a Canadian sterilization process. The product emphasizes a high protein content, as well as the absence of additives.
Lamb Flavoured Den-To Stick

Source: Mintel, 2022
| Company | Lotus's |
|---|---|
| Brand | Lotus's |
| Category | Pet food |
| Sub-category | Dog Snacks and treats |
| Market | Thailand |
| Store type | Mass merchandise / hypermarket |
| Date published | September 2022 |
| Launch type | New variety / range extension |
| Price in US dollars | 1.18 ($1.20 per 100 grams) |
Lotus's Lamb Flavoured Den-To Stick now retails in a 98 gram pack, each containing 4 sticks. The product claims to be for medium dogs, and to promote gum health.
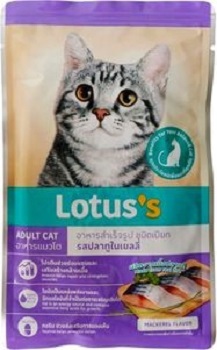
Mackerel Flavoured in Jelly Adult Cat Food
Source: Mintel, 2022
| Company | Lotus's |
|---|---|
| Brand | Lotus's |
| Category | Pet food |
| Sub-category | Cat food wet |
| Market | Thailand |
| Store type | Mass merchandise / hypermarket |
| Date published | August 2022 |
| Launch type | New packaging |
| Price in US dollars | 0.40 ($0.50 per 100 grams) |
Lotus's Mackerel Flavoured in Jelly Adult Cat Food now retails in an 80 gram package. The product claims to be made from real fish, as well as to be high in protein, fat, and taurine. The product claims to be good for eyesight, joints, bones and muscles, as well as helping cats gain weight and muscle.
For more information
The Canadian Trade Commissioner Service:
International Trade Commissioners can provide Canadian industry with on-the-ground expertise regarding market potential, current conditions and local business contacts, and are an excellent point of contact for export advice.
More agri-food market intelligence:
International agri-food market intelligence
Discover global agriculture and food opportunities, the complete library of Global Analysis reports, market trends and forecasts, and information on Canada's free trade agreements.
Agri-food market intelligence service
Canadian agri-food and seafood businesses can take advantage of a customized service of reports and analysis, and join our email subscription service to have the latest reports delivered directly to their inbox.
More on Canada's agriculture and agri-food sectors:
Canada's agriculture sectors
Information on the agriculture industry by sector. Data on international markets. Initiatives to support awareness of the industry in Canada. How the department engages with the industry.
Resources
- Euromonitor International:
- Country Report; Pet care in Thailand, May 2022
- Country Report; Dog food in Thailand, May 2022
- Country Report; Cat food in Thailand, May 2022
- Country Report; Other pet food in Thailand, May 2022
- Global Trade Tracker, 2022
- Flanders Investment & Trade. Pet Food Market in Thailand, December 2020
- Mintel Global New Products Database, 2022
Sector Trend Analysis – Pet food trends in Thailand
Global Analysis Report
Prepared by: Brendan Dwyer, Student (co-op)
© His Majesty the King in Right of Canada, represented by the Minister of Agriculture and Agri-Food (2023).
Photo credits
All photographs reproduced in this publication are used by permission of the rights holders.
All images, unless otherwise noted, are copyright His Majesty the King in Right of Canada.
To join our distribution list or to suggest additional report topics or markets, please contact:
Agriculture and Agri-Food Canada, Global Analysis1341 Baseline Rd, Tower 5, 3rd floor
Ottawa ON K1A 0C5
Canada
Email: aafc.mas-sam.aac@agr.gc.ca
The Government of Canada has prepared this report based on primary and secondary sources of information. Although every effort has been made to ensure that the information is accurate, Agriculture and Agri-Food Canada (AAFC) assumes no liability for any actions taken based on the information contained herein.
Reproduction or redistribution of this document, in whole or in part, must include acknowledgement of agriculture and agri-food Canada as the owner of the copyright in the document, through a reference citing AAFC, the title of the document and the year. Where the reproduction or redistribution includes data from this document, it must also include an acknowledgement of the specific data source(s), as noted in this document.
Agriculture and Agri-Food Canada provides this document and other report services to agriculture and food industry clients free of charge.