

Note: This report includes forecasting data that is based on baseline historical data.
Executive summary
Indonesia has witnessed long-term growth in its-middle-class consumer base, positively influencing consumer spending. Millennials (aged 25-39) currently represent a large proportion of the overall consumer market. They enjoy trying new products and services and are willing to spend money in order to save time.
Palm was the largest processed (oil) crop in Indonesia with a production of 44.8 million tonnes in 2020, representing the largest increase in compound annual growth rate (CAGR) of 9.0% from 31.7 million tonnes processed in 2016.
The global market for cooking oils has experienced positive growth with a moderate compound annual growth rate (CAGR) of 10.1% as imports have increased from US$77.5 billion in 2017 to US$125.6 billion in 2022.
Indonesia was the fifty-fourth largest global market for cooking oils and experienced a substantial increase in CAGR of 21.4% as imports increased from US$94.3 million in 2017 to US$248.5 million in 2022 (0.2% market share in 2022). Canada in comparison, was the twenty-seventh largest global market for cooking oils with import values of US$1.1 billion (0.9% market share) in 2022, representing a moderate increase in CAGR of 13.7% from imports valued at US$574.4 million in 2017.
The cooking oil retail market in Indonesia was valued at US$3.7 billion in 2022. The top cooking oil categories in Indonesia, in terms of retail value sales in 2022, was predominantly palm oil (94.9% market share) increasing at a CAGR of 20.2% from US$1.4 billion in 2017, followed by olive oil valued at US$115.4 million (3.1% market share), representing an increase in CAGR of 13.0% from US$62.6 million in 2017 and other edible oil with values of US$41.2 million (1/1% market share) and increasing in CAGR by 7.5% from US$28.7 million in 2017.
Growth in the cooking oil category is expected to remain relatively positive (6.5%), as retail sales reach US$5.0 billion by 2027. Indofood Sukses Makmur Tbk PT (Brand name; Bimoli and Happy) was the largest cooking oil company in Indonesia with retail sales of US$1.3 billion (36.0% market share) in 2022.
According to Mintel's Global New Products Database (GNPD), there were 453 new cooking oil food products launched in Indonesia between January 2017 and December 2022.
Indonesian market and consumer overview
Economy, finance and trade
According to Euromonitor International, following a contraction of 2.1% in 2020 due to the emerging pandemic, real GDP in Indonesia increased by 3.5% over 2021 to 3.8%. The economy expanded at a faster rate throughout 2022 at 4.9% as stronger private consumption and investment, increased exports, robust industrial activity and supportive macroeconomic policy measures helped to accelerate recovery. Relatedly, under the National Medium-Term Development Plan 2020-2024, the country aims to increase prosperity, improve infrastructure, increase investment in human capital and enhance public services, planning to become a developed economy by 2045. Indonesia also increased value-added-tax (VAT) from 10.0% to 11.0% in April 2022 and will further increase the VAT to 12.0% in 2025.
In January 2022, the Regional Comprehensive Economic Partnership (RCEP) came into effect creating a new Asia-Pacific trading bloc between the 10 ASEAN (Association of Southeast Asian Nations) countries, Australia, China, Japan, New Zealand and South Korea. The RCEP is expected to boost Indonesia's economic development and promote stronger trading relationships between members through tariff reductions and simplification of trading rules (Euromonitor International 2022).
Income and expenditure
The average gross annual income in Indonesia was US$3,074 in 2021 and is anticipated to reach US$6,555 by 2040. The population aged 30-34 is forecast to remain the highest income earners per capita over 2021-2040 while the consumer group aged 35-39 will be prevalent in the top-income band (those with an annual gross income over US$250,001), influencing luxury spending patterns in Indonesia (Euromonitor International 2022).
Private consumption growth remained hindered due to the pandemic which effected economic and labour market recovery. During 2021-2040, private consumption is expected to increase by 144% in real terms due to improving living standards, low household indebtedness as well as a large and expanding middle class, accounting for 52.5% of GDP in 2040. Food and non-alcoholic beverages remains the largest consumer spending category in Indonesian (roughly US$3,000 per household in 2021 and is forecast to reach US$6,100 per household by 2040), followed by the transportation and hotels and catering consumer spending categories (Euromonitor International 2022).
The Jawa Barat region is anticipated to remain the largest consumer market in Indonesia by 2040, accounting for 19.6% of total consumer expenditure while Rau, one of the richest provinces in Indonesia due to its abundant natural resources, is projected to attain the most rapid expansion as a consumer market in the forecast period (Euromonitor International 2022).
Households
The number of households in Indonesia is anticipated to expand by 15.2% over the forecast period, reaching 80.5 million by 2040 due to the prevailing traditional lifestyle of marrying and having children young (the average age at first marriage for women is 21.0 years and 2.0 years for men in 2021) (Euromonitor International 2022).
Couples with children are expected to be the fastest-growing household type, expanding 16.6% between 2021-2040 and will retain the highest spending power among household types, mainly due to its larger size. Singleton households in comparison, will attain the fastest spending growth, with expenditure per household increasing by more than three times over the forecast period (Euromonitor International 2022).
In 2021, 57.9% of the Indonesian population was living in urban areas and will increase to 67.2% of the total population by 2040. Relatedly, disposable income per household in urban areas was 58.5% higher than in rural areas in 2021 and will only be 15.4% higher in 2040 as more rural capital investments and economic support schemes lessen the income gap between urban and rural areas (Euromonitor International 2022).
Consumers
Indonesia has witnessed long-term growth in its-middle-class consumer base, positively influencing consumer spending. The presence of the pandemic however has hindered economic and labour market recovery and encouraged cautious and conscientious consumer spending (Euromonitor International 2022).
Indonesia's population is forecast to increase 14.2% to reach 319 million and attain a median age of 35.1 by 2040, signifying the country's growing, and relatively youthful, consumer market potential. Millennials (aged 25-39) currently represent a large proportion of the overall consumer market. They enjoy trying new products and services and are willing to spend money in order to save time, while Gen Z (aged 15-24) are the thriftiest, leading a minimalist lifestyle (Euromonitor International 2022).
According to Euromonitor Voice of the Consumer: Lifestyles Survey 2022, the global pandemic focused the consumers attention on their diets and eating habits, and consumers sought to bolster their general health and immunity by consuming healthier food and beverages. In addition, 67% of consumers report that they look for healthy ingredients in food and beverages, and 43% say they actively monitor the calories in the food that they eat. In terms of Indonesian cooking and eating habits, home food deliveries are popular as fast-paced lifestyles leave less time for cooking at home (Euromonitor International 2022).
Production (cooking oils)
Oil palm fruit was the largest crop produced in Indonesia with 256.6 million tonnes recorded in 2021, representing an increase in CAGR of 1.3% from 243.7 million tonnes produced in 2017. Maize (corn) was the second largest crop with production of 20.0 million tonnes in 2021, despite declining in CAGR by 8.8% from 28.9 million tonnes in 2017. Soybean production experienced the largest decline in CAGR of 10.3% as crop production decreased from 538,729 tonnes in 2017 to 348,000 tonnes in 2021 (previous attempts to increase soybean production in Indonesia has been challenged by policies that favour or provide incentives (Government support structures ranging from fertilizer, seeds, improved infrastructure, and minimum farm gate prices) for corn and paddy production. Relatedly, demand for local rice and corn are also comparatively stronger than for soybeans, as local beans tend to be smaller and carry colour characteristics that are less desirable for the production of tempeh (tempeh and tofu are staples of the Indonesian diet). (United States Department of Agriculture (USDA); March 16, 2021)
| Crops (tonnes) | 2017 | 2018 | 2019 | 2020 | 2021 | CAGR* % 2017-2021 |
|---|---|---|---|---|---|---|
| Oil palm fruit | 243,721,458 | 247,486,951 | 248,348,605 | 250,039,391 | 256,591,203 | 1.3 |
| Maize (corn)[1] | 28,924,015 | 30,253,938 | 19,650,000 | 24,687,000 | 20,010,000 | −8.8 |
| Groundnuts | 849,000 | 886,000 | 725,000 | 715,000 | 759,000 | −2.8 |
| Green corn (maize)[1] | 690,000 | 768,814 | 612,120 | 636,198 | 653,822 | −1.3 |
| Soybeans[1] | 538,729 | 953,571 | 424,000 | 273,000 | 348,000 | −10.3 |
|
Source: FAOSTAT Agricultural Production (crops and livestock products), 2023 *CAGR: Compound Annual Growth Rate 1: Crops also produced in Canada |
||||||
Palm was the largest processed (oil) crop in Indonesia with a production of 44.8 million tonnes in 2020, representing the largest increase in CAGR of 9.0% from 31.7 million tonnes processed in 2016. According to the USDA, favourable weather conditions, higher palm oil prices (leading to increasing harvest efficiency and production), and increased fertilizer use were expected to increase the production of palm oil in Indonesia to 45.5 million tonnes during 2021/22 (USDA; March 16, 2021). The USDA also reports that palm oil for food use was also expected to increase to 6.1 million tonnes in 2021/22 due to greater demand from the food service sector and increased use in processed products. Continued strong demand for home consumption was also expected as total food consumption was forecast to reach 5.8 million tonnes in 2020/21. Relatedly, the supply and availability of palm oil can also be effected.
Recently, Indonesia implemented an export ban on palm oil effective April 28th to May 22nd 2022, during a period when commodities and vegetable oil prices were already elevated, in order to ensure the provision of an affordable, and sufficient domestic supply of cooking oil for Indonesia, and end of Ramadan celebrations. Earlier, in January 2022, the Ministry of Trade imposed a requirement to register and approve the export of palm oil, which included a requirement for an Independent Statement Letter indicating that the exporter has met, and distributed palm oil for domestic needs, at a regulated price. Exporters were also required to include a sales contract in addition to an export plan, and domestic distribution plan for a period of six months (Canadian Trade Commissioner Service: Indonesia, April 2023). Currently, in 2023, Indonesia has modified their trade rules permitting exporters to ship just six times their domestic palm oil sales volume, less than a fourth-quarter 2022 ratio of eight times their domestic palm oil sales volume. (Reuters, January 2023). Moreover, the country has also implemented the B35 mandate in 2023 which stipulates that diesel (a derivative and non-edible use of palm oil) sold has to contain 35% palm-based fatty acid methyl ester. The Indonesian Biofuel Producers Association reports that the mandate will now utilize 11.4 million tonnes in palm oil in 2023, representing an increase from the 9.6 million tonnes in 2022 under the country's B30 measure (Reuters, January 2023).
Palm kernel is the second largest processed (oil) crop with 4.4 million tonnes in 2020, increasing by a CAGR of 6.7% from 3.4 million tonnes in 2016, while coconut oil experienced the largest decline in CAGR (12.4%) as volume decreased from 1.0 million tonnes in 2016 to 599,000 tonnes in 2020. Similarly, soybean oil production also declined in CAGR by 3.2% during the same period.
Palm kernel oil is used in personal home-care products such as butter, soaps and cosmetics. In the food sector, palm kernel oil serves as a cheaper replacement for coconut oil and substitute for cocoa butter in chocolate confectionery (USDA, March 16, 2021). In regards to palm kernel oil production, the USDA (Post) has estimated production to reach 5.2 million tonnes by 2021/22, based upon 11.9 million tonnes of crushed palm kernels in 2021/22.
| Crops (tonnes) | 2016 | 2017 | 2018 | 2019 | 2020 | CAGR* % 2016-2020 |
|---|---|---|---|---|---|---|
| Oil, palm | 31,730,961 | 37,965,224 | 40,567,230 | 47,120,247 | 44,759,147 | 9.0 |
| Oil, of palm kernel | 3,434,900 | 3,889,400 | 4,364,500 | 4,577,600 | 4,448,900 | 6.7 |
| Oil, coconut | 1,019,000 | 968,000 | 951,000 | 895,000 | 599,000 | −12.4 |
| Oil, soybean[1] | 447,706 | 440,674 | 507,002 | 447,769 | 393,473 | −3.2 |
| Oil, groundnut | 24,870 | 26,661 | 27,020 | 26,625 | 24,681 | −0.2 |
|
Source: FAOSTAT Agricultural Production (crops and livestock products), 2023 *CAGR: Compound Annual Growth Rate 1: Crops also produced in Canada |
||||||
Global trade overview of cooking oils
The global market for cooking oils has experienced positive growth with a moderate CAGR of 10.1% as imports have increased from US$77.5 billion in 2017 to US$125.6 billion in 2022. India was the largest global market for cooking oils in 2022 with imports valued at US$21.5 billion, (17.1% market share) representing a CAGR of 12.7% from US$11.8 billion in 2017, followed by the United States (U.S) with imports valued at US$11.9 billion (9.4% market share) and increase in CAGR of 12.8% from US$6.5 billion in 2017 and China, with import values of US$11.5 billion (9.2% market share) in 2022.
Indonesia was the fifty-fourth largest global market for cooking oils and experienced a substantial increase in CAGR of 21.4% as imports increased from US$94.3 million in 2017 to US$248.5 million in 2022 (0.2% market share in 2022). Canada in comparison, was the twenty-seventh largest global market for cooking oils with import values of US$1.1 billion (0.9% market share) in 2022, representing a moderate increase in CAGR of 13.7% from imports valued at US$574.4 million in 2017.
| Country | 2017 | 2018 | 2019 | 2020 | 2021 | 2022 | CAGR* % 2017-2022 | Market share (%) in 2022 |
|---|---|---|---|---|---|---|---|---|
| Global total | 77.5 | 75.1 | 71.2 | 78.7 | 113.8 | 125.6 | 10.1 | 100.0 |
| India | 11.8 | 10.1 | 9.7 | 10.5 | 17.3 | 21.5 | 12.7 | 17.1 |
| United States | 6.5 | 6.3 | 5.7 | 6.0 | 8.9 | 11.9 | 12.8 | 9.4 |
| China | 7.2 | 7.3 | 8.7 | 9.9 | 13.4 | 11.5 | 9.9 | 9.2 |
| Netherlands | 4.5 | 4.2 | 3.9 | 4.4 | 5.8 | 6.0 | 5.8 | 4.8 |
| Italy | 4.2 | 3.9 | 3.6 | 3.7 | 4.6 | 5.2 | 2.4 | 4.1 |
| Germany | 3.0 | 2.6 | 2.4 | 2.6 | 3.5 | 4.5 | 8.9 | 3.6 |
| Spain | 2.9 | 2.8 | 2.3 | 2.8 | 3.6 | 4.4 | 8.5 | 3.5 |
| Turkey | 1.3 | 1.0 | 1.0 | 1.4 | 2.3 | 3.8 | 23.4 | 3.0 |
| Pakistan | 1.9 | 2.1 | 1.9 | 2.2 | 3.5 | 3.4 | 16.2 | 2.7 |
| Malaysia | 1.3 | 1.3 | 1.2 | 1.5 | 2.4 | 3.1 | 19.3 | 2.5 |
| Canada (27) | 0.6 | 0.6 | 0.6 | 0.7 | 0.8 | 1.1 | 13.7 | 0.9 |
| Indonesia (54) | 0.1 | 0.1 | 0.2 | 0.1 | 0.2 | 0.2 | 21.4 | 0.2 |
|
Source: Global Trade Tracker, 2023 1: For the purpose of this report, 'cooking oil' is defined by HS codes 1507 to 1515, inclusively. *CAGR: Compound Annual Growth Rate |
||||||||
Indonesian trade overview of cooking oils
Indonesia is a net exporter of cooking oils. In 2022, Indonesia's cooking oil trade surplus was US$30.7 billion with imports of US$248.5 million and exports of US$30.9 billion. Palm oil (HS code: 1511) was Indonesia's largest cooking oil export with values of US$27.8 billion (89.8% market share), followed by palm kernel oil (HS code: 1513) with values of US$3.1 billion (10.1% market share) in 2022.
In terms of cooking oil imports, Indonesia imported US$248.5 million, 118.4 million kilograms from global markets in 2022. The top three suppliers of cooking oils to Indonesia were the Philippines with a 40.0% market share equivalent to US$98.3 million, 53.5 million kilograms, followed by Malaysia with a 20.0% market share, equal to US$49.6 million, 23.3 million kilograms, and Thailand, representing a 12.0% market share with US$30.0 million, 16.6 million kilograms in 2022.
Top imported cooking oils to Indonesia in 2022 were coconut, palm kernel oil (HS code: 1513) valued at US$103.5 million, 56.4 million kilograms, followed by soybean oil and its fractions (HS code: 1507) valued at US$63.9 million, 34.5 million kilograms and fixed vegetable fats and oils (HS code: 1515) with values of US$30.5 million, 9.8 million kilograms.
| HS code | Description | Import value (US$M) | Import volume (million kilograms) | Top suppliers and market value share | Canada value share (%) | ||
|---|---|---|---|---|---|---|---|
| 1 | 2 | 3 | |||||
| Cooking oils total | 248.5 | 118.4 | Philippines: 40.0% | Malaysia: 20.0% | Thailand: 12.0% | 0.1 | |
| 1513 | Coconut, palm kernel oil | 103.5 | 56.4 | Philippines: 95.0% | India: 3.7 | Papua New Guinea: 0.8 | |
| 1507 | Soybean oil and its fractions | 63.9 | 34.5 | Malaysia: 46.3% | Thailand: 43.4% | Australia: 4.5% | |
| 1515 | Fixed vegetable fats and oils, including jojoba oil | 30.5 | 9.8 | Malaysia: 1.1% | Belgium: 12.7% | China: 11.5% | 0.2 |
| 1514 | Rape, colza or mustard oil and its fractions | 20.3 | 8.7 | Australia: 51.0% | Malaysia: 39.7% | Singapore: 4.9% | 1.3 |
| 1512 | Sunflower, safflower seed oil | 15.0 | 6.0 | Malaysia: 40.4% | France: 27.6% | Turkiye: 11.0% | |
| 1509 | Olive oil and its fractions | 13.2 | 2.5 | Italy: 44.4% | Spain: 44.3% | Egypt: 6.2% | |
| 1511 | Palm oil and its fractions | 1.4 | 0.4 | Malaysia: 44.7% | China: 42.1% | Singapore: 4.9% | |
| 1510 | Other oils and their fractions | 0.6 | 0.2 | Spain: 62.1% | Italy: 36.2% | Turkiye: 1.7% | |
| 1508 | Groundnut oil and its fractions | 0.1 | 0.0 | Germany: 81.3% | India: 5.9% | United States: 5.7% | |
| Source: Global Trade Tracker, 2023 | |||||||
Canada's performance
Indonesian imports from Canada
Indonesia was the fifty-fourth largest global market for cooking oils with imports valued at US248.5 million, 118.4 million kilograms in 2022. Of these imports, Canada was the twenty-third largest supplier to Indonesia (representing a 0.1% market share) with imports valued at US$311,143, and 92,820 kilograms in 2022. Indonesia's cooking oil imports from Canada included rape, colza or mustard oil and its fractions, (HS code: 1514) valued at US$266,591 and 91,220 kilograms, (85.7% market share), and fixed vegetable fats and oils (HS code: 1515) with values of US$44,552, and 1,600 kilograms (14.3% market share) in 2022. Of note, canola and soybean oils are often considered healthy, alternative cooking oils as they contain more monounsaturated and polyunsaturated (better-for-you), and less saturated fats (American Heart Association, April 2018). Cooking oil imports from Canada, particularly canola and soybean oils, can be viewed as a healthy alternative to the prevalence of palm oil in the Indonesian market, and represent an export opportunity for Canada, as a trusted and capable supplier, of edible oils to Indonesia and the surrounding ASEAN region. While it is recognized that the benefits of canola oil are not well known amidst most Indonesian consumers, canola oil has developed into a niche market for some consumers (expatriates, and environmentalists concerned with deforestation, often associated in palm oil production) that is anticipated to gradually increase within this market segment in the future. (Canadian Trade Commissioners Service: Indonesia, April 2023).
| HS Code | Description | Import value (US$) | Import volume (kg) | Market value share (%) |
|---|---|---|---|---|
| Cooking Oil Total | 311,143 | 92,820 | 100.0 | |
| 1514 | Rape, colza or mustard oil and its fractions | 266,591 | 91,220 | 85.7 |
| 1515 | Fixed vegetable fats and oils, including jojoba oil | 44,552 | 1,600 | 14.3 |
| Source: Global Trade Tracker, 2023 | ||||
Indonesian import requirements
The Government of Indonesia (GOI) requires all food and beverage products, in retail packaging and food additives, to obtain a distribution authorization form from the National Agency for Drug and Food Control (BPOM) before entering the market. BPOM will issue a registration approval number for products that meet the necessary requirements for distribution by issuing a ML (Makanan Luar) number for imported products and a MD (Makanan Dalam) number for domestically produced products (USDA, June 29, 2018).
The food safety control system in Indonesia for processed food and beverages involves a broad range of pre-market and post-market controls. Pre-market controls evaluate the food safety of products to ensure compliance with safety, quality, nutrition, and labeling requirements prior to retail while post-market controls, such as on site retail sampling, are conducted after products are distributed in the market and/or retail outlets. The National Agency for Drug and Food Control (BPOM) places greater emphasis on the pre-market control due to the wide area of coverage and the sheer geographical nature of Indonesia (USDA, June 29, 2018).
The most recent registration procedures are cited in BPOM Regulation No. 27/2017. The process can be conducted online through E-Registration (e-reg), via http://e-reg.pom.go.id. The registration process is determined and categorized based on risk level (high, medium, low/very low-risk) of the product and detailed requirements from the food manufacture/supplier and product samples are needed for the registration process. Once approved, product registration is valid for 5 years (USDA, June 29, 2018). Updated technical information for requirements and regulations on food and agriculture products required by the Government of Indonesia, USDA; Indonesia: Food and Agricultural Import Regulations and Standards Country Report - December 27, 2021).
Of note, a local agent or importer typically applies for, and supports the registration process (USDA, June 29, 2018). That being said, it is important for interested Canadian suppliers to work closely with Trade Commissioners to help find qualified importing partners, who understand and will assist to ensure, that Indonesian prevailing import requirements, and related duties for their specific products, are met. It is also important to note and appreciate the value of commitment, and market development and intelligence needed to access and evaluate the Indonesian market and market participants, who may yield a price and freight advantage due to their proximity to Indonesia.
Canada's export market
Canada, similar to Indonesia, is a net exporter of cooking oils. In 2022, Canada enjoyed a cooking oil trade surplus of US$4.0 billion with imports of US$1.1 billion, and exports valued at US$5.1 billion. Canola oil (HS code: 1514) was the largest cooking oil exported with values of US$4.8 billion (94.4% market share,) followed by soybean oil (HS code: 1507) with values of US$188.0 million (3.7% market share) in 2022.
The U.S was the largest market for Canadian cooking oils (81.3% market share) valued at US$4.1 billion, 2.2 billion kilograms, followed by Mexico (6.6% market share) with values of US$335.4 million, 187.3 million kilograms and China (5.7% market share) valued at US$288.6 million, 186.4 million kilograms in 2022. In comparison, Indonesia was the thirty-fifth largest market (0.0% market share) for Canadian cooking oils with values of US$159,790 and 87,174 kilograms in 2022.
| Country | Export value (US$ M) | Export volume (million kilograms) | Market value share (%) in 2022 |
|---|---|---|---|
| Global Total | 5,078.5 | 2,833.6 | 100.0 |
| United States | 4,128.1 | 2,240.4 | 81.3 |
| Mexico | 335.4 | 187.3 | 6.6 |
| China | 288.6 | 186.4 | 5.7 |
| Korea | 145.7 | 98.0 | 2.9 |
| Chile | 75.5 | 53.9 | 1.5 |
| Japan | 38.2 | 23.3 | 0.8 |
| Taiwan | 15.4 | 10.2 | 0.3 |
| Hong Kong | 13.4 | 8.5 | 0.3 |
| Colombia | 11.5 | 8.2 | 0.2 |
| United Arab Emirates | 8.0 | 5.6 | 0.2 |
| Indonesia (35) | 0.2 | 0.1 | 0.0 |
| Source: Global Trade Tracker, 2023 | |||
Indonesia was the thirty-fifth largest export market for Canadian cooking oils in 2022. The top (and only) supplying Canadian province to the Indonesian market was Saskatchewan occupying a 100.0% market share in 2022. The only cooking oil export from Canada to Indonesia was rape, colza or mustard oil and its fractions (HS code: 1514) with values of US$159,790 and 87,174 kilograms in 2022.
| HS code | Description | Export value (US$) | Export volume (kg) | Top provincial suppliers and market value share | ||
|---|---|---|---|---|---|---|
| Cooking Oils total | 159,790 | 87,174 | Saskatchewan: 100.0 | |||
| 1514 | Rape, colza or mustard oil and its fractions | 159,790 | 87,174 | Saskatchewan: 100.0 | ||
| Source: Global Trade Tracker, 2023 | ||||||
Retail markets
Global retail sales of cooking oil
Global retail sales of cooking oils have increased moderately in CAGR by 11.2% from US$71.2 billion in 2017 to US$121.0 billion in 2022 and are expected to increase at an additional CAGR of 8.8% as retail sales are expected to attain US$184.3 billion by 2027. India was the largest global market for cooking oil with retail sales of US$24.6 billion (20.4% market share), followed by China with values of US$17.8 billion (14.7% market share) and Brazil, with retail sales of US$6.6 billion (5.4% market share) in 2022.
Indonesia was the fifth largest global retail sales market for cooking oils (after the United States) with values of US$3.7 billion, representing a 3.0% market share in 2022. Indonesia experienced a significant increase in CAGR of 19.6% as retail sales grew from US$1.5 billion in 2017 and are expected to further improve with an increase in CAGR of 6.5% in the forecast period as retail sales are anticipated to achieve US$5.0 billion by 2027. In comparison, Canada was the thirty-eighth largest retail sales market for cooking oils, accounting for a 0.4% retail sale market share with values of US$513.9 million in 2022. Similarly, Canada is also expected to achieve positive growth, albeit at a lower rate, with an increase in CAGR of 5.7% in the forecast period as retail sales attain US$676.8 million by 2027.
| Geography | 2017 | 2022 | CAGR* % 2017-2022 | 2023 | 2027 | CAGR* % 2022-2027 |
|---|---|---|---|---|---|---|
| World | 71,191.4 | 120,969.0 | 11.2 | 132,095.6 | 184,258.5 | 8.8 |
| India | 12,333.7 | 24,645.1 | 14.8 | 27,634.3 | 40,408.7 | 10.4 |
| China | 14,826.7 | 17,754.9 | 3.7 | 18,100.7 | 20,810.3 | 3.2 |
| Brazil | 2,257.1 | 6,571.8 | 23.8 | 7,216.4 | 9,602.8 | 7.9 |
| United States | 3,630.5 | 5,366.7 | 8.1 | 6,027.3 | 7,091.7 | 5.7 |
| Indonesia (5) | 1,500.4 | 3,670.8 | 19.6 | 3,909.4 | 5,019.0 | 6.5 |
| Russia | 1,664.6 | 3,008.1 | 12.6 | 3,228.8 | 4,887.7 | 10.2 |
| Turkiye | 595.9 | 2,882.6 | 37.1 | 3,846.9 | 6,720.9 | 18.4 |
| Spain | 2,018.9 | 2,642.5 | 5.5 | 2,693.1 | 3,002.3 | 2.6 |
| Italy | 2,343.9 | 2,585.8 | 2.0 | 2,758.0 | 3,063.4 | 3.4 |
| Vietnam | 1,203.1 | 2,447.2 | 15.3 | 2,618.8 | 3,618.4 | 8.1 |
| Canada (38) | 373.0 | 513.9 | 6.6 | 554.9 | 676.8 | 5.7 |
|
Source: Euromonitor International, 2023 *CAGR: Compound Annual Growth Rate |
||||||
Association of Southeast Asian Nations retail sales of cooking oil
The Association of Southeast Asian Nations (ASEAN) retail sales of cooking oils have increased moderately in CAGR by 15.3% from US$5.2 billion in 2017 to US$10.6 billion in 2022 and are expected to increase at an additional CAGR of 5.1% as retail sales are to attain US$13.6 billion by 2027. Indonesia was the largest ASEAN market for cooking oils with retail sales of US$3.7 billion (34.6% market share), followed by Vietnam with values of US$2.4 billion (23.1% market share) and the Philippines, with retail sales of US$1.6 billion (15.2% market share) in 2022.
| Geography | 2017 | 2022 | CAGR* % 2017-2022 | 2023 | 2027 | CAGR* % 2022-2027 |
|---|---|---|---|---|---|---|
| ASEAN (total) | 5,204.0 | 10,610.9 | 15.3 | 10,998.1 | 13,620.4 | 5.1 |
| Indonesia | 1,500.4 | 3,670.8 | 19.6 | 3,909.4 | 5,019.0 | 6.5 |
| Vietnam | 1,203.1 | 2,447.2 | 15.3 | 2,618.8 | 3,618.4 | 8.1 |
| Philippines | 965.0 | 1,615.9 | 10.9 | 1,507.4 | 1,556.0 | −0.8 |
| Thailand | 599.0 | 1,300.8 | 16.8 | 1,348.3 | 1,625.1 | 4.6 |
| Malaysia | 404.8 | 675.5 | 10.8 | 687.7 | 763.0 | 2.5 |
| Myanmar | 348.0 | 595.6 | 11.3 | 645.5 | 697.7 | 3.2 |
| Cambodia | 103.9 | 200.8 | 14.1 | 172.4 | 218.4 | 1.7 |
| Singapore | 60.9 | 74.1 | 4.0 | 77.2 | 90.5 | 4.1 |
| Laos | 14.7 | 24.7 | 10.9 | 25.7 | 26.2 | 1.2 |
| Brunei Darussalam | 4.2 | 5.5 | 5.5 | 5.7 | 6.1 | 2.1 |
|
Source: Euromonitor International, 2023 *CAGR: Compound Annual Growth Rate |
||||||
Indonesian retail sales of cooking oil
The cooking oil retail market in Indonesia was valued at US$3.7 billion in 2022. During the 2017-2022 period, this market grew at a measurable CAGR of 19.6% from US$1.5 billion in 2017, with exceptionally higher growth between 2021 to 2022 (52.0%) as values increased from US$2.4 billion to US$3.7 billion. Palm oil in particular, experienced the largest annual growth rate (55.0%) as retail values increased from US$2.2 billion in 2021 to US$3.5 billion in 2022.
The top cooking oil categories in Indonesia, in terms of retail value sales in 2022, was predominantly palm oil (94.9% market share) increasing at a CAGR of 20.2% from US$1.4 billion in 2017, followed by olive oil valued at US$115.4 million (3.1% market share), representing an increase in CAGR of 13.0% from US$62.6 million in 2017 and other edible oil with values of US$41.2 million (1/1% market share) and increasing in CAGR by 7.5% from US$28.7 million in 2017.
The Indonesian consumer favours palm oil as their preferred edible oil and use it daily in their cooking. The demand for palm oil is also supported by its extensive availability (distribution), variety in brand selection and its affordable pricing (recently impacted by the supply shortages incurred by Russia's war in Ukraine). Relatedly, government implementation of effective short-term policies to reconcile oil demand with supply has been measured (Euromonitor International, 2022). Consumers and foodservice members also use unbranded palm oil sold by weight, as it is more affordable and available in convenient channels such as warung (small local grocers) or took kelontongan (convenience stores) outlets (Euromonitor International, 2022).
Alternatives to palm oil, such as olive oil and other edible oils (virgin coconut oil and avocado oil), are a healthy, available and more expensive option reserved primarily for more affluent consumers with higher disposable income levels (Euromonitor International, 2022). Euromonitor International notes that palm oil will remain the dominant category in cooking oils within the forecast period and will play a key role in expanding edible oils overall.
Over the forecast period, consumers will continue to look for healthier and often pricier, options, such as olive oil and grape seed oil, while price conscious consumers will purchase the more economical vegetable and seed oil, including palm oil, as an affordable option. Relatedly, consumers are also likely to look for value-for-money options such as a products package size or private label alternatives (Euromonitor International, 2022).
Growth in the cooking oil category is expected to remain relatively positive (6.5%), as retail sales reach US$5.0 billion by 2027, despite recent lower retail demand as more consumers spend less time at home, and as foodservice demand stabilizes. As within the historic period, most cooking oil categories will experience positive and slightly larger increases in CAGR , with the exception of palm oil, which is expected to attain a lower CAGR of 6.0%, in the forecast period. Olive oil in particular, is expected to increase at the larger CAGR of 15.5% achieving US$237.7 million by 2027, while corn oil is also expected to perform well attaining an increase in CAGR of 10.5% with values of US$22.7 million by 2027.
| Category | 2017 | 2018 | 2019 | 2020 | 2021 | 2022 |
|---|---|---|---|---|---|---|
| Cooking Oils (total) | 1,500.4 | 1,749.9 | 1,864.4 | 2,104.6 | 2,414.7 | 3,670.8 |
| Olive Oil | 62.6 | 68.2 | 77.1 | 87.9 | 100.6 | 115.4 |
| Corn Oil | 10.2 | 10.9 | 11.5 | 12.2 | 13.0 | 13.8 |
| Palm Oil | 1,386.7 | 1,627.3 | 1,729.6 | 1,955.3 | 2,248.6 | 3,485.4 |
| Rapeseed Oil | ||||||
| Soy Oil | 12.1 | 12.6 | 13.1 | 13.6 | 14.2 | 14.9 |
| Sunflower Oil | ||||||
| Other Edible Oil[1] | 28.7 | 30.8 | 33.0 | 35.5 | 38.2 | 41.2 |
|
Source: Euromonitor International, 2023 1: includes vegetable and seed oil such as coconut oil, grapeseed oil, groundnut oil, sesame oil and walnut oil, as well as blended oils which contain less than 50% of any single type of oils broken down into the researched oil categories. |
||||||
| Category | Annual growth (%) 2021-2022 | CAGR* % 2017-2022 | Total growth (%) 2017-2022 |
|---|---|---|---|
| Cooking Oils (total) | 52.0 | 19.6 | 144.7 |
| Olive Oil | 14.7 | 13.0 | 84.3 |
| Corn Oil | 6.2 | 6.2 | 35.3 |
| Palm Oil | 55.0 | 20.2 | 151.3 |
| Rapeseed Oil | |||
| Soy Oil | 4.9 | 4.3 | 23.1 |
| Sunflower Oil | |||
| Other Edible Oil | 7.9 | 7.5 | 43.6 |
|
Source: Euromonitor International, 2023 *CAGR: Compound Annual Growth Rate |
|||
| Category | 2023 | 2024 | 2025 | 2026 | 2027 |
|---|---|---|---|---|---|
| Cooking Oils (total) | 3,909.4 | 4,165.8 | 4,431.8 | 4,713.1 | 5,019.0 |
| Olive Oil | 132.8 | 153.1 | 176.8 | 204.7 | 237.7 |
| Corn Oil | 15.2 | 16.8 | 18.6 | 20.5 | 22.7 |
| Palm Oil | 3,700.8 | 3,930.3 | 4,165.3 | 4,410.9 | 4,675.2 |
| Rapeseed Oil | |||||
| Soy Oil | 16.2 | 17.6 | 19.1 | 20.8 | 22.6 |
| Sunflower Oil | |||||
| Other Edible Oil | 44.5 | 48.0 | 51.9 | 56.2 | 60.9 |
| Source: Euromonitor International, 2023 | |||||
| Category | Annual growth (%) 2022-2023 | CAGR* % 2022-2027 | Annual growth (%) 2022-2027 |
|---|---|---|---|
| Cooking Oils (total) | 6.5 | 6.5 | 36.7 |
| Olive Oil | 15.1 | 15.5 | 106.0 |
| Corn Oil | 10.1 | 10.5 | 64.5 |
| Palm Oil | 6.2 | 6.0 | 34.1 |
| Rapeseed Oil | |||
| Soy Oil | 8.7 | 8.7 | 51.7 |
| Sunflower Oil | |||
| Other Edible Oil | 8.0 | 8.1 | 47.8 |
|
Source: Euromonitor International, 2023 *CAGR: Compound Annual Growth Rate |
|||
Competitive landscape
The Indonesian cooking oil market remained a fragmented industry throughout 2017 to 2022. Indofood Sukses Makmur Tbk PT (Brand name; Bimoli and Happy) was the largest cooking oil company in Indonesia with retail sales of US$1.3 billion (36.0% market share), while Wilmar International Ltd (Brand name; Sania and Fortune), the second largest cooking oil company, attained US$671.6 million (18.3% market share) in 2022. Of interest, Duogo is the main Canadian oil brand in the market supplying the majority of canola oil available, and is imported by Pandurasa Kharisma (Canadian Trade Commissioners Service: Indonesia, April 2023).
Due to the uncertain economic environment created by the pandemic, many companies have implemented the use of digital marketing and social media to promote their products and brands. Bimoli, for example, has established a partnership with Chef Steby who shares cooking tips and recipe which has helped to boost consumer engagement and increase sales through social media platforms such as Instagram, YouTube, and Facebook.
| Company | Retail sales (US$ millions) | Market share (%) |
|---|---|---|
| Total | 3,670.8 | 100.0 |
| Indofood Sukses Makmur Tbk PT | 1,322.7 | 36.0 |
| Wilmar International Ltd | 671.6 | 18.3 |
| Bina Karya Prima PT | 658.6 | 17.9 |
| Golden Agri-Resources Ltd | 573.7 | 15.6 |
| Pabrik Minyak Goreng Barco PT | 95.0 | 2.6 |
| Deoleo SA | 59.1 | 1.6 |
| Mikie Oleo Nabati Industri PT | 50.6 | 1.4 |
| Bright Food (Group) Co Ltd | 47.0 | 1.3 |
| Others | 192.5 | 5.2 |
| Source: Euromonitor International, 2023 | ||
Retail distribution channels
The majority of Indonesia's cooking oil market is distributed through Grocery Retailers (Retail Offline) versus E-Commerce. Grocery retailers for cooking oils accounted for a 92.3% market share in 2022, declining from 99.5% held in 2017, while e-commerce retail increased its market share representation from 0.5% held in 2017 to 7.7% in 2022 by offering lower shipping costs.
Of interest, small local grocers and convenience stores were the predominant distribution channels for cooking oils representing market shares of 73.2% and 7.5% respectively, in 2022. Euromonitor International notes that small local grocers will remain the dominant distribution channel for edible oils, mainly supported by high volume sales of palm oil. Further, the retail pricing of palm oil is more affordable through this channel, which is particularly important given the price-sensitivity of many consumers. In addition, smaller consumer foodservice operators such as street vendors, often purchase their cooking ingredients through small local grocers instead of larger foodservice distributors which require a large minimum purchase order (Euromonitor International, 2022).
In terms of particular cooking oil categories and retail distribution channels, cooking oil products such as olive oil, virgin coconut oil and avocado oil have a much narrower distribution range than palm oil, especially in channels such as supermarkets, small local grocers, and convenience stores, limiting the potential influence of the health and wellness trend on sales (Euromonitor International, 2022).
| Outlet Type | 2017 | 2022 | ||
|---|---|---|---|---|
| Actual | Share % | Actual | Share % | |
| Retail Channels Total | 1,500.4 | 100.0 | 3,670.8 | 100.0 |
| Retail Offline | 1,493.4 | 99.5 | 3,388.1 | 92.3 |
| Grocery Retailers | 1,493.4 | 99.5 | 3,388.1 | 92.3 |
| Convenience Retail | 91.6 | 6.1 | 276.2 | 7.5 |
| Convenience Stores | 91.6 | 6.1 | 276.2 | 7.5 |
| Supermarkets | 109.6 | 7.3 | 252.0 | 6.9 |
| Hypermarkets | 74.9 | 5.0 | 174.5 | 4.8 |
| Small Local Grocers | 1,217.4 | 81.1 | 2,685.4 | 73.2 |
| Retail E-Commerce | 7.0 | 0.5 | 282.6 | 7.7 |
| Source: Euromonitor International, 2023 | ||||
Health and wellness cooking oils
The presence of the pandemic has served to increase the existing awareness of the importance of health and wellness and its impacts on the consumer's lifestyle and eating habits (Euromonitor International, 2022). Further, in 2020, the Indonesian Government introduced a guideline advising that all cooking oils need to be fortified with added vitamins in order to improve the overall health of the Indonesian population.
The health and wellness cooking oil retail market in Indonesia was valued at US$2.6 billion in 2022. During the 2018-2022 period, this market grew at a moderate CAGR of 10.5% from US$1.7 billion in 2018, exhibiting annual growth of 11.6% from US$2.3 billion in 2021.
Fortified/Functional (FF) Edible oils (FF Vegetable and Seed Oil) was the largest health and wellness cooking oil category in Indonesia with retail values of US$2.5 billion (95.7% market share) in 2022, while the naturally healthy (NH) edible oil (NH Olive Oil) category experienced the largest increase in CAGR (12.5%) increasing from US$69.3 million in 2018 to US$110.9 million in 2022. Growth in Indonesia's health and wellness cooking oil category is expected to increase at a larger CAGR of 12.2%, as retail sales reach US$4.1 billion by 2026, as consumers continue to look for edible oils that are perceived to be healthier and attributed to positive health claims (Euromonitor International, 2022).
| Category | 2018 | 2019 | 2020 | 2021 | 2022 |
|---|---|---|---|---|---|
| Health and Wellness Edible Oil by Type (total) | 1,734.8 | 1,846.1 | 2,084.4 | 2,321.0 | 2,590.4 |
| Fortified/Functional[1] (FF) Edible Oil | 1,665.5 | 1,767.8 | 1,995.0 | 2,221.8 | 2,479.5 |
| Naturally Healthy[2] (NH) Edible Oils | 69.3 | 78.4 | 89.3 | 99.2 | 110.9 |
| Organic[3] Edible Oil | |||||
|
Source: Euromonitor International, 2023 1: Fortified/Functional (as defined by Euromonitor International) - products to which health ingredients and/or nutrients have been added. 2: Naturally Healthy (as defined by Euromonitor International) - products naturally containing a substance that improves health and wellbeing beyond the product's pure caloric value. 3: Organic (as defined by Euromonitor International) - those products which have been produced, stored, processed, handled and marketed in accordance with precise technical specifications (standards) and certified as organic by a certification body. |
|||||
| Category | Annual growth (%) 2021-2022 | CAGR* % 2018-2022 | Total growth (%) 2018-2022 |
|---|---|---|---|
| Health and Wellness Edible Oil by Type (total) | 11.6 | 10.5 | 49.3 |
| Fortified/Functional (FF) Edible Oil | 11.6 | 10.5 | 48.9 |
| Naturally Healthy (NH) Edible Oils | 11.8 | 12.5 | 60.0 |
| Organic Edible Oil | |||
|
Source: Euromonitor International, 2023 *CAGR: Compound Annual Growth Rate |
|||
| Category | 2023 | 2024 | 2025 | 2026[a] |
|---|---|---|---|---|
| Health and Wellness Edible Oil by Type (total) | 2,892.2 | 3,241.9 | 3,644.7 | 4,098.1 |
| Fortified/Functional (FF) Edible Oil | 2,767.6 | 3,101.7 | 3,486.7 | 3,919.8 |
| Naturally Healthy (NH) Edible Oils | 124.6 | 140.2 | 158.1 | 178.3 |
| Organic Edible Oil | ||||
|
Source: Euromonitor International, 2023 a: Latest data availability |
||||
| Category | Annual growth (%) 2022-2023 | CAGR* % 2022-2026 | Total growth (%) 2022-2026 |
|---|---|---|---|
| Health and Wellness Edible Oil by Type (total) | 11.7 | 12.2 | 58.2 |
| Fortified/Functional (FF) Edible Oil | 11.6 | 12.1 | 58.1 |
| Naturally Healthy (NH) Edible Oils | 12.4 | 12.6 | 60.8 |
| Organic Edible Oil | |||
|
Source: Euromonitor International, 2023 *CAGR: Compound Annual Growth Rate |
|||
New product launch analysis
The global pandemic has intensified the importance of maintaining a nutritious diet. The vast majority of adults in the Asia-Pacific region are aspiring to eat more healthy and are taking a more holistic approach to their wellbeing. Functional foods are expected to perform well as a means of supporting mental and physical health in a preventive and convenient manner. From November 2021 to October 2022, launches of cooking oils with functional claims such as cardiovascular and antioxidant health claims have been increasing in the Asia-Pacific region (Mintel, January 2023).
According to Mintel's Global New Products Database (GNPD), there were 453 new cooking oil food products launched in Indonesia between January 2017 and December 2022. The number of yearly product launches has decreased slightly in growth by a CAGR of 3.8% from the largest launch of 85 cooking oil products in 2017 to its most recent launch of 70 cooking oil products in 2022. Of note, new product launches of cooking oils experienced the largest increase in growth rate (13.0%) from 2018 to 2019 as product launches increased from 67 to 76 products, and has since contracted in growth by 11.0% from 79 products released in 2021 to 70 products released in 2022.
Olitalia, Bertolli and Pietro Coricelli, were top brands of newly released cooking oil product launches while halal (223 products), kosher (55 products) and social media (49 products) were top claims associated with new products released during the prescribed period. The majority of top price groupings for cooking oils in $USD were 0.23¢ - $4.24 and $4.25 - $8.24 representing 74.2% of price groupings available, followed by $8.25 - $12.24.
Bottle (330 products) and flexible stand-up pouch (80 products) were the predominant package types released, while new packaging (210 products), new product (153 products) and new variety/range extension (68 products) were top launch types released between January 2016 and December 2021.
Unflavoured/plain, chili/chili pepper and garlic were top flavours (including blends), while palm oil, antioxidants and vitamin A were top ingredients identified during this period.
| Product attributes | Yearly launch counts | Total | |||||
|---|---|---|---|---|---|---|---|
| 2017 | 2018 | 2019 | 2020 | 2021 | 2022 | ||
| Yearly product launches | 85 | 67 | 76 | 76 | 79 | 70 | 453 |
| Top brands | |||||||
| Olitalia | 3 | 3 | 3 | 3 | 1 | 0 | 13 |
| Bertolli | 2 | 2 | 4 | 2 | 1 | 1 | 12 |
| Pietro Coricelli | 4 | 2 | 4 | 0 | 1 | 0 | 11 |
| Javara | 0 | 1 | 3 | 1 | 3 | 0 | 8 |
| Mazola | 5 | 0 | 0 | 1 | 1 | 1 | 8 |
| Top claims | |||||||
| Halal | 45 | 29 | 41 | 40 | 35 | 33 | 223 |
| Kosher | 11 | 10 | 8 | 13 | 10 | 3 | 55 |
| Social media | 5 | 6 | 9 | 12 | 12 | 5 | 49 |
| Vitamin/mineral fortified | 11 | 6 | 9 | 14 | 5 | 1 | 46 |
| Organic | 1 | 4 | 9 | 9 | 13 | 4 | 40 |
| Top price groupings (US dollars) | |||||||
| 0.23 - 4.24 | 39 | 23 | 25 | 34 | 25 | 30 | 176 |
| 4.25 - 8.24 | 31 | 31 | 22 | 26 | 29 | 21 | 160 |
| 8.25 - 12.24 | 11 | 7 | 14 | 6 | 10 | 9 | 57 |
| 12.25 - 16.24 | 1 | 5 | 10 | 8 | 4 | 4 | 32 |
| 16.25 - 24.00 | 3 | 1 | 5 | 1 | 6 | 4 | 20 |
| Imported status | |||||||
| Not imported | 2 | 2 | 8 | 5 | 4 | 3 | 24 |
| Imported | 18 | 19 | 14 | 7 | 13 | 10 | 81 |
| Location of manufacturer | |||||||
| Italy | 4 | 5 | 5 | 5 | 4 | 1 | 24 |
| Indonesia | 2 | 2 | 8 | 5 | 4 | 3 | 24 |
| Spain | 8 | 4 | 1 | 0 | 2 | 2 | 17 |
| Malaysia | 1 | 4 | 3 | 0 | 3 | 3 | 14 |
| Singapore | 2 | 1 | 1 | 1 | 0 | 0 | 5 |
| Top packaged types | |||||||
| Bottle | 58 | 51 | 63 | 49 | 61 | 48 | 330 |
| Flexible stand-up pouch | 16 | 12 | 11 | 15 | 9 | 17 | 80 |
| Jar | 0 | 0 | 2 | 4 | 8 | 2 | 16 |
| Aerosol | 1 | 3 | 0 | 7 | 0 | 2 | 13 |
| Flexible | 8 | 0 | 0 | 0 | 0 | 0 | 8 |
| Top launch types | |||||||
| New packaging | 45 | 29 | 41 | 31 | 34 | 30 | 210 |
| New product | 22 | 21 | 23 | 33 | 28 | 26 | 153 |
| New variety/range extension | 13 | 12 | 7 | 10 | 12 | 14 | 68 |
| Relaunch | 5 | 5 | 5 | 2 | 5 | 0 | 22 |
| Top flavours (including blend) | |||||||
| Unflavoured/plain | 75 | 59 | 73 | 67 | 66 | 64 | 404 |
| Chili/chili pepper | 1 | 2 | 0 | 2 | 4 | 0 | 9 |
| Garlic | 2 | 0 | 0 | 1 | 3 | 2 | 8 |
| Lemon | 1 | 3 | 0 | 0 | 1 | 0 | 5 |
| Basil | 0 | 2 | 0 | 0 | 1 | 0 | 3 |
| Top ingredients | |||||||
| Palm oil | 24 | 16 | 11 | 22 | 18 | 22 | 113 |
| Antioxidants | 14 | 11 | 8 | 21 | 13 | 18 | 85 |
| Vitamin A | 13 | 8 | 8 | 18 | 11 | 15 | 73 |
| Extra virgin olive oil | 16 | 11 | 11 | 13 | 10 | 10 | 71 |
| Olive oil | 13 | 8 | 8 | 5 | 10 | 8 | 52 |
| Source: Mintel GNPD, 2023 | |||||||
Examples of new products
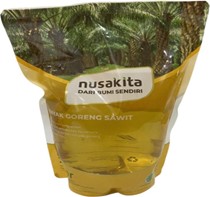
Palm Cooking Oil
Source: Mintel Global New Products Database, 2023
| Company | Industri Nabati Lestari |
|---|---|
| Brand | Nusakita |
| Category | Sauces and seasonings |
| Sub-category | Oils |
| Market | Indonesia |
| Location of manufacture | Indonesia |
| Import status | Not imported |
| Store type | Supermarket |
| Date published | November 2022 |
| Launch type | New product |
| Price in US dollars | 2.18 |
Nusakita Minyak Goreng Sawit (Palm Cooking Oil) is now available, and retails in a 2 litre pack. - From the earth - The natural goodness that is processed directly on the archipelago's plantations to produce quality cooking oil - From selected palm - Recyclable pack - Logos and certifications: Halal, SNI, QR code, Bangga Buatan Indonesia (Proudly Indonesian Made)
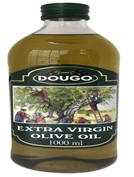
Extra Virgin Olive Oil
Source: Mintel Global New Products Database, 2023
| Company | Pandurasa Kharisma |
|---|---|
| Brand | Dougo |
| Category | Sauces and seasonings |
| Sub-category | Oils |
| Market | Indonesia |
| Store type | Internet / mail order |
| Date published | June 2019 |
| Launch type | New packaging |
| Price in US dollars | 11.07 |
Dougo Minyak Zaitun (Extra Virgin Olive Oil) has been repackaged. The product retails in a newly designed 1000 millilitre pack.
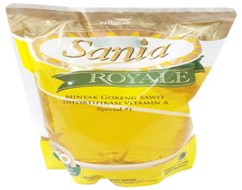
Blended Cooking Oil
Source: Mintel Global New Products Database, 2023
| Company | Multimas Nabati Asahan |
|---|---|
| Brand | Wilmar Sania Royale |
| Category | Sauces and seasonings |
| Sub-category | Oils |
| Market | Indonesia |
| Store type | Mass merchandise / hypermarket |
| Date published | March 2020 |
| Launch type | Relaunch |
| Price in US dollars | 2.99 |
Wilmar Sania Royale Minyak Goreng Sawit (Blended Cooking Oil) has been relaunched with a new brand name, previously known as Sania Royale, and under a redesigned 2 litre pack bearing the Facebook, Instagram and Twitter links. The halal certified oil is said to be a 3-in-1 blended cooking oil with VCO Innovative products and fortified vitamin A special.
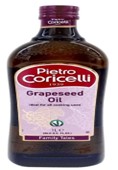
Grapeseed Oil
Source: Mintel Global New Products Database, 2023
| Company | Pietro Coricelli |
|---|---|
| Brand | Pietro Coricelli |
| Category | Sauces and seasonings |
| Sub-category | Oils |
| Market | Indonesia |
| Store type | Supermarket |
| Date published | July 2019 |
| Launch type | New packaging |
| Price in US dollars | 8.63 |
Pietro Coricelli Minyak Biji Anggur (Grapeseed Oil) has been repackaged. The halal, kosher and ISO 9001 certified product is said to be ideal for all cooking uses, is suitable for vegans, and retails in a newly designed 1 litre pack.
Corn Oil

Source: Mintel Global New Products Database, 2023
| Company | NutriFood |
|---|---|
| Brand | NutriFood |
| Category | Sauces and seasonings |
| Sub-category | Oils |
| Market | Indonesia |
| Store type | Supermarket |
| Date published | June 2019 |
| Launch type | New packaging |
| Price in US dollars | 5.41 |
Tropicana Slim Minyak Jagung (Corn Oil) has been repackaged in a newly designed 946 millilitre pack, bearing the Facebook, Instagram and Twitter logos. This halal certified product is said to be made with original selected corn oil, is high in vitamin E, and is suitable for salad dressing, sautéing, frying and baking.
For more information
The Canadian Trade Commissioner Service:
International Trade Commissioners can provide Canadian industry with on-the-ground expertise regarding market potential, current conditions and local business contacts, and are an excellent point of contact for export advice.
More agri-food market intelligence:
International agri-food market intelligence
Discover global agriculture and food opportunities, the complete library of Global Analysis reports, market trends and forecasts, and information on Canada's free trade agreements.
Agri-food market intelligence service
Canadian agri-food and seafood businesses can take advantage of a customized service of reports and analysis, and join our email subscription service to have the latest reports delivered directly to their inbox.
More on Canada's agriculture and agri-food sectors:
Canada's agriculture sectors
Information on the agriculture industry by sector. Data on international markets. Initiatives to support awareness of the industry in Canada. How the department engages with the industry.
For additional information on Food and Hotel Asia (FHA), please contact:
Ben Berry, Deputy Director
Trade Show Strategy and Delivery
Agriculture and agri-food Canada
ben.berry@agr.gc.ca
Resources
- American Heart Association, Health Cooking Oils, April 24, 2018
- Euromonitor International, 2023
- Consumer Lifestyles in Indonesia, November 2022
- Country Report. Economy, Finance and Trade: Indonesia, March 10, 2022
- Country Report. Edible Oils in Indonesia, November 2022
- Country Report. Health and Wellness in Indonesia, February 2022
- Country Report. Households: Indonesia, July 12, 2022
- Country Report. Income and Expenditure: Indonesia, August 25, 2022
- Global Economic Forecasts: Q4 2022, page 32, November 2022
- Global Trade Tracker, 2023
- Mintel Global New Products Database, 2023
- Mintel, A year of innovation in table sauces, oils and seasonings. Walji, Amrin, January 3, 2023
- Reuters, Indonesia palm oil export curbs, biodiesel plans to hit world vegoil supplies. Thukral, Naveen and Christina, Bernadette. January 15, 2023
- The Canadian Trade Commissioner Service: Indonesia, April 2023
- United States Department of Agriculture (USDA); Indonesia: Food and Agricultural Import Regulations and Standards Country Report – December 27, 2021
- United States Department of Agriculture (USDA); Oilseeds and Products Annual, Rahmanulloh, Arif. March 16, 2021
- United States Department of Agriculture (USDA); Retail Product Registration Guide for imported Food and Beverages. Rangkuti, Fahwani Y and McDonald, Garrettt, page 2, June 29, 2018
Sector Trend Analysis – Cooking oil trends in Indonesia
Global Analysis Report
Prepared by: Laurie Bernardi, International Market Research Analyst
© His Majesty the King in Right of Canada, represented by the Minister of Agriculture and Agri-Food (2023).
Photo credits
All photographs reproduced in this publication are used by permission of the rights holders.
All images, unless otherwise noted, are copyright His Majesty the King in Right of Canada.
To join our distribution list or to suggest additional report topics or markets, please contact:
Agriculture and Agri-Food Canada, Global Analysis1341 Baseline Rd, Tower 5, 3rd floor
Ottawa ON K1A 0C5
Canada
Email: aafc.mas-sam.aac@agr.gc.ca
The Government of Canada has prepared this report based on primary and secondary sources of information. Although every effort has been made to ensure that the information is accurate, Agriculture and Agri-Food Canada (AAFC) assumes no liability for any actions taken based on the information contained herein.
Reproduction or redistribution of this document, in whole or in part, must include acknowledgement of agriculture and agri-food Canada as the owner of the copyright in the document, through a reference citing AAFC, the title of the document and the year. Where the reproduction or redistribution includes data from this document, it must also include an acknowledgement of the specific data source(s), as noted in this document.
Agriculture and Agri-Food Canada provides this document and other report services to agriculture and food industry clients free of charge.