

Note: This report includes forecasting data that is based on baseline historical data.
Executive summary
The Health and Wellness (H&W) food and beverage sector in South Korea reached a retail sales value of US$9.1 billion in 2022, at a compound annual growth rate (CAGR) of 4.3% between 2018 and 2022 and are expected to continue to grow at a CAGR of 4.3% (2022 to 2026).
H&W beverage products reaching sales of US$3.3 billion, thriving the most from within the Naturally Healthy (NH), Fortified/Functional (FF) and Better For You (BFY) related drink categories.
In 2022, with FF packaged food products representing the highest sales value at US$2.4 billion, followed by NH Packaged Food (US$1.7 billion) and Free From Products (US$1.2 billion).
FF dairy was the largest category (US$1,732.7 million) within FF packaged foods in 2022, representing almost 73% of the total market share. It is worth noting that FF yoghurt represented 91% of the entire FF dairy, reaching US$1,569.0 million.
FF beverages experienced a growth of a CAGR of 1.9% from 2018 to 2022, reaching US$593.8 million in 2022. Soft drinks at US$498.4 million in 2022 represents 84% of the FF beverages market.
FF foods and beverages were distributed mainly through store-based retailing at US$6,921.9 million representing 80.0% of all the distribution channels in 2021. It grew at a CAGR of 4.2% from 2016 to 2021. Non-store retailing at US$1,611.8 million representing 20.0% of all distribution channel in 2021.
Market overview
Health and wellness (HW) is the combination of organic food and beverages, fortified/functional (FF) food and beverages, naturally healthy (NH) food and beverages, better for you (BFY) food and beverages and food intolerance products.
Despite the three year COVID-19 period, the trends driving the increased consumer demand for health and wellness products never fall, due to an aging population, increased incomes and the importance of generation Z who search for convenience and sustainability. For example, healthy foods for consumers with diabetes and foods that are easy to swallow (McKinsey & Company).
Overall, the HW food and beverage sector in South Korea reached a retail sales value of US$9.1 billion in 2022, at a compound annual growth rate (CAGR) of 4.3% between 2018 and 2022 and are expected to continue to grow at a CAGR of 4.3% (2022 to 2026). Though the pandemic prevented South Korean from going out of home, it did not make the retail sales of HW foods and beverages decrease.
Annual growth 2021 to 2022 of health and wellness was 5.3% and total growth 2018 to 2022 of health and wellness 2018 to 2022 was 18.2%.
| Category | 2018 | 2019 | 2020 | 2021 | 2022 | CAGR* % 2018-2022 | Annual growth % 2021-2022 | Total growth % 2018-2022 |
|---|---|---|---|---|---|---|---|---|
| Health and wellness (HW) | 7,707.6 | 7,890.1 | 8,214.9 | 8,651.0 | 9,108.8 | 4.3 | 5.3 | 18.2 |
| Naturally Healthy (NH) | 3,286.4 | 3,345.8 | 3,644.5 | 3,921.2 | 4,197.9 | 6.3 | 7.1 | 27.7 |
| Fortified/Functional (FF) | 2,906.8 | 2,956.9 | 2,842.9 | 2,869.3 | 2,955.2 | 0.4 | 3.0 | 1.7 |
| Free From | 948.9 | 980.7 | 1,057.8 | 1,116.3 | 1,170.9 | 5.4 | 4.9 | 23.4 |
| Better For You (BFY) | 295.0 | 313.6 | 348.9 | 403.8 | 424.9 | 9.6 | 5.2 | 44.0 |
| Organic | 270.4 | 293.0 | 320.7 | 340.3 | 359.7 | 7.4 | 5.7 | 33.0 |
|
Source: Euromonitor International, 2023 *CAGR: compound annual growth rate |
||||||||
Annual growth 2022 to 2023 of health and wellness is 4.1% and total growth 2022 to 2026 of health and wellness is also 18.2%.
| Category | 2023 | 2024 | 2025 | 2026 | CAGR* % 2022-2026 | Annual growth % 2022-2023 | Total growth % 2022-2026 |
|---|---|---|---|---|---|---|---|
| Health and wellness (HW) | 9,482.3 | 9,890.6 | 10,311.5 | 10,767.4 | 4.3 | 4.1 | 18.2 |
| Naturally Healthy (NH) | 4,430.3 | 4,682.0 | 4,946.5 | 5,235.2 | 5.7 | 5.5 | 24.7 |
| Fortified/Functional (FF) | 3,043.9 | 3,134.0 | 3,225.1 | 3,327.6 | 3.0 | 3.0 | 12.6 |
| Free From | 1,188.1 | 1,219.1 | 1,248.4 | 1,275.8 | 2.2 | 1.5 | 9.0 |
| Better For You (BFY) | 444.9 | 466.7 | 488.6 | 511.9 | 4.8 | 4.7 | 20.5 |
| Organic | 375.1 | 388.8 | 402.8 | 417.0 | 3.8 | 4.3 | 15.9 |
|
Source: Euromonitor International, 2023 *CAGR: compound annual growth rate |
|||||||
In 2022, with FF packaged food products representing the highest sales value at US$2.4 billion, followed by NH Packaged Food (US$1.7 billion) and Free From Products (US$1.2 billion). The HW packaged food grew at a CAGR of 3.1% between 2018 and 2022 and is expected to grow at a CAGR of 2.6% between 2021 and 2026.
Annual growth 2021 to 2022 of HW packaged food was 4.0% and total growth of HW packaged food was 12.8%.
| Category | 2018 | 2019 | 2020 | 2021 | 2022 | CAGR* % 2018-2022 | Annual growth % 2021-2022 | Total growth % 2018-2022 |
|---|---|---|---|---|---|---|---|---|
| HW Packaged Food | 5,127.5 | 5,185.3 | 5,356.6 | 5,562.5 | 5,785.3 | 3.1 | 4.0 | 12.8 |
| FF Packaged Food | 2,356.9 | 2,386.5 | 2,290.9 | 2,303.6 | 2,361.5 | 0.0 | 2.5 | 0.2 |
| NH Packaged Food | 1,388.0 | 1,370.7 | 1,525.4 | 1,633.8 | 1,718.7 | 5.5 | 5.2 | 23.8 |
| Free From Products | 948.9 | 980.7 | 1,057.8 | 1,116.3 | 1,170.9 | 5.4 | 4.9 | 23.4 |
| Organic Packaged Food | 261.9 | 280.6 | 307.7 | 326.8 | 345.6 | 7.2 | 5.8 | 32.0 |
| BFY Packaged Food | 171.7 | 166.7 | 174.8 | 182.0 | 188.6 | 2.4 | 3.6 | 9.8 |
|
Source: Euromonitor International, 2023 *CAGR: compound annual growth rate |
||||||||
Annual growth 2022 to 2023 of HW packaged food is 2.4% and total growth of HW packaged food 2022 to 2026 is 10.6%.
| Category | 2023 | 2024 | 2025 | 2026 | CAGR* % 2022-2026 | Annual growth % 2022-2023 | Total growth % 2022-2026 |
|---|---|---|---|---|---|---|---|
| HW Packaged Food | 5,924.9 | 6,082.3 | 6,239.6 | 6,398.4 | 2.6 | 2.4 | 10.6 |
| FF Packaged Food | 2,417.8 | 2,474.1 | 2,526.6 | 2,576.8 | 2.2 | 2.4 | 9.1 |
| NH Packaged Food | 1,764.2 | 1,815.4 | 1,871.8 | 1,933.2 | 3.0 | 2.6 | 12.5 |
| Free From Products | 1,188.1 | 1,219.1 | 1,248.4 | 1,275.8 | 2.2 | 1.5 | 9.0 |
| Organic Packaged Food | 360.6 | 373.3 | 386.0 | 399.0 | 3.7 | 4.3 | 15.5 |
| BFY Packaged Food | 194.2 | 200.4 | 206.8 | 213.6 | 3.2 | 3.0 | 13.3 |
|
Source: Euromonitor International, 2023 *CAGR: compound annual growth rate |
|||||||
HW beverage products reaching sales of US$3.3 billion, thriving the most from within the NH, FF and BFY related drink categories. The CAGR growth is 6.5% between 2018 and 2022, and will expect to be reach 7.1% between 2022 and 2026, reaching US$4.4 billion in 2026.
Annual growth of HW beverages 2021 to 2022 was 7.6% and total growth of HW beverages 2018 to 2022 was 28.8%.
| Category | 2018 | 2019 | 2020 | 2021 | 2022 | CAGR* % 2018-2022 | Annual growth % 2021-2022 | Total growth % 2018-2022 |
|---|---|---|---|---|---|---|---|---|
| HW Beverages | 2,580.1 | 2,704.8 | 2,858.2 | 3,088.5 | 3,323.4 | 6.5 | 7.6 | 28.8 |
| NH Beverages | 1,898.4 | 1,975.1 | 2,119.1 | 2,287.4 | 2,479.3 | 6.9 | 8.4 | 30.6 |
| FF Beverages | 549.9 | 570.4 | 552.1 | 565.7 | 593.8 | 1.9 | 5.0 | 8.0 |
| BFY Beverages | 123.3 | 146.9 | 174.1 | 221.8 | 236.3 | 17.7 | 6.5 | 91.6 |
| Organic Beverages | 8.5 | 12.4 | 13.0 | 13.5 | 14.1 | 13.5 | 4.4 | 65.9 |
|
Source: Euromonitor International, 2023 *CAGR: compound annual growth rate |
||||||||
Annual growth of HW beverages 2022 to 2023 is 7.0% and total growth of HW beverages 2022 to 2026 is 31.5%.
| Category | 2023 | 2024 | 2025 | 2026 | CAGR* % 2022-2026 | Annual growth % 2022-2023 | Total growth % 2022-2026 |
|---|---|---|---|---|---|---|---|
| HW Beverages | 3,557.4 | 3,808.3 | 4,071.9 | 4,369.0 | 7.1 | 7.0 | 31.5 |
| NH Beverages | 2,666.1 | 2,866.5 | 3,074.8 | 3,302.0 | 7.4 | 7.5 | 33.2 |
| FF Beverages | 626.1 | 659.9 | 698.6 | 750.8 | 6.0 | 5.4 | 26.4 |
| BFY Beverages | 250.7 | 266.3 | 281.8 | 298.3 | 6.0 | 6.1 | 26.2 |
| Organic Beverages | 14.5 | 15.5 | 16.8 | 18.0 | 6.3 | 2.8 | 27.7 |
|
Source: Euromonitor International, 2023 *CAGR: compound annual growth rate |
|||||||
Retail sales
FF packaged food products reached US$2,361.5 million in 2022, a little lower than US$2,386.5 million in 2019. FF dairy was the largest category (US$1,732.7 million) within FF packaged foods in 2022, representing almost 73% of the total market share. It is worth noting that FF yoghurt represented 91% of the entire FF dairy retail sale, reaching US$1,569.0 million.
The FF snack bars subcategory had the fastest growth at a CAGR of 49.6% (2018 to 2022). It is expected to grow at CAGR of 14.8% between 2022 and 2026. Annual growth 2021 to 2022 of FF packaged food was 2.5% and total gowth 2018 to 2022 of FF pacakaged food was 0.2%.
| Category | 2018 | 2019 | 2020 | 2021 | 2022 | CAGR* % 2018-2022 | Annual growth % 2021-2022 | Total growth % 2018-2022 |
|---|---|---|---|---|---|---|---|---|
| Fortified/Functional Packaged Food | 2,356.9 | 2,386.5 | 2,290.9 | 2,303.6 | 2,361.5 | 0.0 | 2.5 | 0.2 |
| FF Baby Food | 307.5 | 273.1 | 227.5 | 210.2 | 200.9 | −10.1 | −4.4 | −34.7 |
| FF Breakfast Cereals | 155.2 | 149.2 | 155.9 | 160.2 | 164.6 | 1.5 | 2.7 | 6.1 |
| FF Confectionery | 241.3 | 238.3 | 192.6 | 187.3 | 188.2 | −6.0 | 0.5 | −22.0 |
| FF Dairy | 1,611.9 | 1,671.6 | 1,652.0 | 1,677.4 | 1,732.7 | 1.8 | 3.3 | 7.5 |
| FF Cheese | 20.2 | 18.7 | 21.3 | 22.3 | 23.1 | 3.4 | 3.6 | 14.4 |
| FF Milk | 185.7 | 165.3 | 152.1 | 142.5 | 140.6 | −6.7 | −1.3 | −24.3 |
| FF Yoghurt | 1,406.0 | 1,487.6 | 1,478.6 | 1,512.6 | 1,569.0 | 2.8 | 3.7 | 11.6 |
| FF Sweet Biscuits, Snack Bars and Fruit Snacks | 41.1 | 54.3 | 63.0 | 68.5 | 75.0 | 16.2 | 9.5 | 82.5 |
| FF Sweet Biscuits | 32.2 | 30.8 | 30.7 | 30.4 | 30.4 | −1.4 | 0.0 | −5.6 |
| FF Snack Bars | 8.9 | 23.6 | 32.3 | 38.1 | 44.6 | 49.6 | 17.1 | 401.1 |
| FF Vegetable and Seed Oil | 0 | 0 | 0 | 0 | 0 | 0 | 0 | 0 |
|
Source: Euromonitor International, 2023 *CAGR: compound annual growth rate |
||||||||
Annual growth 2022 to 2023 of FF packaged food was 2.4% and total gowth 2022 to 2026 of FF pacakaged food was 9.1%. FF snack bars is expected to have the largest total growth of 56.5%, followed by the total growth of FF confectionery: 25.5%.
| Category | 2023 | 2024 | 2025 | 2026 | CAGR* % 2022-2026 | Annual growth % 2022-2023 | Total growth % 2022-2026 |
|---|---|---|---|---|---|---|---|
| Fortified/Functional Packaged Food | 2,417.8 | 2,474.1 | 2,526.6 | 2,576.8 | 2.2 | 2.4 | 9.1 |
| FF Baby Food | 196.2 | 194.2 | 192.5 | 191.3 | −1.2 | −2.3 | −4.8 |
| FF Breakfast Cereals | 160.3 | 160.4 | 159.7 | 158.4 | −1.0 | −2.6 | −3.8 |
| FF Confectionery | 202.1 | 213.5 | 224.8 | 236.1 | 5.8 | 7.4 | 25.5 |
| FF Dairy | 1,777.6 | 1,818.3 | 1,855.5 | 1,890.5 | 2.2 | 2.6 | 9.1 |
| FF Cheese | 22.3 | 22.0 | 21.6 | 21.2 | −2.1 | −3.5 | −8.2 |
| FF Milk | 140.1 | 140.4 | 141.4 | 142.8 | 0.4 | −0.4 | 1.6 |
| FF Yoghurt | 1,615.2 | 1,656.0 | 1,692.6 | 1,726.5 | 2.4 | 2.9 | 10.0 |
| FF Sweet Biscuits, Snack Bars and Fruit Snacks | 81.6 | 87.7 | 94.1 | 100.5 | 7.6 | 8.8 | 34.0 |
| FF Sweet biscuits | 30.3 | 30.4 | 30.5 | 30.7 | 0.2 | −0.3 | 1.0 |
| FF Snack Bars | 51.2 | 57.3 | 63.6 | 69.8 | 11.8 | 14.8 | 56.5 |
| FF Vegetable and Seed Oil | 0 | 0 | 0 | 0 | 0 | 0 | 0 |
|
Source: Euromonitor International, 2023 *CAGR: compound annual growth rate |
|||||||
FF beverages experienced a growth of a CAGR of 1.9% from 2018 to 2022, reaching US$593.8 million in 2022. Soft drinks at US$498.4 million in 2022 represents 84% of the FF beverages market. FF Energy Drinks was the fastest-growing subcategory during the period at a CAGR of 7.7%, reaching US$90.9 million in 2022.
Annual growth 2021 to 2022 of FF beverages was 5.0% and total gowth 2018 to 2022 of FF beverages was 8.0%.
| Category | 2018 | 2019 | 2020 | 2021 | 2022 | CAGR* % 2018-2022 | Annual growth % 2021-2022 | Total growth % 2018-2022 |
|---|---|---|---|---|---|---|---|---|
| Fortified/Functional Beverages | 549.9 | 570.4 | 552.1 | 565.7 | 593.8 | 1.9 | 5.0 | 8.0 |
| FF Hot Drinks | 81.8 | 86.9 | 93.2 | 91.8 | 95.4 | 3.9 | 3.9 | 16.6 |
| FF Tea | 47.8 | 50.6 | 53.6 | 52.9 | 55.6 | 3.9 | 5.1 | 16.3 |
| FF Fruit/Herbal Tea | 47.8 | 50.6 | 53.6 | 52.9 | 55.6 | 3.9 | 5.1 | 16.3 |
| FF Other Hot Drinks | 34.0 | 36.3 | 39.6 | 39.0 | 39.8 | 4.0 | 2.1 | 17.1 |
| FF Chocolate-based Flavoured Powder Drinks | 34.0 | 36.3 | 39.6 | 39.0 | 39.8 | 4.0 | 2.1 | 17.1 |
| FF Soft Drinks | 468.1 | 483.5 | 458.8 | 473.8 | 498.4 | 1.6 | 5.2 | 6.5 |
| FF Bottled Water | 19.0 | 15.3 | 16.1 | 17.8 | 20.3 | 1.7 | 14.0 | 6.8 |
| FF Energy Drinks | 67.5 | 71.9 | 80.9 | 85.1 | 90.9 | 7.7 | 6.8 | 34.7 |
| FF Fruit/Vegetable Juice | 18.8 | 18.5 | 17.3 | 18.2 | 20.1 | 1.7 | 10.4 | 6.9 |
| FF Sports Drinks | 362.7 | 377.7 | 344.5 | 352.6 | 367.1 | 0.3 | 4.1 | 1.2 |
| Regular Sports Drinks | 362.7 | 377.7 | 344.5 | 352.6 | 367.1 | 0.3 | 4.1 | 1.2 |
|
Source: Euromonitor International, 2023 *CAGR: compound annual growth rate |
||||||||
Fortified/Functional Beverages are expected to grow at a CAGR of 6.0%. FF Fruit/Vegetable Juice is expected to grow at a CAGR of 25.0% between 2022 and 2026, followed by FF energy drinks at a CAGR of 6.9%, reaching US$118.7 million in 2026. Annual growth 2022 to 2023 of FF beverages is 5.4% and total gowth 2022 to 2026 of FF beverages is 26.4%.
| Category | 2023 | 2024 | 2025 | 2026 | CAGR* % 2022-2026 | Annual growth % 2022-2023 | Total growth % 2022-2026 |
|---|---|---|---|---|---|---|---|
| Fortified/Functional Beverages | 626.1 | 659.9 | 698.6 | 750.8 | 6.0 | 5.4 | 26.4 |
| FF Hot Drinks | 99.3 | 103.4 | 107.2 | 111.3 | 3.9 | 4.1 | 16.7 |
| FF Tea | 58.7 | 62.2 | 66.0 | 70.0 | 5.9 | 5.6 | 25.9 |
| FF Fruit/Herbal Tea | 58.7 | 62.2 | 66.0 | 70.0 | 5.9 | 5.6 | 25.9 |
| FF Other Hot Drinks | 40.6 | 41.1 | 41.2 | 41.3 | 0.9 | 2.0 | 3.8 |
| FF Chocolate-based Flavoured Powder Drinks | 40.6 | 41.1 | 41.2 | 41.3 | 0.9 | 2.0 | 3.8 |
| FF Soft Drinks | 526.8 | 556.5 | 591.3 | 639.5 | 6.4 | 5.7 | 28.3 |
| FF Bottled Water | 20.2 | 20.0 | 19.8 | 19.5 | −1.0 | −0.5 | −3.9 |
| FF Energy Drinks | 96.9 | 103.5 | 110.8 | 118.7 | 6.9 | 6.6 | 30.6 |
| FF Fruit/Vegetable Juice | 22.3 | 24.6 | 31.0 | 49.1 | 25.0 | 10.9 | 144.3 |
| FF Sports Drinks | 387.4 | 408.4 | 429.7 | 452.2 | 5.4 | 5.5 | 23.2 |
| Regular Sports Drinks | 387.4 | 408.4 | 429.7 | 452.2 | 5.4 | 5.5 | 23.2 |
|
Source: Euromonitor International, 2023 *CAGR: compound annual growth rate |
|||||||
Distribution channels
FF foods and beverages were distributed mainly through store-based retailing at US$6,921.9 million representing 80.0% of all the distribution channels in 2021. It grew at a CAGR of 4.2% from 2016 to 2021. Non-store retailing at US$1,729.1 million representing 20.0% among all the distribution channels in 2021. It grew at a CAGR of 10.9% from 2016 to 2021. Especially the E-Commerce recorded the fastest CAGR growth at 20.7% in actual retail value table or 11.5% in per centage table, from 2016 to 2021, representing 14.5% of all the distribution channels and reaching US$1,256.3 million in 2021.
| Channel | 2016 | 2017 | 2018 | 2019 | 2020 | 2021 | CAGR* % 2016-2021 |
|---|---|---|---|---|---|---|---|
| Store-Based Retailing | 5,872.5 | 6,264.7 | 6,602.4 | 6,210.2 | 6,211.4 | 6,921.9 | 4.2 |
| Grocery Retailers | 5,365.8 | 5,683.0 | 5,951.2 | 5,578.3 | 5,577.0 | 6,180.0 | 3.6 |
| Modern Grocery Retailers | 4,418.4 | 4,701.9 | 4,965.2 | 4,675.7 | 4,681.0 | 5,198.5 | 4.1 |
| Convenience Stores | 1,181.9 | 1,330.9 | 1,453.5 | 1,390.2 | 1,479.6 | 1,720.2 | 9.8 |
| Forecourt Retailers | 5.4 | 6.0 | 8.6 | 8.3 | 8.4 | 9.0 | 13.6 |
| Hypermarkets | 2,098.1 | 2,178.1 | 2,235.8 | 2,083.9 | 1,952.2 | 2,069.9 | −0.3 |
| Supermarkets | 1,133.0 | 1,186.9 | 1,267.2 | 1,193.2 | 1,240.8 | 1,399.4 | 5.4 |
| Traditional Grocery Retailer | 947.4 | 981.1 | 986.0 | 902.7 | 896.0 | 981.5 | 0.9 |
| Food/ drink/tobacco specialists | 3.7 | 4.6 | 5.4 | 5.6 | 4.0 | 3.3 | −2.8 |
| Independent Small Grocers | 799.5 | 816.1 | 809.5 | 740.4 | 730.7 | 798.1 | 0.0 |
| Other Grocery Retailers | 144.3 | 160.4 | 171.2 | 156.6 | 161.2 | 180.1 | 5.7 |
| Non-Grocery Specialists | 5.7 | 5.5 | 5.8 | 5.4 | 5.4 | 5.8 | 0.4 |
| Mixed Retailers | 501.0 | 576.2 | 645.4 | 626.4 | 629.0 | 736.1 | 10.1 |
| Non-Store Retailing | 1,142.6 | 1,213.8 | 1,270.6 | 1,399.2 | 1,611.8 | 1,729.1 | 10.9 |
| Vending | 51.9 | 52.8 | 52.5 | 49.9 | 46.5 | 48.0 | −1.9 |
| Homeshopping | 6.5 | 6.7 | 6.7 | 6.1 | 5.3 | 5.7 | −3.2 |
| E-Commerce | 591.9 | 669.7 | 747.0 | 925.3 | 1,154.4 | 1,256.3 | 20.7 |
| Direct Selling | 492.3 | 484.6 | 464.3 | 417.9 | 405.7 | 419.2 | −3.9 |
|
Source: Euromonitor International, 2023 *CAGR: compound annual growth rate |
|||||||
| Channel | 2016 | 2017 | 2018 | 2019 | 2020 | 2021 | CAGR* % 2016-2021 |
|---|---|---|---|---|---|---|---|
| Store-Based Retailing | 83.7 | 83.8 | 83.9 | 81.6 | 79.4 | 80.0 | −0.9 |
| Grocery Retailers | 76.5 | 76.0 | 75.6 | 73.3 | 71.3 | 71.4 | −1.4 |
| Modern Grocery Retailers | 63.0 | 62.9 | 63.1 | 61.4 | 59.8 | 60.1 | −0.9 |
| Convenience Stores | 16.8 | 17.8 | 18.5 | 18.3 | 18.9 | 19.9 | 3.4 |
| Forecourt Retailers | 0.1 | 0.1 | 0.1 | 0.1 | 0.1 | 0.1 | 0.0 |
| Hypermarkets | 29.9 | 29.1 | 28.4 | 27.4 | 25.0 | 23.9 | −4.4 |
| Supermarkets | 16.2 | 15.9 | 16.1 | 15.7 | 15.9 | 16.2 | 0.0 |
| Traditional Grocery Retailer | 13.5 | 13.1 | 12.5 | 11.9 | 11.5 | 11.3 | −3.5 |
| Food/ drink/tobacco specialists | 0.1 | 0.1 | 0.1 | 0.1 | 0.1 | 0.0 | −100.0 |
| Independent Small Grocers | 11.4 | 10.9 | 10.3 | 9.7 | 9.3 | 9.2 | −4.2 |
| Other Grocery Retailers | 2.1 | 2.1 | 2.2 | 2.1 | 2.1 | 2.1 | 0.0 |
| Non-Grocery Specialists | 0.1 | 0.1 | 0.1 | 0.1 | 0.1 | 0.1 | 0.0 |
| Mixed Retailers | 7.1 | 7.7 | 8.2 | 8.2 | 8.0 | 8.5 | 3.7 |
| Non-Store Retailing | 16.3 | 16.2 | 16.1 | 18.4 | 20.6 | 20.0 | 4.2 |
| Vending | 0.7 | 0.7 | 0.7 | 0.7 | 0.6 | 0.6 | −3.0 |
| Homeshopping | 0.1 | 0.1 | 0.1 | 0.1 | 0.1 | 0.1 | 0.0 |
| E-Commerce | 8.4 | 9.0 | 9.5 | 12.2 | 14.8 | 14.5 | 11.5 |
| Direct Selling | 7.0 | 6.5 | 5.9 | 5.5 | 5.2 | 4.8 | −7.3 |
| Total | 100.0 | 100.0 | 100.0 | 100.0 | 100.0 | 100.0 | 0.0 |
|
Source: Euromonitor International, 2023 *CAGR: compound annual growth rate |
|||||||
FF foods were distributed mainly through store-based retailing at US$1,560.2 million, representing 67.7% of all the distribution channels in 2021. It grew negatively at a CAGR of −2.0% from 2016 to 2021. Non-store retailing at US$743.4 million, representing 32.3% of all the distribution channels in 2021. It grew at a CAGR of −0.5% from 2016 to 2021. Especially the E-Commerce recorded the fastest CAGR growth at 4.9% in actual retail value table or 6.6% in per centage table from 2016 to 2021, representing 14.6% of all the distribution channels and reaching US$335.6 million in 2021.
| Channel | 2016 | 2017 | 2018 | 2019 | 2020 | 2021 | CAGR* % 2016-2021 |
|---|---|---|---|---|---|---|---|
| Store-Based Retailing | 1,722.6 | 1,696.7 | 1,644.3 | 1,585.8 | 1,478.6 | 1,560.2 | −2.0 |
| Grocery Retailers | 1,638.8 | 1,597.5 | 1,535.2 | 1,470.7 | 1,365.5 | 1,435.8 | −2.6 |
| Modern Grocery Retailers | 1,296.0 | 1,278.1 | 1,239.1 | 1,194.5 | 1,120.5 | 1,182.4 | −1.8 |
| Convenience Stores | 297.7 | 304.0 | 302.9 | 299.2 | 327.2 | 368.6 | 4.4 |
| Forecourt Retailers | 1.1 | 1.0 | 0.9 | 0.8 | 0.8 | 0.7 | −8.6 |
| Hypermarkets | 754.6 | 737.1 | 693.9 | 649.2 | 565.5 | 564.4 | −5.6 |
| Supermarkets | 242.6 | 236.0 | 241.4 | 245.3 | 227.0 | 248.8 | 0.5 |
| Traditional Grocery Retailer | 342.9 | 319.5 | 296.1 | 276.2 | 245.1 | 253.4 | −5.9 |
| Independent Small Grocers | 342.9 | 319.5 | 296.1 | 276.2 | 245.1 | 253.4 | −5.9 |
| Mixed Retailers | 83.8 | 99.1 | 109.1 | 115.1 | 113.1 | 124.4 | 8.2 |
| Non-Store Retailing | 762.4 | 776.8 | 763.2 | 715.8 | 703.0 | 743.4 | −0.5 |
| Vending | 29.8 | 28.9 | 27.0 | 25.3 | 21.8 | 20.7 | −7.0 |
| E-Commerce | 264.6 | 289.9 | 299.8 | 299.2 | 305.4 | 335.6 | 4.9 |
| Direct Selling | 468.0 | 458.0 | 436.4 | 391.3 | 375.8 | 387.0 | −3.7 |
|
Source: Euromonitor International, 2023 *CAGR: compound annual growth rate |
|||||||
| Channel | 2016 | 2017 | 2018 | 2019 | 2020 | 2021 | CAGR* % 2016-2021 |
|---|---|---|---|---|---|---|---|
| Store-Based Retailing | 69.3 | 68.6 | 68.3 | 68.9 | 67.8 | 67.7 | −0.5 |
| Grocery Retailers | 65.9 | 64.6 | 63.8 | 63.9 | 62.6 | 62.3 | −1.1 |
| Modern Grocery Retailers | 52.2 | 51.7 | 51.5 | 51.9 | 51.4 | 51.3 | −0.3 |
| Convenience Stores | 12.0 | 12.3 | 12.6 | 13.0 | 15.0 | 16.0 | 5.9 |
| Forecourt Retailers | 0.0 | 0.0 | 0.0 | 0.0 | 0.0 | 0.0 | 0.0 |
| Hypermarkets | 30.4 | 29.8 | 28.8 | 28.2 | 25.9 | 24.5 | −4.2 |
| Supermarkets | 9.8 | 9.5 | 10.0 | 10.7 | 10.4 | 10.8 | 2.0 |
| Traditional Grocery Retailer | 13.8 | 12.9 | 12.3 | 12.0 | 11.2 | 11.0 | −4.4 |
| Independent Small Grocers | 13.8 | 12.9 | 12.3 | 12.0 | 11.2 | 11.0 | −4.4 |
| Mixed Retailers | 3.4 | 4.0 | 4.5 | 5.0 | 5.2 | 5.4 | 9.7 |
| Non-Store Retailing | 30.7 | 31.4 | 31.7 | 31.1 | 32.2 | 32.3 | 1.0 |
| Vending | 1.2 | 1.2 | 1.1 | 1.1 | 1.0 | 0.9 | −5.6 |
| E-Commerce | 10.6 | 11.7 | 12.5 | 13.0 | 14.0 | 14.6 | 6.6 |
| Direct Selling | 18.8 | 18.5 | 18.1 | 17.0 | 17.2 | 16.8 | −2.2 |
| Total | 100.0 | 100.0 | 100.0 | 100.0 | 100.0 | 100.0 | 0.0 |
|
Source: Euromonitor International, 2023 *CAGR: compound annual growth rate |
|||||||
FF beverages were distributed mainly through store-based retailing at US$481.2 million, representing 85.1% of all the distribution channels in 2021. It grew at a CAGR of 2.4% from 2016 to 2021. Non-store retailing at US$84.5 million representing 14.9% of all the distribution channels in 2021. It grew at a CAGR of 14.4% from 2016 to 2021. The E-Commerce recorded the negative growth at a CAGR −2.6% in actual retail value table or −6.5% from per centage share table from 2016 to 2021, representing 1.0% of all the distribution channels and reaching US$5.7 million in 2021.
| Channel | 2016 | 2017 | 2018 | 2019 | 2020 | 2021 | CAGR* % 2016-2021 |
|---|---|---|---|---|---|---|---|
| Store-Based Retailing | 427.6 | 476.0 | 517.9 | 474.2 | 433.2 | 481.2 | 2.4 |
| Grocery Retailers | 286.7 | 319.2 | 346.0 | 316.1 | 288.3 | 319.4 | 2.2 |
| Modern Grocery Retailers | 249.7 | 270.9 | 296.7 | 271.7 | 247.8 | 275.3 | 2.0 |
| Convenience Stores | 42.6 | 50.0 | 55.0 | 50.8 | 46.9 | 52.9 | 4.4 |
| Forecourt Retailers | 0.5 | 0.5 | 0.6 | 0.6 | 0.5 | 0.6 | 3.7 |
| Hypermarkets | 146.7 | 162.4 | 179.3 | 164.6 | 151.1 | 168.5 | 2.8 |
| Supermarkets | 60.0 | 58.0 | 61.8 | 55.7 | 49.3 | 53.3 | −2.3 |
| Traditional Grocery Retailer | 37.0 | 48.3 | 49.3 | 44.4 | 40.6 | 44.1 | 3.6 |
| Independent Small Grocers | 18.6 | 26.9 | 25.2 | 20.8 | 18.5 | 19.0 | 0.4 |
| Other Grocery Retailers | 18.4 | 21.4 | 24.2 | 23.6 | 22.1 | 25.2 | 6.5 |
| Non-Grocery Specialists | 0.9 | 0.5 | 0.6 | 0.6 | 0.5 | 0.6 | −7.8 |
| Mixed Retailers | 140.0 | 156.3 | 171.3 | 157.6 | 144.3 | 161.2 | 2.9 |
| Non-Store Retailing | 35.2 | 39.7 | 43.8 | 75.9 | 92.6 | 84.5 | 19.1 |
| Vending | 2.8 | 3.1 | 3.4 | 3.3 | 3.2 | 3.1 | 2.1 |
| E-Commerce | 6.5 | 6.7 | 6.7 | 6.1 | 5.3 | 5.7 | −2.6 |
| Direct Selling | 25.9 | 29.9 | 33.7 | 66.6 | 84.2 | 75.8 | 24.0 |
|
Source: Euromonitor International, 2023 *CAGR: compound annual growth rate |
|||||||
| Channel | 2016 | 2017 | 2018 | 2019 | 2020 | 2021 | CAGR* % 2016-2021 |
|---|---|---|---|---|---|---|---|
| Store-Based Retailing | 92.4 | 92.3 | 92.2 | 86.2 | 82.4 | 85.1 | −1.6 |
| Grocery Retailers | 62.0 | 61.9 | 61.6 | 57.5 | 54.8 | 56.5 | −1.8 |
| Modern Grocery Retailers | 54.0 | 52.5 | 52.8 | 49.4 | 47.1 | 48.7 | −2.0 |
| Convenience Stores | 9.2 | 9.7 | 9.8 | 9.2 | 8.9 | 9.4 | 0.4 |
| Forecourt Retailers | 0.1 | 0.1 | 0.1 | 0.1 | 0.1 | 0.1 | 0.0 |
| Hypermarkets | 31.7 | 31.5 | 31.9 | 29.9 | 28.7 | 29.8 | −1.2 |
| Supermarkets | 13.0 | 11.2 | 11.0 | 10.1 | 9.4 | 9.4 | −6.3 |
| Traditional Grocery Retailer | 8.0 | 9.4 | 8.8 | 8.1 | 7.7 | 7.8 | −0.5 |
| Independent Small Grocers | 4.0 | 5.2 | 4.5 | 3.8 | 3.5 | 3.4 | −3.2 |
| Other Grocery Retailers | 4.0 | 4.2 | 4.3 | 4.3 | 4.2 | 4.5 | 2.4 |
| Non-Grocery Specialists | 0.2 | 0.1 | 0.1 | 0.1 | 0.1 | 0.1 | −12.9 |
| Mixed Retailers | 30.3 | 30.3 | 30.5 | 28.6 | 27.4 | 28.5 | −1.2 |
| Non-Store Retailing | 7.6 | 7.7 | 7.8 | 13.8 | 17.6 | 14.9 | 14.4 |
| Vending | 0.6 | 0.6 | 0.6 | 0.6 | 0.6 | 0.6 | 0.0 |
| E-Commerce | 1.4 | 1.3 | 1.2 | 1.1 | 1.0 | 1.0 | −6.5 |
| Direct Selling | 5.6 | 5.8 | 6.0 | 12.1 | 16.0 | 13.4 | 19.1 |
| Total | 100.0 | 100.0 | 100.0 | 100.0 | 100.0 | 100.0 | 0.0 |
|
Source: Euromonitor International, 2023 *CAGR: compound annual growth rate |
|||||||
Top company retail shares
In 2021, leading companies in the FF packaged food category were fairly distributed and included the Yakult Honsha Co Ltd at a 31.4% market share, with a CAGR of 2.4%, Namyang Dairy Products Co Ltd (9.6% market share, with a CAGR of −8.3%), and the Maeil Dairies Co Ltd (8,9% market share, with a CAGR of −1.5%).
| Company name | 2016 | 2017 | 2018 | 2019 | 2020 | 2021 | CAGR* % 2016 to 2021 | Market share % 2021 |
|---|---|---|---|---|---|---|---|---|
| Yakult Honsha Co Ltd | 642.0 | 671.0 | 637.1 | 690.8 | 667.5 | 722.7 | 2.4 | 31.4 |
| Namyang Dairy Products Co Ltd | 339.9 | 328.7 | 298.1 | 241.8 | 225.5 | 220.6 | −8.3 | 9.6 |
| Maeil Dairies Co Ltd | 220.7 | 200.1 | 209.9 | 197.3 | 192.4 | 204.9 | −1.5 | 8.9 |
| Seoul Dairy Cooperative | 323.1 | 286.4 | 197.8 | 194.4 | 176.5 | 183.8 | −10.7 | 8.0 |
| Lotte Group | 192.9 | 208.9 | 216.5 | 211.2 | 173.5 | 182.2 | −1.1 | 7.9 |
| Dongwon Group | 106.9 | 116.8 | 131.3 | 144.4 | 125.2 | 133.5 | 4.5 | 5.8 |
| General Mills Inc | 126.4 | 131.3 | 135.3 | 113.0 | 108.7 | 108.2 | −3.1 | 4.7 |
| Danone, Groupe | 50.8 | 67.0 | 84.6 | 79.4 | 79.8 | 88.2 | 11.7 | 3.8 |
| Post Holdings Inc | 65.4 | 80.4 | 81.9 | 73.4 | 75.0 | 79.7 | 4.0 | 3.5 |
| Kellogg Co | 52.3 | 56.1 | 57.0 | 53.8 | 55.8 | 60.7 | 3.0 | 2.6 |
|
Source: Euromonitor International, 2023 *CAGR: compound annual growth rate |
||||||||
In 2021, top leaders within the FF drink category included Otsuka Holdings Co Ltd, 23.0% market share, with a CAGR of 1.5%, followed by the Coca-Cola Co (21.8% market share, with a CAGR of 4.0%), and PepsiCo Inc (13.7% market share, with a CAGR of 10.4%) in 2021.
| Company name | 2016 | 2017 | 2018 | 2019 | 2020 | 2021 | CAGR* % 2016 to 2021 | Market share % 2021 |
|---|---|---|---|---|---|---|---|---|
| Otsuka Holdings Co Ltd | 120.8 | 143.9 | 156.8 | 145.1 | 124.0 | 129.9 | 1.5 | 23.0 |
| Coca-Cola Co, The | 101.5 | 112.5 | 123.4 | 127.0 | 115.8 | 123.4 | 4.0 | 21.8 |
| PepsiCo Inc | 47.4 | 60.3 | 70.9 | 72.5 | 69.8 | 77.6 | 10.4 | 13.7 |
| Lotte Group | 63.7 | 63.6 | 68.7 | 65.0 | 66.9 | 72.9 | 2.7 | 12.9 |
| Dongsuh Cos Inc | 24.1 | 24.5 | 24.2 | 22.4 | 24.2 | 24.2 | 0.1 | 4.3 |
| Monster Beverage Corp | 10.2 | 12.9 | 14.1 | 14.0 | 19.0 | 22.6 | 17.2 | 4.0 |
| Red Bull GmbH | 8.6 | 9.2 | 10.2 | 10.1 | 10.6 | 11.4 | 5.8 | 2.0 |
| Nestlé SA | 7.6 | 7.4 | 7.4 | 6.8 | 9.0 | 9.1 | 3.7 | 1.6 |
| Kikkoman Corp | 5.8 | 6.9 | 7.0 | 6.3 | 5.2 | 5.2 | −2.2 | 0.9 |
| Sunkist Growers Inc | 1.4 | 1.4 | 1.4 | 1.1 | 0.9 | 1.0 | −6.5 | 0.2 |
|
Source: Euromonitor International, 2023 *CAGR: compound annual growth rate |
||||||||
New product launch analysis
According to Mintel's Global New Products Database (GNPD), there were 594 launches of functional food and beverage products in South Korea between January 2018 and December 2022. Among which, 101 were functional food, 493 were functional beverages.
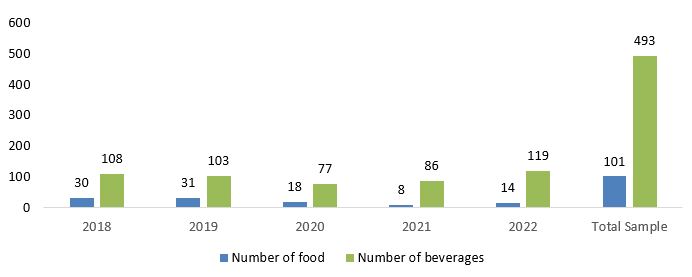
Description of above image
| Date Published | Number of functional food | Number of functional beverages |
|---|---|---|
| 2018 | 30 | 108 |
| 2019 | 31 | 103 |
| 2020 | 18 | 77 |
| 2021 | 8 | 86 |
| 2022 | 14 | 119 |
| Total Sample | 101 | 493 |
Source: Mintel, 2023
In 2022, the top five functional packaged food products manufacturers were located in South Korea, China, UK, USA and Australia. The top five brands were Pasteur Kwaebyeon, Pasteur with Mom, Sempio Sunjak, Medifood and Colioli. The top ingredient claims were artificial, organic, nutrient. high oleic and green.
| Product attributes | Yearly launch count | |||||
|---|---|---|---|---|---|---|
| 2018 | 2019 | 2020 | 2021 | 2022 | Total | |
| Top five flavours | ||||||
| Unflavoured/Plain | 15 | 12 | 9 | 2 | 1 | 39 |
| Chicken | 1 | 1 | 1 | 4 | 2 | 9 |
| Apple | 4 | 1 | 0 | 0 | 1 | 6 |
| Salmon | 0 | 2 | 0 | 0 | 2 | 4 |
| Tuna | 0 | 2 | 1 | 0 | 1 | 4 |
| Top five locations of manufacture | ||||||
| South Korea | 1 | 2 | 1 | 3 | 0 | 7 |
| China | 0 | 0 | 0 | 0 | 4 | 4 |
| United Kingdom | 0 | 2 | 1 | 1 | 0 | 4 |
| United States | 0 | 2 | 0 | 1 | 0 | 3 |
| Australia | 1 | 0 | 0 | 0 | 1 | 2 |
| Top five brands | ||||||
| Pasteur Kwaebyeon | 0 | 4 | 3 | 0 | 0 | 7 |
| Pasteur with Mom | 2 | 3 | 1 | 0 | 0 | 6 |
| Sempio Sunjak | 2 | 4 | 0 | 0 | 0 | 6 |
| Medifood | 4 | 0 | 0 | 0 | 0 | 4 |
| Colioli | 0 | 0 | 0 | 0 | 4 | 4 |
| Top launch types | ||||||
| New Product | 16 | 8 | 11 | 4 | 6 | 45 |
| New Variety / Range Extension | 8 | 12 | 5 | 4 | 5 | 34 |
| New Packaging | 3 | 11 | 2 | 0 | 3 | 19 |
| Relaunch | 3 | 0 | 0 | 0 | 0 | 3 |
| Top five categories | ||||||
| Dairy | 3 | 10 | 6 | 1 | 3 | 23 |
| Pet Food | 2 | 4 | 4 | 4 | 7 | 21 |
| Baby Food | 7 | 4 | 2 | 0 | 0 | 13 |
| Hot Beverages | 2 | 8 | 0 | 1 | 0 | 11 |
| Nutritional Drinks and Other Beverages | 8 | 0 | 2 | 1 | 0 | 11 |
| Top ingredient claims | ||||||
| Artificial | 4 | 8 | 7 | 1 | 4 | 24 |
| Coconut Oil Derived | 5 | 4 | 2 | 0 | 1 | 12 |
| High Oleic | 5 | 5 | 2 | 0 | 0 | 12 |
| Nutrient | 6 | 4 | 2 | 0 | 0 | 12 |
| Green | 3 | 2 | 1 | 0 | 2 | 8 |
| Source: Mintel, 2023 | ||||||
In 2022, the top five manufacturers of the functional beverages were located in South Korea, USA, UK, Australia and France. The top five brands were Healthhook, Osulloc, Great4u Pocket, Nutri D-Day Diet and Joyulche Diet Body Balance. The top ingredient claims were artificial, organic, nutrient, fatty and reduced sugar.
| Product attributes | Yearly launch count | |||||
|---|---|---|---|---|---|---|
| 2018 | 2019 | 2020 | 2021 | 2022 | Total | |
| Top five flavours | ||||||
| Unflavoured/Plain | 19 | 8 | 23 | 16 | 11 | 77 |
| Chocolate | 5 | 6 | 7 | 11 | 12 | 41 |
| Grain | 2 | 4 | 5 | 5 | 17 | 33 |
| Cookies and Cream | 7 | 5 | 2 | 1 | 0 | 15 |
| Banana | 4 | 3 | 0 | 2 | 1 | 10 |
| Top five locations of manufacture | ||||||
| South Korea | 19 | 11 | 12 | 6 | 7 | 55 |
| United States | 4 | 2 | 0 | 0 | 0 | 6 |
| United Kingdom | 2 | 1 | 0 | 1 | 1 | 5 |
| Australia | 0 | 0 | 0 | 0 | 1 | 1 |
| France | 0 | 0 | 0 | 0 | 1 | 1 |
| Top five brands | ||||||
| Healthhook | 0 | 28 | 0 | 0 | 0 | 28 |
| Osulloc | 5 | 6 | 0 | 2 | 3 | 16 |
| Great4u Pocket | 0 | 0 | 0 | 11 | 0 | 11 |
| Nutri D-Day Diet | 2 | 4 | 3 | 0 | 0 | 9 |
| Joyulche Diet Body Balance | 9 | 0 | 0 | 0 | 0 | 9 |
| Top launch types | ||||||
| New Variety/Range Extension | 3 | 4 | 0 | 2 | 0 | 9 |
| New Product | 5 | 0 | 2 | 0 | 0 | 7 |
| New Packaging | 2 | 4 | 0 | 0 | 0 | 6 |
| Top categories | ||||||
| Hot Beverages | 2 | 8 | 0 | 1 | 0 | 11 |
| Nutritional Drinks and Other Beverages | 8 | 0 | 2 | 1 | 0 | 11 |
| Top five ingredient claims | ||||||
| Artificial | 2 | 0 | 1 | 1 | 0 | 4 |
| Organic | 0 | 2 | 0 | 1 | 0 | 3 |
| Nutrient | 2 | 0 | 1 | 0 | 0 | 3 |
| Fatty | 1 | 0 | 0 | 0 | 0 | 1 |
| Reduced Sugar | 1 | 0 | 0 | 0 | 0 | 1 |
| Source: Mintel, 2023 | ||||||
The Canada-Korea Free Trade Agreement (CKFTA)
Tariff preferences for Canadian exports to Korea
Since January 1, 2021, 98.5% of Canada's exports are eligible for duty-free access into Korea.
For many products still subject to duties in Korea, preferential tariff treatment is offered in the form of reduced tariffs. Tariffs are reduced on January 1 of each year until remaining duties for goods covered under the Canada-Korea Free Trade Agreement (CKFTA) are eliminated.
Upon full implementation of the CKFTA on January 1, 2032, Korean tariffs will be eliminated on 99.75% of Canada's exports.
To benefit from tariff preferences in Korea, Canadian exporters must ensure goods meet applicable rules of origin. The importer must have a valid certificate of origin in their possession at the time of importation.
Note: Tariff information is provided for indicative purposes only. The tariff treatment of a good exported to Korea depends on its specific tariff classification as determined by the Korea Customs Service.
Consult the Canada Tariff Finder to explore tariff information for the Korean market under the CKFTA.
Examples of new product launches
Sports Power Bar
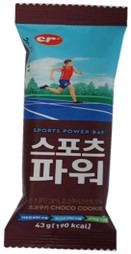
Source: Mintel, 2023
| Company | CR Foods |
|---|---|
| Manufacturer | CR Foods |
| Brand | CR |
| Category | Snacks |
| Sub-category | Snack / cereal / energy bars |
| Market | South Korea |
| Store type | Convenience store |
| Date published | September 2021 |
| Launch type | New product |
| Price in local currency | KRW1,500.00 |
| Price in US dollars | 1.30 |
| Price in Euros | 1.09 |
CR Sports Power Bar is made with 18% quasi-milk chocolate and 9% choco cookie crunch, and contains 600 milligrams of taurine, 300 milligrams of iBCAA and 10 grams of protein. This product retails in a 43 grams pack bearing the HACCP logo.
High Fibre Bran Cereal
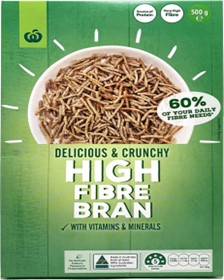
Source: Mintel, 2023
| Company | Woolworths |
|---|---|
| Manufacturer | Green's General Foods |
| Distributor | KOTC |
| Brand | Woolworths |
| Category | Breakfast cereals |
| Sub-category | Cold cereals |
| Market | South Korea |
| Location of manufacture | Australia |
| Import status | Imported product |
| Date published | May 2022 |
| Launch type | New product |
| Price in local currency | KRW9,000.00 |
| Price in US dollars | 7.04 |
| Price in Euros | 6.76 |
Woolworths High Fibre Bran Cereal is said to be delicious and crunchy with vitamins and minerals including thiamin, riboflavin and niacin for energy; iron to support a healthy immune system; folate to help reduce tiredness and fatigue; and magnesium for nerve and muscle function. It is a source of protein, and is high in fibre, containing 60% of daily fibre needs to support gut health. This product is made in Australia from at least 99% Australian ingredients and contains no artificial colours, flavours or preservatives. It is suitable for vegetarians and vegans, is ready to be consumed straight from the pack or served with milk, yogurt, soy milk or fruits, and retails in a 500 gram pack bearing a Health Star Rating of five out of five.
Strawberry Flavour Protein Shake
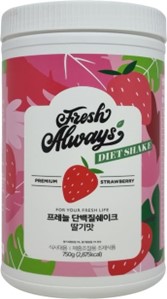
Source: Mintel, 2023
| Company | All Nature |
|---|---|
| Manufacturer | MLO Korea |
| Distributor | All Nature |
| Brand | Fresh Always Diet Shake |
| Category | Nutritional drinks and other beverages |
| Sub-category | Nutritional and meal replacement drinks |
| Market | South Korea |
| Date published | November 2022 |
| Launch type | New product |
| Price in local currency | KRW45,000.00 |
| Price in US dollars | 34.24 |
| Price in Euros | 33.08 |
Fresh Always Diet Shake Strawberry Flavour Protein Shake is now available, and retails in a 750 gram pack. - Premium strawberry - Slimming product - Logos and certifications: HACCP
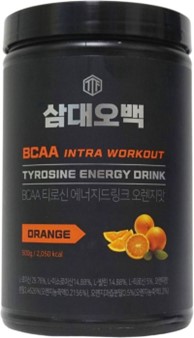
Orange Flavour Tyrosine Energy Drink
Source: Mintel, 2023
| Company | Oa |
|---|---|
| Manufacturer | Sports Biotech |
| Distributor | Oa |
| Brand | TTF Samdaeobaek BCAA Intra Workout |
| Category | Nutritional drinks and other beverages |
| Sub-category | Nutritional and meal replacement drinks |
| Market | South Korea |
| Date published | September 2022 |
| Launch type | New product |
| Price in local currency | KRW29,900.00 |
| Price in US dollars | 21.96 |
| Price in Euros | 22.06 |
TTF Samdaeobaek BCAA Intra Workout Orange Flavour Tyrosine Energy Drink is now available, and retails in a 500 gram pack. Logos and certifications: HACCP
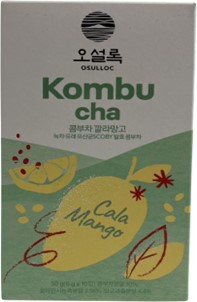
Cala Mango Kombucha
Source: Mintel, 2023
| Company | Amorepacific |
|---|---|
| Manufacturer | Amorepacific |
| Distributor | Osulloc |
| Brand | Osulloc |
| Category | Nutritional drinks and other beverages |
| Sub-category | Kombucha and other fermented drinks |
| Market | South Korea |
| Location of manufacture | South Korea |
| Date published | October 2022 |
| Launch type | New variety / range extension |
| Price in local currency | KRW8,000.00 |
| Price in US dollars | 5.62 |
| Price in Euros | 5.80 |
Osulloc Cala Mango Kombucha is now available, and retails in a 50 gram pack containing ten 5 gram units. - Contains Jeju green tea derived SCOBY lactobacillus, which are excellent at surviving inside of intestine for digestive health - Contains catechin, which is part of polyphenol that provides energy - Contains mixed amino acids - Comprises bitter calamansi juice concentrate powder, sweet mango juice powder and kombucha powder - Real kombucha fermented with honey - Enriched with vitamin C - Logos and certifications: FSC Mix, HACCP
For more information
The Canadian Trade Commissioner Service:
International Trade Commissioners can provide Canadian industry with on-the-ground expertise regarding market potential, current conditions and local business contacts, and are an excellent point of contact for export advice.
More agri-food market intelligence:
International agri-food market intelligence
Discover global agriculture and food opportunities, the complete library of Global Analysis reports, market trends and forecasts, and information on Canada's free trade agreements.
Agri-food market intelligence service
Canadian agri-food and seafood businesses can take advantage of a customized service of reports and analysis, and join our email subscription service to have the latest reports delivered directly to their inbox.
More on Canada's agriculture and agri-food sectors:
Canada's agriculture sectors
Information on the agriculture industry by sector. Data on international markets. Initiatives to support awareness of the industry in Canada. How the department engages with the industry.
For additional information on Seoul Food and Hotel 2023, please contact:
Ben Berry, Deputy Director
Trade Show Strategy and Delivery
Agriculture and agri-food Canada
ben.berry@agr.gc.ca
Resources
- Euromonitor International. 2023
- McKinsey and Company 2023
- Mintel Global New Products Database. 2023
Health and wellness series – Functional foods and beverages in South Korea
Global Analysis Report
Prepared by: Hongli, Wang, Market Analyst
© His Majesty the King in Right of Canada, represented by the Minister of Agriculture and Agri-Food (2023).
Photo credits
All photographs reproduced in this publication are used by permission of the rights holders.
All images, unless otherwise noted, are copyright His Majesty the King in Right of Canada.
To join our distribution list or to suggest additional report topics or markets, please contact:
Agriculture and Agri-Food Canada, Global Analysis1341 Baseline Rd, Tower 5, 3rd floor
Ottawa ON K1A 0C5
Canada
Email: aafc.mas-sam.aac@agr.gc.ca
The Government of Canada has prepared this report based on primary and secondary sources of information. Although every effort has been made to ensure that the information is accurate, Agriculture and Agri-Food Canada (AAFC) assumes no liability for any actions taken based on the information contained herein.
Reproduction or redistribution of this document, in whole or in part, must include acknowledgement of agriculture and agri-food Canada as the owner of the copyright in the document, through a reference citing AAFC, the title of the document and the year. Where the reproduction or redistribution includes data from this document, it must also include an acknowledgement of the specific data source(s), as noted in this document.
Agriculture and Agri-Food Canada provides this document and other report services to agriculture and food industry clients free of charge.