

Note: This report includes forecasting data that is based on baseline historical data.
Executive summary
In 2022, the global fish and seafood market showed that Belgium was the 19th largest market, with a market value share of 1.2% and a total import value of US$2.36 billion. Belgium experienced a slight increase in imports, reaching US$2.36 billion (318 million kilograms) in 2018, with a compound annual growth rate (CAGR) of 0.1%.
Belgium has a diverse supply network for fish and seafood products, with the top three suppliers being the Netherlands (25.4% market value share, US$600.1 million, 76.7 million kilograms), India (7.9% market value share, US$187.2 million, 23.5 million kilograms), and Vietnam (7.5% market value share, US$177.5 million, 21.9 million kilograms) in 2022. Canada was the 10th largest supplier, with a 3.3% market value share, providing US$77.4 million and 3.6 million kilograms in 2022.
The top imported fish and seafood products in Belgium were frozen shrimps and prawns, valued at US$433.7 million (45.2 million kilograms), followed by fresh or chilled fillets of Pacific salmon, valued at US$143.8 million (23.2 million kilograms), and smoked Pacific salmon, valued at US$117.8 million (17.7 million kilograms) in 2022.
Retail sales of processed meat and seafood in Belgium across various distribution channels were valued at US$2.4 billion in 2022, indicating a growth rate of 3.1% from US$2.1 billion in 2018. Offline retail, specifically grocery retailers, was the primary retail channel with a value of US$2.32 billion, representing a 3.2% increase from US$2.05 billion in 2018, accounting for 96.7% of the market share. and the forecast indicate that the market will continue to growth from 2023 to 2027 but the growth rate will decline.
The processed seafood retail market in Belgium was dominated by private labels, representing 62.5% of the market share in 2022, compared to brand labels with 37.5% market share. Private label lines such as Colruyt, Delhaize, and Carrefour continue to dominate processed meat and seafood. Branded players are responding to consumer health concerns related to processed meat by introducing products with reduced salt content or no nitrites to attract consumers.
Trade overview
Belgium ranked as the nineteenth largest market for fish and seafood in the world in 2022, with a market value share of 1.2% and imports valued at US$2,360 million (308.7 million kilograms). Over the period of 2018 to 2022, Belgium experienced a slight increase in imports from US$2,356 million (318 million kilograms), resulting in a CAGR of 0.1%.
| Country | 2018 | 2019 | 2020 | 2021 | 2022 | CAGR* % 2018-2022 | Market share % 2022 |
|---|---|---|---|---|---|---|---|
| World Total | 163,969.6 | 161,572.0 | 149,714.4 | 172,627.6 | 175,334.2 | 1.7 | 100.0 |
| United States | 23,988.6 | 23,520.8 | 22,976.5 | 30,179.3 | 30,023.0 | 5.8 | 17.1 |
| China | 14,713.1 | 18,389.9 | 15,214.7 | 17,713.5 | 23,346.6 | 12.2 | 13.3 |
| Japan | 15,782.5 | 15,564.6 | 13,577.9 | 14,375.7 | 15,387.4 | −0.6 | 8.8 |
| Spain | 8,679.8 | 8,151.8 | 7,357.2 | 8,895.6 | 8,893.6 | 0.6 | 5.1 |
| France | 7,154.9 | 6,816.9 | 6,502.5 | 7,895.2 | 7,485.6 | 1.1 | 4.3 |
| Korea (Republic of) | 6,060.3 | 5,717.6 | 5,537.8 | 6,039.6 | 6,809.4 | 3.0 | 3.9 |
| Italy | 7,113.8 | 6,731.0 | 6,151.6 | 7,541.9 | 6,500.8 | −2.2 | 3.7 |
| Germany | 6,172.2 | 5,984.1 | 6,078.4 | 6,088.5 | 5,816.5 | −1.5 | 3.3 |
| Sweden | 5,629.1 | 5,270.6 | 5,072.4 | 5,609.8 | 5,600.3 | −0.1 | 3.2 |
| Netherlands | 4,540.5 | 4,521.2 | 4,610.6 | 5,155.7 | 4,953.0 | 2.2 | 2.8 |
| Canada (13) | 3,085.1 | 3,256.5 | 2,979.9 | 3,698.3 | 3,713.0 | 4.7 | 2.1 |
| Belgium (19) | 2356.1 | 2172.2 | 2178.5 | 2400.2 | 2360.5 | 0.1 | 1.2 |
|
Source: Global Trade Tracker, 2022 *CAGR: Compound Annual Growth Rate |
|||||||
| Country | 2018 | 2019 | 2020 | 2021 | 2022 | CAGR* % 2018-2022 | Market share % 2022 |
|---|---|---|---|---|---|---|---|
| World Total | 311,357.2 | 40,648.1 | 41,092.9 | 39,805.6 | 36,644.1 | −41 | 100 |
| China | 5,191.2 | 6,244.5 | 5,634.7 | 5,721.6 | 6,469.8 | 5.7 | 17.7 |
| United States | 2,901.3 | 2,825.9 | 2,907.4 | 3,267.9 | 3,066.6 | 1.4 | 8.4 |
| Japan | 2,380.8 | 2,464.4 | 2,251.3 | 2,199.6 | 2,219.7 | −1.7 | 6.1 |
| Thailand | 2,126.5 | 2,047.6 | 2,149.3 | 2,114.7 | 2,157.3 | 0.4 | 5.9 |
| Korea | 1,558.4 | 1,531.4 | 1,536.6 | 1,652.7 | 1,713.7 | 2.4 | 4.7 |
| Spain | 1,768.4 | 1,820.8 | 1,713.7 | 1,815.1 | 1,710.9 | −0.8 | 4.7 |
| France | 1,212.9 | 1,228.1 | 1,223.9 | 1,349.8 | 1,235.6 | 0.5 | 3.4 |
| Germany | 1,203.8 | 1,172.9 | 1,216.1 | 1,153.7 | 1,034.1 | −3.7 | 2.8 |
| Netherlands | 1,097.6 | 1,066.9 | 1,104.7 | 1,175.4 | 1,008.3 | −2.1 | 2.8 |
| Viet-Nam | 1,905.0 | 1,134.9 | 1,007.0 | 773.6 | 1,000.3 | −14.9 | 2.7 |
| Canada(19) | 523 | 544.3 | 520.4 | 582.1 | 558.7 | 1.7 | 1.5 |
| Belgium (28) | 318.1 | 305.3 | 300.7 | 318.8 | 283 | −2.9 | 0.8 |
|
Source: Global Trade Tracker, 2022 *CAGR: Compound Annual Growth Rate |
|||||||
The supply network for fish and seafood products in Belgium is highly diverse. The top three suppliers of fish and seafood to Belgium in 2022 were NetherlandsFootnote 1, with a market value share of 25.4% (equivalent to US$600.1 million and 76.7 million kilograms), followed by India with a 7.9% market value share (US$187.2 million and 23.5 million kilograms), and Viet-Nam with a 7.5% market value share (US$177.5 million and 21.9 million kilograms).
Canada was the tenth largest supplier of fish and seafood products to Belgium, with a 3.3% market value share. Canada provided US$77.4 million and 3.6 million kilograms of fish and seafood to Belgium in 2022.
| Country | 2018 | 2019 | 2020 | 2021 | 2022 | CAGR* % 2018-2022 | Market share % 2022 |
|---|---|---|---|---|---|---|---|
| World | 2356.1 | 2172.2 | 2178.5 | 2400.2 | 2360.5 | 0.1 | 100.0 |
| Netherlands | 631.4 | 594.5 | 597.5 | 670.9 | 600.1 | −1.3 | 25.4 |
| India | 102.6 | 104.1 | 105.0 | 122.1 | 187.2 | 16.2 | 7.9 |
| Viet-Nam | 128.6 | 113.3 | 113.8 | 111.8 | 177.5 | 8.4 | 7.5 |
| France | 220.4 | 194.9 | 176.0 | 229.0 | 176.2 | −5.4 | 7.5 |
| Germany | 140.4 | 134.2 | 129.8 | 149.1 | 130.9 | −1.7 | 5.5 |
| Denmark | 86.1 | 69.5 | 73.6 | 88.8 | 90.1 | 1.1 | 3.8 |
| Iceland | 67.9 | 65.4 | 92.2 | 108.5 | 84.1 | 5.5 | 3.6 |
| Lithuania | 92.9 | 92.5 | 54.4 | 97.7 | 79.8 | −3.7 | 3.4 |
| Ecuador | 31.4 | 29.5 | 45.9 | 44.6 | 79.5 | 26.1 | 3.4 |
| Canada | 45.1 | 48.2 | 61.7 | 79.2 | 77.4 | 14.5 | 3.3 |
|
Source: Global Trade Tracker, 2022 *CAGR: Compound Annual Growth Rate |
|||||||
| Country | 2018 | 2019 | 2020 | 2021 | 2022 | CAGR* % 2018-2022 | Market share % 2022 |
|---|---|---|---|---|---|---|---|
| World | 317.6 | 305.6 | 300.3 | 318.4 | 308.7 | −0.7 | 100.0 |
| Netherlands | 83.3 | 87.3 | 80.5 | 88.5 | 76.7 | −2.0 | 24.8 |
| France | 28.6 | 21.6 | 21.7 | 28.6 | 29.0 | 0.3 | 9.4 |
| India | 13.3 | 14.3 | 14.7 | 17.0 | 23.5 | 15.3 | 7.6 |
| Viet-Nam | 17.2 | 16.1 | 16.5 | 14.6 | 21.9 | 6.2 | 7.1 |
| Germany | 23.1 | 21.3 | 21.0 | 23.7 | 19.1 | −4.6 | 6.2 |
| China | 16.7 | 20.5 | 17.7 | 17.0 | 12.5 | −7.0 | 4.0 |
| Denmark | 9.7 | 9.2 | 9.6 | 12.7 | 12.2 | 5.9 | 4.0 |
| Ecuador | 6.0 | 5.2 | 6.8 | 6.6 | 12.1 | 19.2 | 3.9 |
| Lithuania | 8.1 | 8.6 | 7.6 | 11.3 | 8.6 | 1.5 | 2.8 |
| Iceland | 5.5 | 5.3 | 7.2 | 8.0 | 7.4 | 7.7 | 2.4 |
| Canada (19) | 2.8 | 2.8 | 3.5 | 3.4 | 3.6 | 6.5 | 1.2 |
|
Source: Global Trade Tracker, 2022 *CAGR: Compound Annual Growth Rate |
|||||||
Belgium's total fish and seafood global imports increased slightly by a CAGR of 0.01. Top imported fish and seafood products to Belgium were frozen shrimps and prawns, valued at US$433.7 million, (45.2 million kilograms), followed by fresh or chilled fillets of pacific salmon, valued at US$143.8 million (23.2 million kilograms), and smoked pacific salmon valued at US$117.8 million (17.7 million kilograms) in 2022.
| HS Code | Description | 2018 | 2019 | 2020 | 2021 | 2022 | CAGR* % 2018-2022 |
|---|---|---|---|---|---|---|---|
| Fish and Seafood Total | 2356.1 | 2172.2 | 2178.5 | 2400.2 | 2360.5 | 0.1 | |
| 030617 | frozen shrimps and prawns, even smoked, whether in shell or not, including shrimps and prawns in shell, cooked by steaming or by boiling in water (excluding cold-water shrimps and prawns) | 374.6 | 308.5 | 320.7 | 350.9 | 433.7 | 3.7 |
| 030441 | fresh or chilled fillets of pacific salmon | 161.0 | 170.7 | 172.9 | 182.7 | 143.8 | −2.8 |
| 030541 | smoked pacific salmon including fillets (excluding offal) | 133.6 | 118.3 | 102.1 | 150.1 | 117.8 | −3.1 |
| 030444 | fresh or chilled fillets of fish of the families | 91.7 | 89.1 | 115.6 | 130.2 | 93.6 | 0.5 |
| 160414 | prepared or preserved tunas, skipjack and Atlantic bonito, whole or in pieces (excluding minced) | 115.7 | 90.5 | 98.5 | 100.7 | 86.1 | −7.1 |
| 030731 | live, fresh or chilled, not smoked, mussels "mytilus spp., perna spp.", with or without shell | 97.2 | 84.1 | 90.2 | 90.7 | 67.5 | −8.7 |
| 150420 | fats and oils of fish and their fractions, whether or not refined (excluding liver oils and chemically modified) | 43.8 | 36.6 | 51.6 | 56.5 | 64.1 | 10.0 |
| 160419 | prepared or preserved fish, whole or in pieces | 53.0 | 53.9 | 54.6 | 74.5 | 57.6 | 2.1 |
| 160521 | shrimps and prawns, prepared or preserved, not in airtight containers (excluding smoked) | 45.7 | 46.6 | 49.5 | 47.1 | 56.7 | 5.5 |
| 160529 | shrimps and prawns, prepared or preserved, in airtight containers (excluding smoked) | 67.2 | 53.9 | 53.0 | 63.3 | 53.5 | −5.5 |
|
Source: Global Trade Tracker, 2022 *CAGR: Compound Annual Growth Rate |
|||||||
| HS Code | Description | 2018 | 2019 | 2020 | 2021 | 2022 | CAGR* % 2018-2022 |
|---|---|---|---|---|---|---|---|
| Fish and Seafood Total | 317.6 | 305.6 | 300.3 | 318.4 | 308.7 | −0.7 | |
| 030617 | frozen shrimps and prawns, even smoked, whether in shell or not, including shrimps and prawns in shell, cooked by steaming or by boiling in water (excluding cold-water shrimps and prawns) | 35.8 | 33.8 | 35.5 | 37.8 | 45.2 | 6.0 |
| 150420 | fats and oils of fish and their fractions, whether or not refined (excluding liver oils and chemically modified) | 29.5 | 23.4 | 26.8 | 27.9 | 23.2 | −5.8 |
| 030731 | live, fresh or chilled, not smoked, mussels "mytilus spp., perna spp.", with or without shell | 21.6 | 22.0 | 20.0 | 20.1 | 17.7 | −4.9 |
| 160414 | prepared or preserved tunas, skipjack and Atlantic bonito, whole or in pieces (excluding minced) | 20.3 | 17.3 | 18.5 | 18.6 | 16.5 | −5.1 |
| 160419 | prepared or preserved fish, whole or in pieces | 12.3 | 12.1 | 11.7 | 15.4 | 11.7 | −1.2 |
| 160420 | prepared or preserved fish (excluding whole or in pieces) | 10.4 | 11.0 | 11.1 | 12.3 | 11.0 | 1.4 |
| 030441 | fresh or chilled fillets of pacific salmon | 11.9 | 12.8 | 13.8 | 14.1 | 11.0 | −2.0 |
| 030541 | smoked pacific salmon including fillets (excluding offal) | 6.9 | 6.7 | 6.3 | 9.8 | 7.3 | 1.4 |
| 030444 | fresh or chilled fillets of fish of the families | 7.3 | 7.1 | 8.9 | 9.7 | 6.9 | −1.4 |
| 160521 | shrimps and prawns, prepared or preserved, not in airtight containers (excluding smoked) | 4.5 | 5.0 | 5.1 | 4.7 | 5.8 | 6.6 |
|
Source: Global Trade Tracker, 2022 *CAGR: Compound Annual Growth Rate |
|||||||
| HS Code | Description | 2018 | 2019 | 2020 | 2021 | 2022 | CAGR* % 2018-2022 |
|---|---|---|---|---|---|---|---|
| Fish and Seafood Total | 631.4 | 594.2 | 597.3 | 670.7 | 545.7 | −3.6 | |
| 030731 | live, fresh or chilled, not smoked, mussels, with or without shell | 94.6 | 83.2 | 88.9 | 89.9 | 66.9 | −8.3 |
| 030441 | fresh or chilled fillets of pacific | 32.7 | 36.7 | 52.1 | 61.3 | 53.5 | 13.1 |
| 160529 | shrimps and prawns, prepared or preserved, in airtight containers (excluding smoked) | 50.6 | 40.2 | 41.1 | 42.0 | 30.4 | −12.0 |
|
Source: Global Trade Tracker, 2023 *CAGR: Compound Annual Growth Rate |
|||||||
| HS Code | Description | 2018 | 2019 | 2020 | 2021 | 2022 | CAGR* % 2018-2022 |
|---|---|---|---|---|---|---|---|
| Fish and Seafood Total | 128.8 | 113.1 | 113.7 | 111.5 | 170.2 | 7.2 | |
| 030617 | frozen shrimps and prawns, even smoked, whether in shell or not, including shrimps and prawns in shell, cooked by steaming or by boiling in water | 70.8 | 53.3 | 61.4 | 69.7 | 94.4 | 7.5 |
| 160521 | shrimps and prawns, prepared or preserved, not in airtight containers (excluding smoked) | 15.0 | 16.2 | 18.6 | 12.6 | 21.6 | 9.5 |
| 030462 | frozen fillets of catfish | 15.5 | 18.6 | 12.8 | 9.1 | 17.8 | 3.5 |
|
Source: Global Trade Tracker, 2023 *CAGR: Compound Annual Growth Rate |
|||||||
| HS Code | Description | 2018 | 2019 | 2020 | 2021 | 2022 | CAGR* % 2018-2022 |
|---|---|---|---|---|---|---|---|
| Fish and Seafood Total | 102.4 | 103.9 | 105.0 | 121.9 | 168.3 | 13.2 | |
| 030617 | frozen shrimps and prawns, even smoked, whether in shell or not, including shrimps and prawns in shell, cooked by steaming or by boiling in water (excluding cold-water shrimps and prawns) | 91.0 | 92.8 | 93.9 | 107.4 | 149.9 | 13.3 |
| 030743 | cuttle fish and squid, frozen, with or without shell | 3.6 | 3.4 | 4.1 | 5.6 | 6.1 | 14.1 |
| 160521 | shrimps and prawns, prepared or preserved, not in airtight containers (excluding smoked) | 5.5 | 5.4 | 5.5 | 6.0 | 5.9 | 1.8 |
|
Source: Global Trade Tracker, 2023 *CAGR: Compound Annual Growth Rate |
|||||||
| HS Code | Description | 2018 | 2019 | 2020 | 2021 | 2022 | CAGR* % 2018-2022 |
|---|---|---|---|---|---|---|---|
| Fish and Seafood Total | 220.6 | 194.9 | 175.8 | 229.1 | 159.9 | −7.7 | |
| 030441 | fresh or chilled fillets of pacific | 28.0 | 30.7 | 20.1 | 55.1 | 31.4 | 2.9 |
| 160420 | prepared or preserved fish (excluding whole or in pieces) | 12.0 | 9.9 | 10.5 | 11.3 | 7.7 | −10.5 |
| 030541 | smoked pacific salmon, including fillets (excluding offal) | 13.7 | 11.8 | 9.4 | 10.1 | 7.4 | −14.3 |
|
Source: Global Trade Tracker, 2023 *CAGR: Compound Annual Growth Rate |
|||||||
| HS Code | Description | 2018 | 2019 | 2020 | 2021 | 2022 | CAGR* % 2018-2022 |
|---|---|---|---|---|---|---|---|
| Fish and Seafood Total | 140.0 | 133.5 | 128.6 | 148.6 | 119.3 | −3.9 | |
| 160419 | prepared or preserved fish, whole or in pieces | 26.2 | 26.3 | 28.9 | 37.7 | 28.5 | 2.1 |
| 030541 | smoked pacific, including fillets (excluding offal) | 26.7 | 27.3 | 26.8 | 37.8 | 26.3 | −0.4 |
| 160414 | prepared or preserved tunas, skipjack and Atlantic bonito, whole or in pieces (excluding minced) | 20.5 | 18.8 | 21.8 | 18.3 | 15.8 | −6.3 |
|
Source: Global Trade Tracker, 2023 *CAGR: Compound Annual Growth Rate |
|||||||
Canada's performance
In 2022, Canada became Belgium's tenth largest supplier of fish and seafood. The total value of fish and seafood imports from Canada in 2022 was US$77.4 million, which represents a 14.5% increase in growth rate compared to the US$45 million registered in 2018. Additionally, the volume of fish and seafood imports from Canada also increased by 6.5%, from 2.9 million kilograms in 2018 to 3.6 million kilograms in 2022. The top three fish and seafood imports from Canada were live lobsters (HS: 030632), which amounted to US$32.5 million and 1.4 million kilograms; frozen lobsters (HS: 030612), which amounted to US$21 million and 0.9 million kilograms; and scallops (HS: 030722), which amounted to US$7.5 million and 0.2 million kilograms in 2022.The majority of lobsters sales is spread over a very short period of time, between Christmas and New Year.
| HS Code | Description | 2018 | 2019 | 2020 | 2021 | 2022 | CAGR* % 2018-2022 |
|---|---|---|---|---|---|---|---|
| Total - fish and seafood imports | 45.1 | 48.2 | 61.7 | 79.2 | 77.4 | 14.5 | |
| 030632 | lobsters "homarus spp.", whether in shell or not, live, fresh or chilled | 32.8 | 33.5 | 38.4 | 49.2 | 32.5 | −0.2 |
| 030612 | frozen lobsters "homarus spp.", even smoked, whether in shell or not, including lobsters in shell, cooked by steaming or by boiling in water | 8.4 | 8.6 | 10.0 | 19.0 | 21.0 | 25.7 |
| 030722 | scallops and other molluscs of the family pectinidae, frozen, even in shell | 0.0 | 3.2 | 10.4 | 3.8 | 7.5 | 32.8 (2019-2022) |
|
Source: Global Trade Tracker, 2023 *CAGR: Compound Annual Growth Rate |
|||||||
| HS Code | Description | 2018 | 2019 | 2020 | 2021 | 2022 | CAGR* % 2018-2022 |
|---|---|---|---|---|---|---|---|
| Total - fish and seafood imports | 2.8 | 2.8 | 3.5 | 3.4 | 3.6 | 6.5 | |
| 030632 | lobsters "homarus spp.", whether in shell or not, live, fresh or chilled | 1.7 | 1.7 | 2.1 | 1.9 | 1.4 | −4.7 |
| 030612 | frozen lobsters "homarus spp.", even smoked, whether in shell or not, including lobsters in shell, cooked by steaming or by boiling in water | 0.5 | 0.6 | 0.6 | 0.8 | 0.9 | 15.8 |
| 030722 | scallops and other molluscs of the family pectinidae, frozen, even in shell | 0.0 | 0.1 | 0.5 | 0.1 | 0.2 | 26.0 (2019-2022) |
|
Source: Global Trade Tracker, 2023 *CAGR: Compound Annual Growth Rate |
|||||||
Retail sales by category and distributionFootnote 2
The retail sales of fish and seafood in Belgium have seen a steady growth over the past few years. According to the provided data, the retail sales of fish and seafood in Belgium increased from $567.9 million in 2018 to $630.8 million in 2022, with a compound annual growth rate (CAGR) of 2.66%. The market is expected to continue its growth, with a forecasted retail sales value of $653.3 million in 2023 and $725.3 million in 2027, with a CAGR of 2.7% from 2023 to 2027.
The retail sales of crustaceans in Belgium increased from $34.4 million in 2018 to $37.0 million in 2022, reflecting a CAGR of 1.8%. The market is predicted to maintain its upward trajectory, with an estimated CAGR of 2.4% from 2022 to 2027. The retail sales value of crustaceans is projected to be $38.2 million in 2023 and $42.0 million in 2027.
Fish sales in Belgium grew at a CAGR of 2.6% from 2018 to 2022, with retail sales climbing from $363.5 million to $402.5 million. The fish market is expected to grow at a faster pace, with a projected CAGR of 3.4% from 2022 to 2027. The retail sales value of fish products is anticipated to be $420.0 million in 2023 and $479.1 million in 2027, suggesting that fish is the fastest-growing category of seafood in Belgium.
Molluscs and cephalopods in Belgium saw retail sales surge from $170.1 million in 2018 to $191.3 million in 2022, reflecting a CAGR of 2.98%. The market is expected to grow at a slower rate from 2023 to 2027, with a projected CAGR of 1.2%. The forecasted retail sales value for molluscs and cephalopods is $195.1 million in 2023 and $204.2 million in 2027.
In line with the health and sustainability trends, a growing number of Belgian consumers are trying to reduce their animal protein consumption. Some are actively trying to avoid animal protein for two or three days per week. This is having an impact on sales of processed meat and seafood, leading to a decline in volume sales in 2022, despite current retail value growth. The ongoing trend of reducing meat intake has led to a decrease in consumption of processed meat and seafood per capita.In addition, storytelling will be used as a tool to boost sales. With the sustainability trend rising, consumers increasingly want to know about the origin of the product and its ingredients and also whether the product is sustainable. Iglo, a Belgian producer of processed seafood, launched a campaign in 2021 called "Captain on board", which explains the story around Iglo products in terms of freshness, traceability and responsible fishing, with individual stories about real fishermen also giving realism and poignancy to the campaign.
Retail sales of processed seafood in Belgium have seen significant growth over the past few years, with a Compound Annual Growth Rate (CAGR) of 3.84% between 2018 and 2022. During this time period, the total retail sales of processed seafood increased from 447.7 million US dollars to 520.6 million US dollars and the forecast indicate that the market will continue to growth from 2023 to 2027 but the growth rate will decline due the mentioned reasons. All the three segments, Shelf Stable Seafood, Chilled Processed Seafood, Frozen Processed Seafood are following the same pattern.
| Category | 2018 | 2022 | CAGR* % 2018-2022 | 2023 | 2027 | CAGR* % 2022-2027 |
|---|---|---|---|---|---|---|
| Fish and Seafood | 567.9 | 630.8 | 2.7 | 653.3 | 725.3 | 2.7 |
| Crustaceans | 34.4 | 37.0 | 1.8 | 38.2 | 42.0 | 2.4 |
| Fish | 363.5 | 402.5 | 2.6 | 420.0 | 479.1 | 3.4 |
| Molluscs and Cephalopods | 170.1 | 191.3 | 3.0 | 195.1 | 204.2 | 1.2 |
| Processed Seafood | 447.7 | 520.6 | 3.9 | 531.7 | 579.7 | 2.2 |
| Shelf Stable Seafood | 207.3 | 242.4 | 4.0 | 247.4 | 268.4 | 2.1 |
| Chilled Processed Seafood | 80.5 | 91.7 | 3.3 | 93.0 | 100.0 | 1.7 |
| Frozen Processed Seafood | 159.9 | 186.5 | 3.9 | 191.3 | 211.3 | 2.5 |
|
Source: Euromonitor International, 2023 *CAGR: Compound Annual Growth Rate |
||||||
In 2022, the value of retail sales of processed meat and seafood in Belgium amounted to US$2.4 billion, with a growth rate of 3.1% from the 2018 value of US$2.1 billion. The primary distribution channel for these products was offline retail, specifically grocery retailers, which had a market value of US$2.32 billion in 2022, showing an increase in growth rate of 3.2% from the 2018 value of US$2.05 billion. This channel accounted for 96.7% of the market share, with supermarkets and discounters as the largest channels, accumulating a combined market share representation of 74% in 2022. Notably, discounters had a significant increase in growth rate of 7.3%.
In contrast, E-Commerce represented a smaller share of the market, accounting for only 3.3% in 2022. However, this channel showed a higher growth rate compared to offline retail.
| Outlet Type | 2018 | 2019 | 2020 | 2021 | 2022 | Share from total % 2022 | CAGR* % 2018-2022 |
|---|---|---|---|---|---|---|---|
| Retail Channels | 2,114.9 | 2,120.6 | 2,384.4 | 2,256.7 | 2,397.3 | 100.0 | 3.2 |
| Retail Offline | 2,048.8 | 2,056.9 | 2,303.0 | 2,176.8 | 2,317.7 | 96.7 | 3.1 |
| Grocery Retailers | 2,048.8 | 2,056.9 | 2,303.0 | 2,176.7 | 2,317.7 | 96.7 | 3.1 |
| Convenience Retail | 208.7 | 209.9 | 229.2 | 221.1 | 219.4 | 9.2 | 1.3 |
| Convenience Stores | 203.7 | 205.7 | 225.0 | 217.3 | 215.5 | 9.0 | 1.4 |
| Forecourt Retailers | 5.1 | 4.2 | 4.2 | 3.8 | 3.8 | 0.2 | −7.1 |
| Supermarkets | 1,205.5 | 1,206.6 | 1,353.8 | 1,255.2 | 1,335.9 | 55.7 | 2.6 |
| Hypermarkets | 170.4 | 173.9 | 173.7 | 167.5 | 166.7 | 7.0 | −0.5 |
| Discounters | 329.9 | 332.9 | 384.7 | 374.5 | 438.0 | 18.3 | 7.3 |
| Small Local Grocers | 134.2 | 133.6 | 161.6 | 158.4 | 157.7 | 6.6 | 4.1 |
| Retail E-Commerce | 66.1 | 63.6 | 81.4 | 79.9 | 79.6 | 3.3 | 4.8 |
|
Source: Euromonitor International, 2023 1: Distribution channels for fish and seafood and processed seafood not available *CAGR: Compound Annual Growth Rate Processed meat and seafood (as defined by Euromonitor International): processed meat, processed seafood and meat substitutes (includes all types of chilled, frozen and shelf stable meat and fish substitutes such as vegetarian sausages, vegetarian burgers, bean burgers, vegetarian fish filets etc. typically made of quorn mycoprotein, tofu, soy or texturized vegetable protein). |
|||||||
Competitive landscape
The processed seafood retail market in Belgium was dominated by private labels (62.5%) in comparison to brand labels, which represented 37.5% of the market share in 2022. Private label lines such as Colruyt, Delhaize and Carrefour will continue to dominate processed seafood. Colruyt and Carrefour Belgium had retail sales of US$77.8 million and US$72.3 million respectively of processed seafood in all formats representing a 28.8% market share in 2022.
Shelf Stable Seafood was the largest category within processed seafood with 46.6% market share and retail sales of US$ 242.4 million in 2022. Sopralex & Vosmarques was the largest Shelf Stable Seafood company (together with the private label retailer Colruyt) and had retail sales valued at US$54.7 million. Iglo Belgium offers branded frozen products and experienced 4.3% growth and retail sales with US$33.0 million in 2022.
A measure of market competitiveness is the Herfindahl-Hirschman Index (HHI). An HHI of less than 1,500 is considered a competitive market, 1,500 to 2,500 is a moderately concentrated market, and 2,500 or greater is a highly concentrated market. HH index for processed seafood market was 777.2 which shows that the market is competitive and no company is dominant in this market. Between the market segments, Chilled Processed Seafood has the highest HH index which indicates that this market is moderately concentrated compared to others.
| Category | Company | 2018 | 2019 | 2020 | 2021 | 2022 | CAGR* % 2018-2022 | Market share % 2022 |
|---|---|---|---|---|---|---|---|---|
| Processed Seafood | Etn Franz Colruyt NV | 66.9 | 68.3 | 75.7 | 73.6 | 77.8 | 3.8 | 14.9 |
| Carrefour Belgium SA/NV | 63.5 | 63.2 | 70.9 | 68.9 | 72.3 | 3.3 | 13.9 | |
| Delhaize 'Le Lion' SA | 60.9 | 60.9 | 67.7 | 65.8 | 69.3 | 3.3 | 13.3 | |
| Sopralex & Vosmarques SA | 47.0 | 48.3 | 55.3 | 52.9 | 54.7 | 3.9 | 10.5 | |
| Iglo Belgium SA | 27.9 | 28.4 | 32.1 | 31.4 | 33.0 | 4.3 | 6.3 | |
| Total Private Label | 284.0 | 285.9 | 318.4 | 309.6 | 325.8 | 3.5 | 15.1 | |
| Total | 447.7 | 451.2 | 504.6 | 490.7 | 520.6 | 3.8 | 100.0 | |
| HH Index | 787.7 | 797.1 | 799.7 | 795.4 | 777.2 | |||
| Shelf Stable Seafood | Sopralex & Vosmarques SA | 47.0 | 48.3 | 55.3 | 52.9 | 54.7 | 3.9 | 22.6 |
| Etn Franz Colruyt NV | 27.7 | 28.6 | 31.9 | 30.8 | 32.7 | 4.2 | 13.5 | |
| Carrefour Belgium SA/NV | 21.9 | 21.8 | 24.6 | 23.7 | 25.0 | 3.4 | 10.3 | |
| Total Private Label | 127.3 | 127.8 | 143.1 | 138.7 | 150.6 | 4.3 | 17.3 | |
| Total | 207.3 | 209.0 | 236.3 | 227.7 | 242.4 | 4.0 | 100.0 | |
| HH Index | 972.3 | 993.3 | 1,003.8 | 993.0 | 955.6 | |||
| Chilled Processed Seafood | Delhaize 'Le Lion' SA | 18.5 | 18.6 | 20.7 | 20.1 | 21.0 | 3.2 | 22.9 |
| Carrefour Belgium SA/NV | 16.4 | 16.4 | 18.4 | 17.9 | 18.7 | 3.3 | 20.4 | |
| Etn Franz Colruyt NV | 15.6 | 15.9 | 17.6 | 17.1 | 17.9 | 3.5 | 19.5 | |
| Total Private Label | 64.2 | 65.0 | 72.0 | 70.0 | 73.3 | 3.4 | 17.1 | |
| Total | 80.5 | 81.5 | 90.3 | 87.9 | 91.7 | 3.3 | 100.0 | |
| HH Index | 1,419.0 | 1,410.3 | 1,394.6 | 1,410.9 | 1,404.6 | |||
| Frozen Processed Seafood | Iglo Belgium SA | 27.9 | 28.4 | 32.1 | 31.4 | 33.0 | 4.3 | 15.4 |
| Carrefour Belgium SA/NV | 25.2 | 25.0 | 27.9 | 27.3 | 28.7 | 3.3 | 14.6 | |
| Etn Franz Colruyt NV | 23.6 | 23.9 | 26.2 | 25.7 | 27.2 | 3.6 | 14.3 | |
| Total Private Label | 115.1 | 115.1 | 127.2 | 124.6 | 131.4 | 3.4 | 11.2 | |
| Total | 159.9 | 160.7 | 178.0 | 175.1 | 186.5 | 3.9 | 100.0 | |
| HH Index | 1,092.4 | 1,093.9 | 1,103.2 | 1,092.2 | 1,069.4 | |||
|
Source: Euromonitor International, 2023 1: Data for fish and seafood not available *CAGR: Compound Annual Growth Rate |
||||||||
Brands Labeyrie (Lur Berri Coopérative Agricole) and Petit Navire (Thai Union Frozen Products PCL) were the two largest in processed seafood with an 8.1% and 7.8% market share in 2020. The brand Findus from Nomad Foods Ltd, experienced the largest growth rate of 3.6% as its market share percentage increased from 4.0% in 2016 to 4.6% in 2020.
| Category | Brand | 2018 | 2019 | 2020 | 2021 | 2022 | CAGR* % 2018-2022 |
|---|---|---|---|---|---|---|---|
| Processed Seafood | Colruyt (Private Label) | 66.9 | 68.3 | 75.7 | 73.6 | 77.8 | 3.8 |
| Carrefour (Private Label) | 63.5 | 63.2 | 70.9 | 68.9 | 72.3 | 3.3 | |
| Delhaize (Private Label) | 60.9 | 60.9 | 67.7 | 65.8 | 69.3 | 3.3 | |
| Imperial (Sopralex & Vosmarques SA) | 47.0 | 48.3 | 55.3 | 52.9 | 54.7 | 3.9 | |
| Iglo (Nomad Foods Ltd) | 27.9 | 28.4 | 32.1 | 31.4 | 33.0 | 4.3 | |
| Other Private Label (Private Label) | 68.0 | 69.0 | 76.9 | 74.6 | 78.5 | 3.7 | |
| Others | 37.9 | 37.4 | 41.0 | 41.1 | 50.3 | 7.3 | |
| Total | 447.7 | 451.2 | 504.6 | 490.7 | 520.6 | 3.8 | |
| Shelf Stable Seafood | Imperial (Sopralex & Vosmarques SA) | 47.0 | 48.3 | 55.3 | 52.9 | 54.7 | 3.9 |
| Colruyt (Private Label) | 27.7 | 28.6 | 31.9 | 30.8 | 32.7 | 4.2 | |
| Carrefour (Private Label) | 21.9 | 21.8 | 24.6 | 23.7 | 25.0 | 3.4 | |
| Other Private Label (Private Label) | 36.0 | 36.5 | 41.4 | 39.9 | 42.0 | 3.9 | |
| Others | 22.6 | 22.0 | 23.9 | 23.7 | 29.3 | 6.7 | |
| Total | 207.3 | 209.0 | 236.3 | 227.7 | 242.4 | 4.0 | |
| Chilled Processed Seafood | Delhaize (Private Label) | 18.5 | 18.6 | 20.7 | 20.1 | 21.0 | 3.2 |
| Carrefour (Private Label) | 16.4 | 16.4 | 18.4 | 17.9 | 18.7 | 3.3 | |
| Colruyt (Private Label) | 15.6 | 15.9 | 17.6 | 17.1 | 17.9 | 3.5 | |
| Other Private Label (Private Label) | 13.7 | 14.1 | 15.3 | 14.9 | 15.7 | 3.5 | |
| Others | 2.7 | 2.7 | 3.0 | 3.1 | 3.7 | 8.2 | |
| Total | 80.5 | 81.5 | 90.3 | 87.9 | 91.7 | 3.3 | |
| Frozen Processed Seafood | Iglo (Nomad Foods Ltd) | 27.9 | 28.4 | 32.1 | 31.4 | 33.0 | 4.3 |
| Carrefour (Private Label) | 25.2 | 25.0 | 27.9 | 27.3 | 28.7 | 3.3 | |
| Colruyt (Private Label) | 23.6 | 23.9 | 26.2 | 25.7 | 27.2 | 3.6 | |
| Other Private Label (Private Label) | 18.3 | 18.4 | 20.1 | 19.8 | 20.9 | 3.4 | |
| Others | 12.3 | 12.4 | 13.8 | 14.1 | 17.0 | 8.4 | |
| Total | 159.9 | 160.7 | 178.0 | 175.1 | 186.5 | 3.9 |
New product launch analysis
According to Mintel's Global New Products Database (GNPD), there were 3,836 fish and fish products as an ingredient launched in Belgium between January 2016 and December 2020. Of those fish products released, 3,336 were food products, 499 were pet products and 1 was released as a beverage product.
In terms of new product launches containing fish and fish products as an ingredient, 2016 and 2017 had the highest product launches, 866 and 825 respectively. The top sub-categories of products offered were fish products, prepared meals and hors d'oeuvres. Top claims (may contain more than one claim per package) were ethical-environmentally friendly packages, ethical-recycling and ethical-sustainable (habitat/resources). Top package types were tray, can and flexible formats and launched primarily as new variety/range extensions and new packaging.
| Product attributes | Yearly launch counts | Total | ||||
|---|---|---|---|---|---|---|
| 2018 | 2019 | 2020 | 2021 | 2022 | ||
| Yearly product launches | 85 | 94 | 106 | 66 | 84 | 435 |
| Top five sub-categories | ||||||
| Fish Products | 39 | 52 | 50 | 37 | 48 | 226 |
| Cat Food Wet | 14 | 9 | 15 | 3 | 5 | 46 |
| Prepared Meals | 5 | 3 | 5 | 8 | 8 | 29 |
| Cat Snacks & Treats | 3 | 4 | 3 | 6 | 8 | 24 |
| Hors d'oeuvres/Canapes | 9 | 4 | 6 | 0 | 1 | 20 |
| Top five claims | ||||||
| Ethical - Sustainable | 28 | 43 | 36 | 28 | 49 | 184 |
| Ethical - Environmentally Friendly | 24 | 44 | 36 | 27 | 48 | 179 |
| No Additives/Preservatives | 11 | 19 | 26 | 10 | 19 | 85 |
| Ethical - Environmentally Friendly Package | 12 | 11 | 24 | 16 | 20 | 83 |
| Not Specified | 15 | 9 | 19 | 18 | 12 | 73 |
| Imported status | ||||||
| Imported | 22 | 17 | 30 | 5 | 7 | 81 |
| Not imported | 4 | 1 | 9 | 2 | 2 | 18 |
| Top packaged types | ||||||
| Tray | 32 | 36 | 29 | 24 | 33 | 154 |
| Can | 11 | 22 | 23 | 7 | 11 | 74 |
| Flexible stand-up pouch | 12 | 12 | 13 | 1 | 10 | 48 |
| Flexible | 7 | 9 | 7 | 4 | 11 | 38 |
| Tub | 7 | 4 | 12 | 9 | 5 | 37 |
| Top launch types | ||||||
| New Variety/Range Extension | 46 | 53 | 55 | 36 | 39 | 229 |
| New Product | 33 | 29 | 35 | 20 | 26 | 143 |
| New Packaging | 3 | 8 | 12 | 8 | 15 | 46 |
| New Formulation | 1 | 2 | 3 | 2 | 1 | 9 |
| Relaunch | 2 | 2 | 1 | 0 | 3 | 8 |
| Top five flavours (including blend) | ||||||
| Unflavoured/Plain | 18 | 27 | 26 | 16 | 32 | 119 |
| Salmon | 10 | 5 | 10 | 4 | 9 | 38 |
| Smoke | 4 | 2 | 6 | 4 | 2 | 18 |
| Tuna | 2 | 5 | 6 | 3 | 1 | 17 |
| Chicken | 2 | 3 | 7 | 1 | 3 | 16 |
| Top five ingredients | ||||||
| Fish and Fish Products (Food) | 25 | 25 | 41 | 15 | 23 | 129 |
| Salmon (Food) | 23 | 18 | 27 | 15 | 14 | 97 |
| Atlantic Salmon (Food) | 14 | 5 | 16 | 10 | 10 | 55 |
| Tuna (Food) | 6 | 15 | 14 | 7 | 5 | 47 |
| Shrimp (Food) | 8 | 14 | 8 | 5 | 4 | 39 |
| Source: Mintel, 2023 | ||||||
Examples of new product launches
Shrimp Crown with Cocktail Sauce
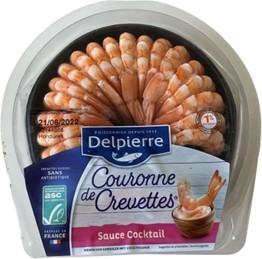
| Company | Delpierre |
|---|---|
| Brand | Delpierre |
| Sub-category | Fish products |
| Market | Belgium |
| Location of manufacture | France |
| Store type | Mass merchandise / hypermarket |
| Date published | July 2022 |
| Product source | Shopper |
| Price in US dollars | 6.80 |
Delpierre Couronne de Crevettes avec Sauce Cocktail (Shrimp Crown with Cocktail Sauce) has been repackaged with a new design. The product is made in Loire-Atlantique, France and comprises shrimps grown without the use of antibiotics. It retails in a 130 gram pack bearing the ASC logo. The manufacturer claims to donate 1% of their profits to the preservation of aquatic resources.
Classics Style Mussels in Sauce with Thyme & Rosemary
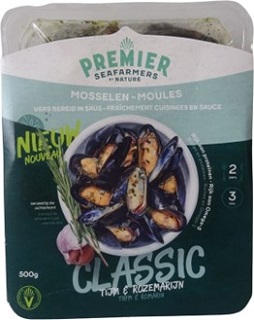
| Company | Krijn Verwijs Yerseke |
|---|---|
| Brand | Premier Seafarmers by Nature |
| Sub-category | Fish products |
| Store type | Supermarket |
| Date published | September 2022 |
| Launch type | New product |
| Price in US dollars | 5.00 |
Premier Seafarmers by Nature Moules Style Classiques en Sauce au Thym & Romarin (Classics Style Mussels in Sauce with Thyme & Rosemary) are now available and retail in a 500 gram pack. - Freshly cooked in sauce- Rich in protein and omega-3 - Serve two - Ready in three minutes - Sustainably harvested by the Holmyard family - Microwavable- Gluten free - Recyclable pack - Bear cooking instructions - Logos and certifications: EU Organic, QR code
Smoked Norway Salmon
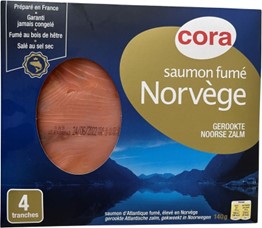
| Company | Cora |
|---|---|
| Brand | Cora |
| Sub-category | Fish products |
| Store type | Mass merchandise / hypermarket |
| Date published | July 2022 |
| Launch type | New variety / range extension |
| Price in US dollars | 4.90 |
Cora Saumon Fumé Norvège (Smoked Norway Salmon) has been added to the range. The salmon is raised in the cold and deep waters of Norway, where the intact and protective surrounding nature is said to give it all its nutritional and flavour qualities. The purity of these waters, perpetually cooled and renewed by the melting snow and sea currents, is said to provide an exceptional quality of flesh. The salmon receives a healthy and balanced diet based on fish and vegetables. This product is prepared in France and guaranteed never frozen. It is beechwood smoked and dry salted. It retails in a 140 gram partially recyclable pack containing four slices.
Opportunities for Canada
Belgium ranked as the nineteenth largest market for fish and seafood in the world, accounting for 1.2% of the market value share with total imports of US$2.4 billion (308.7 million kilograms) in 2022. The country experienced a stable import growth rate with a CAGR of 0.01% from 2018.
Canada has seen a significant increase in its fish and seafood exports to Belgium in recent years, with a CAGR of 14.5% from 2018 to 2022. The total imports of fish and seafood from Canada to Belgium have increased steadily from $45.1 to $77.4 millions, demonstrating the growing demand for Canadian fish and seafood products in Belgium. Frozen lobsters (HS: 030612) and live lobsters (HS: 030632) were among the top exports from Canada to Belgium, with a growth rate of 25.7% and a slight decline of −0.2%, respectively. Additionally, the exports of scallops and other molluscs (HS: 030722) from Canada to Belgium have experienced an impressive growth rate of 32.8% from 2019 to 2022. These figures indicate that Canada's fish and seafood industry is establishing itself as a key supplier of high-quality and safe products to the Belgian market.
CETA also represents an excellent opportunity for Canadian fish and seafood exporters. When CETA entered into force in 2017, almost 96% of Canadian fish and seafood could be exported to the EU duty free. Duty rates have been progressively falling on the remaining products and as of January 1, 2024 all Canadian origin fish and seafood products will be duty free.
For additional information on CETA, Canadian exporters should consult:
- The Comprehensive Economic and Trade Agreement (CETA)
- Opportunities and Benefits of CETA for Canada's Fish and Seafood Exporters
- The Canada Tariff Finder will help you determine tariff information for the CETA market, and other countries with which Canada has a free trade agreement.
For more information
The Canadian Trade Commissioner Service:
International Trade Commissioners can provide Canadian industry with on-the-ground expertise regarding market potential, current conditions and local business contacts, and are an excellent point of contact for export advice.
More agri-food market intelligence:
International agri-food market intelligence
Discover global agriculture and food opportunities, the complete library of Global Analysis reports, market trends and forecasts, and information on Canada's free trade agreements.
Agri-food market intelligence service
Canadian agri-food and seafood businesses can take advantage of a customized service of reports and analysis, and join our email subscription service to have the latest reports delivered directly to their inbox.
More on Canada's agriculture and agri-food sectors:
Canada's agriculture sectors
Information on the agriculture industry by sector. Data on international markets. Initiatives to support awareness of the industry in Canada. How the department engages with the industry.
For additional information on the upcoming trade show Seafood Expo Global, please contact:
Ben Berry, Deputy Director
Trade Show Strategy and Delivery
Agriculture and agri-food Canada
ben.berry@agr.gc.ca
Resources
- Euromonitor International, 2023
- Global Trade Tracker, 2023
- Mintel Global New Products Database, 2023
Sector Trend Analysis – Fish and seafood trends in Belgium
Global Analysis Report
Prepared by: Rouzbeh Parsi, Student (co-op)
© His Majesty the King in Right of Canada, represented by the Minister of Agriculture and Agri-Food (2023).
Photo credits
All photographs reproduced in this publication are used by permission of the rights holders.
All images, unless otherwise noted, are copyright His Majesty the King in Right of Canada.
To join our distribution list or to suggest additional report topics or markets, please contact:
Agriculture and Agri-Food Canada, Global Analysis1341 Baseline Rd, Tower 5, 3rd floor
Ottawa ON K1A 0C5
Canada
Email: aafc.mas-sam.aac@agr.gc.ca
The Government of Canada has prepared this report based on primary and secondary sources of information. Although every effort has been made to ensure that the information is accurate, Agriculture and Agri-Food Canada (AAFC) assumes no liability for any actions taken based on the information contained herein.
Reproduction or redistribution of this document, in whole or in part, must include acknowledgement of agriculture and agri-food Canada as the owner of the copyright in the document, through a reference citing AAFC, the title of the document and the year. Where the reproduction or redistribution includes data from this document, it must also include an acknowledgement of the specific data source(s), as noted in this document.
Agriculture and Agri-Food Canada provides this document and other report services to agriculture and food industry clients free of charge.