

Note: This report includes forecasting data that is based on baseline historical data.
Executive summary
The global seafood market has grown at a compound annual growth rate (CAGR) of 3.5% between 2018 and 2022, with Korea's seafood market experiencing a 2.8% CAGR during the same period. Russia and China are the top suppliers of seafood to South Korea, contributing 21.6% and 18.7% of the market share, respectively. Notable imports include frozen Alaska pollack and frozen shrimps and prawns, with CAGRs of 14.8% and 6.4%, respectively.
Canada's seafood exports to South Korea have seen mixed results, with the total value growing at a 2.6% CAGR between 2018 and 2022 and frozen lobsters experiencing a significant 18.0% CAGR in value. In terms of volume, Canada's seafood imports have grown at a 6.5% CAGR, with frozen lobsters and cuttle fish/squid showing strong growth.
Retail sales of fish, seafood, and processed seafood in South Korea have grown between 2018 and 2022, with the overall market growing at a 4.8% CAGR. Crustaceans have experienced the highest growth, at a 5.9% CAGR. The forecast for 2022 to 2027 predicts continued growth across all categories, with the overall fish and seafood market expected to grow at a 4.9% CAGR, reaching $6,086.7 million in 2027.
South Korea's processed seafood industry is dominated by a few major companies, with Dongwon F&B Co., Ltd., CJ CheilJedang Corporation, and Sajo Daerim Corporation leading the market. The top brands in the processed seafood market include Dongwon, Daerim and CJ. Dongwon experienced modest growth, while Daerim and CJ faced declines.
Between 2018 and 2022, South Korea experienced a steady number of new product launches in the fish and fish products market. The top five categories of product launches were Processed Fish, Meat & Egg Products, Meals & Meal Centers, Snacks, Sauces and sSeasonings, and Soup, with Convenience being the top claim.
Trade overview
The overall seafood market has grown at a CAGR of 3.5% from 2018 to 2022, reaching a total market size of 187.0 in 2022. From 2018 to 2022, Korea's seafood market has been the seventh biggest market in the world and has witnessed a stable growth during this period. The CAGR of Korea's seafood market was 2.8%, expanding the market's size from 6.1 in 2018 to 6.8 in 2022.
| Country | 2018 | 2019 | 2020 | 2021 | 2022 | CAGR* % 2018-2022 | Market share % 2022 |
|---|---|---|---|---|---|---|---|
| World | 162.7 | 160.7 | 148.9 | 172.1 | 187.0 | 3.5 | 100.0 |
| United States | 24.0 | 23.5 | 23.0 | 30.2 | 32.4 | 7.8 | 17.3 |
| China | 14.7 | 18.4 | 15.2 | 17.7 | 23.3 | 12.2 | 12.5 |
| Japan | 15.8 | 15.6 | 13.6 | 14.4 | 15.4 | −0.6 | 8.2 |
| Spain | 8.7 | 8.2 | 7.4 | 8.9 | 9.6 | 2.5 | 5.1 |
| France | 7.2 | 6.8 | 6.5 | 7.9 | 8.3 | 3.6 | 4.4 |
| Italy | 7.1 | 6.7 | 6.2 | 7.5 | 7.8 | 2.4 | 4.2 |
| Korea (Republic of) | 6.1 | 5.7 | 5.5 | 6.0 | 6.8 | 2.8 | 3.6 |
| Germany | 6.2 | 6.0 | 6.1 | 6.1 | 6.5 | 1.2 | 3.5 |
| Sweden | 5.6 | 5.3 | 5.1 | 5.6 | 6.1 | 2.2 | 3.3 |
| Netherlands | 4.5 | 4.5 | 4.6 | 5.2 | 5.6 | 5.6 | 3.0 |
|
Source: Global Trade Tracker, 2022 *CAGR: Compound Annual Growth Rate |
|||||||
The following table displays the top 10 global suppliers of fish and seafood to Korea in US$ million over the past five years. The figures reveal that the global supply of fish and seafood to Korea increased at a CAGR of 3.0%, reaching US$6,809.3 million in 2022. Russia emerged as the largest supplier, with a market share of 21.6% and US$1,471.6 million in 2022, followed by China with a market share of 18.7%. Norway, with a CAGR of 10.5%, experienced the fastest growth rate, reaching US$613.2 million in 2022. Meanwhile, Canada placed tenth on the list with a market share of 2.0% and a CAGR of 2.7%.
| Country | 2018 | 2019 | 2020 | 2021 | 2022 | CAGR* % 2018-2022 | Market share % 2022 |
|---|---|---|---|---|---|---|---|
| World | 6,060.9 | 5,718.2 | 5,537.8 | 6,040.0 | 6,809.3 | 3.0 | |
| Russia | 941.9 | 955.8 | 973.3 | 1,258.5 | 1,471.6 | 11.8 | 21.6 |
| China | 1,473.4 | 1,299.0 | 1,219.4 | 1,242.8 | 1,272.3 | −3.6 | 18.7 |
| Vietnam | 856.9 | 801.5 | 754.2 | 807.5 | 939.0 | 2.3 | 13.8 |
| Norway | 411.1 | 421.7 | 430.9 | 576.0 | 613.2 | 10.5 | 9.0 |
| United States | 276.3 | 267.7 | 227.4 | 234.9 | 243.1 | −3.1 | 3.6 |
| Peru | 173.0 | 216.6 | 203.8 | 165.4 | 226.7 | 7.0 | 3.3 |
| Japan | 148.1 | 136.0 | 129.0 | 164.3 | 187.7 | 6.1 | 2.8 |
| Chile | 199.9 | 132.4 | 149.3 | 119.8 | 175.7 | −3.2 | 2.6 |
| Thailand | 179.8 | 142.7 | 153.3 | 194.9 | 174.1 | −0.8 | 2.6 |
| Canada | 119.3 | 120.0 | 93.8 | 113.3 | 132.8 | 2.7 | 2.0 |
|
Source: Global Trade Tracker, 2022 *CAGR: Compound Annual Growth Rate |
|||||||
In 2018, the total import of fish and seafood to South Korea was 1,557.9 million kilograms, which further rose to 1,713.2 million kilograms in 2022, exhibiting a CAGR of 2.4% during that period.
| Country | 2018 | 2019 | 2020 | 2021 | 2022 | CAGR* % 2018-2022 | Market share % 2022 |
|---|---|---|---|---|---|---|---|
| World | 1,557.9 | 1,530.9 | 1,536.4 | 1,652.8 | 1,713.2 | 2.4 | |
| Russia | 302.1 | 252.1 | 312.8 | 489.7 | 546.3 | 16.0 | 31.9 |
| China | 487.0 | 469.7 | 449.1 | 376.3 | 377.3 | −6.2 | 22.0 |
| Vietnam | 178.0 | 180.4 | 171.8 | 171.5 | 179.2 | 0.2 | 10.5 |
| Norway | 69.4 | 69.8 | 74.2 | 93.9 | 84.0 | 4.9 | 4.9 |
| Mexico | 18.8 | 37.1 | 35.1 | 47.3 | 67.6 | 37.7 | 3.9 |
| United States | 86.1 | 76.7 | 74.1 | 73.0 | 63.8 | −7.2 | 3.7 |
| Chile | 66.2 | 47.2 | 62.4 | 59.3 | 61.0 | −2.0 | 3.6 |
| Peru | 43.3 | 71.9 | 67.6 | 64.0 | 59.7 | 8.4 | 3.5 |
| Japan | 34.8 | 32.8 | 30.1 | 32.4 | 37.7 | 2.0 | 2.2 |
| Taiwan | 44.2 | 43.5 | 24.0 | 31.2 | 25.1 | −13.2 | 1.5 |
| Canada(18th) | 7.2 | 7.2 | 6.7 | 6.9 | 7.3 | 0.3 | 0.4 |
|
Source: Global Trade Tracker, 2022 *CAGR: Compound Annual Growth Rate |
|||||||
Among the top 10 imported seafood products, frozen Alaska pollack (HS Code 030367) stands out as the fastest-growing item, with a remarkable 14.8% CAGR over the period. The value of Alaska pollack imports rose from $203.3 million in 2018 to $352.7 million in 2022. Frozen shrimps and prawns (HS Code 030617) continue to be the largest imported product, increasing at a 6.4% CAGR and reaching a value of $591.8 million in 2022. Other notable imports include fresh or chilled Atlantic salmon and Danube salmon, with a 9.5% CAGR, and frozen fillets of tuna (HS Code 030487), with an 11.9% CAGR. However, some imported seafood products experienced a decline, such as frozen octopus (HS Code 030752), with a −1.6% CAGR, and frozen fish (HS Code 030389), with a −7.8% CAGR.
| HS Code | Description | 2018 | 2019 | 2020 | 2021 | 2022 | CAGR* % 2018-2022 |
|---|---|---|---|---|---|---|---|
| Fish and Seafood Total | 6,059.7 | 5,717.0 | 5,538.0 | 6,039.0 | 6,809.0 | 3.0 | |
| 030617 | frozen shrimps and prawns, even smoked, whether in shell or not, including shrimps and prawns in shell, cooked by steaming or by boiling in water | 460.9 | 450.2 | 441.7 | 501.6 | 591.8 | 6.4 |
| 030633 | crabs, whether in shell or not, live, fresh or chilled | 363.7 | 409.8 | 410.7 | 457.0 | 425.4 | 4.0 |
| 030752 | octopus "octopus spp.", frozen | 446.1 | 369.4 | 349.3 | 390.3 | 417.6 | −1.6 |
| 030389 | frozen fish, nowhere else specified | 515.2 | 467.8 | 431.8 | 393.0 | 371.6 | −7.8 |
| 030367 | frozen Alaska pollack "theragra chalcogramma" | 203.3 | 150.7 | 195.2 | 257.6 | 352.7 | 14.8 |
| 030214 | fresh or chilled Atlantic salmon "salmo salar" and Danube salmon "hucho hucho" | 217.4 | 228.3 | 227.2 | 305.3 | 312.9 | 9.5 |
| 030743 | cuttle fish and squid, frozen, with or without shell | 354.4 | 308.0 | 349.9 | 258.7 | 274.5 | −6.2 |
| 160521 | shrimps and prawns, prepared or preserved, not in airtight containers (excluding smoked) | 179.7 | 169.3 | 161.0 | 195.1 | 212.1 | 4.2 |
| 030487 | frozen fillets of tuna "of the genus thunnus", skipjack or stripe-bellied bonito "euthynnus [katsuwonus] pelamis" | 132.4 | 129.6 | 145.1 | 147.4 | 207.8 | 11.9 |
| 030199 | live fish, eels, carp, Atlantic and Pacific bluefin tuna and southern bluefin tuna | 196.3 | 179.7 | 150.5 | 190.1 | 199.2 | 0.4 |
|
Source: Global Trade Tracker, 2022 *CAGR: Compound Annual Growth Rate |
|||||||
| HS Code | Description | 2018 | 2019 | 2020 | 2021 | 2022 | CAGR* % 2018-2022 |
|---|---|---|---|---|---|---|---|
| Fish and Seafood Total | 1,557.90 | 1,530.60 | 1,536.10 | 1,652.70 | 1,712.60 | 2.4 | |
| 030367 | frozen Alaska pollack | 196.3 | 129.1 | 159.8 | 263.2 | 323.8 | 13.3 |
| 030389 | frozen fish | 230.6 | 217.2 | 212.8 | 155.1 | 155.6 | −9.4 |
| 030499 | frozen fish meat | 116.7 | 101.1 | 108.0 | 102.8 | 114.8 | −0.4 |
| 030743 | cuttle fish and squid, frozen, with or without shell | 117.2 | 107.4 | 125.5 | 104.8 | 106.6 | −2.3 |
| 030617 | frozen shrimps and prawns, even smoked, whether in shell or not, including shrimps and prawns in shell, cooked by steaming or by boiling in water | 55.0 | 56.9 | 57.3 | 61.4 | 68.0 | 5.4 |
| 230120 | flours, meals and pellets of fish or crustaceans, molluscs or other aquatic invertebrates, unfit for human consumption | 51.5 | 53.6 | 55.2 | 69.6 | 67.0 | 6.8 |
| 030752 | octopus "octopus spp.", frozen | 62.7 | 55.3 | 56.1 | 57.6 | 58.0 | −1.9 |
| 030353 | frozen sardines | 10.8 | 29.5 | 67.7 | 75.8 | 57.9 | 52.2 |
| 030354 | frozen mackerel | 41.1 | 42.0 | 45.5 | 53.5 | 50.8 | 5.4 |
| 030312 | frozen pacific salmon | 4.0 | 5.4 | 6.7 | 22.4 | 42.1 | 80.1 |
|
Source: Global Trade Tracker, 2022 *CAGR: Compound Annual Growth Rate |
|||||||
| HS Code | Description | 2018 | 2019 | 2020 | 2021 | 2022 | CAGR* % 2018-2022 |
|---|---|---|---|---|---|---|---|
| Fish and Seafood Total | 942.0 | 955.8 | 972.8 | 1,258.0 | 1,471.2 | 11.79 | |
| 030633 | crabs, whether in shell or not, live, fresh or chilled | 317.9 | 375.1 | 373.5 | 413.7 | 401.6 | 6.02 |
| 030367 | frozen Alaska pollack "theragra chalcogramma" | 195.8 | 140.6 | 180.9 | 247.5 | 343.8 | 15.11 |
| 030391 | frozen fish livers, roes and milt | 84.5 | 84.5 | 72.7 | 94.5 | 115.9 | 8.22 |
|
Source: Global Trade Tracker, 2022 *CAGR: Compound Annual Growth Rate |
|||||||
| HS Code | Description | 2018 | 2019 | 2020 | 2021 | 2022 | CAGR* % 2018-2022 |
|---|---|---|---|---|---|---|---|
| Fish and Seafood Total | 1,473.4 | 1,299.1 | 1,219.1 | 1,242.7 | 1,271.9 | −3.6 | |
| 030389 | frozen fish | 280.5 | 243.1 | 193.2 | 186.1 | 170.3 | −11.7 |
| 030751 | octopus "octopus spp.", live, fresh or chilled | 122.6 | 118.6 | 120.7 | 127.2 | 125.6 | 0.6 |
| 030752 | octopus "octopus spp.", frozen | 163.3 | 104.8 | 98.0 | 109.2 | 112.7 | −8.8 |
|
Source: Global Trade Tracker, 2022 *CAGR: Compound Annual Growth Rate |
|||||||
| HS Code | Description | 2018 | 2019 | 2020 | 2021 | 2022 | CAGR* % 2018-2022 |
|---|---|---|---|---|---|---|---|
| Fish and Seafood Total | 857.1 | 801.8 | 754.1 | 807.2 | 938.8 | −3.6 | |
| 030617 | frozen shrimps and prawns, even smoked, whether in shell or not, including shrimps and prawns in shell, cooked by steaming or by boiling in water | 246.2 | 216.3 | 211.4 | 236.3 | 290.0 | 2.3 |
| 030752 | octopus "octopus spp.", frozen | 186.9 | 172.4 | 169.7 | 193.2 | 188.9 | 4.2 |
| 160521 | shrimps and prawns, prepared or preserved, not in airtight containers | 129.3 | 126.6 | 117.0 | 129.4 | 150.9 | 0.3 |
|
Source: Global Trade Tracker, 2022 *CAGR: Compound Annual Growth Rate |
|||||||
Canada's performance
Canada's seafood exports to South Korea have seen mixed results over the years. In terms of value, total fish and seafood imports from Canada increased at a CAGR of 2.6% between 2018 and 2022, growing from $119.4 million to $132.7 million. The star performer in this category has been frozen lobsters (Homarus spp.), which experienced a significant 18.0% CAGR, increasing in value from $34.4 million in 2018 to $66.8 million in 2022. In contrast, live, fresh or chilled lobsters (Homarus spp.) experienced a decline of 7.6% in CAGR over the same period, reducing its value from $67.8 million to $49.4 million.
| HS Code | Description | 2018 | 2019 | 2020 | 2021 | 2022 | CAGR* % 2018-2022 |
|---|---|---|---|---|---|---|---|
| Total - fish and seafood imports | 119.4 | 120.0 | 93.7 | 113.4 | 132.7 | 2.6 | |
| 030612 | frozen lobsters "homarus spp.", even smoked, whether in shell or not, including lobsters in shell, cooked by steaming or by boiling in water | 34.4 | 47.6 | 31.1 | 40.3 | 66.8 | 18.0 |
| 030632 | lobsters "homarus spp.", whether in shell or not, live, fresh or chilled | 67.8 | 55.1 | 46.9 | 58.7 | 49.4 | −7.6 |
| 030616 | frozen cold-water shrimps and prawns | 2.5 | 2.6 | 2.1 | 1.7 | 3.8 | 11.0 |
|
Source: Global Trade Tracker, 2022 *CAGR: Compound Annual Growth Rate |
|||||||
In terms of volume, total fish and seafood imports from Canada grew at a 6.5% CAGR from 2018 to 2022, with total imports increasing from 2.8 million kilograms to 3.6 million kilograms. Frozen lobsters again saw growth, with a 6.7% CAGR in volume, rising from 1.7 million kilograms in 2018 to 2.2 million kilograms in 2022. However, the volume of live, fresh or chilled lobsters experienced a sharp decline, with a −10.5% CAGR, reducing its volume from 2.8 million kilograms to 1.8 million kilograms. One standout product in terms of volume growth is frozen cuttle fish and squid, which had an impressive 108.0% CAGR from 2019 to 2022, increasing from 0.1 million kilograms to 0.9 million kilograms. Overall, Canada's seafood export performance to South Korea has shown both areas of growth and decline, with frozen lobsters emerging as a key growth product.
| HS Code | Description | 2018 | 2019 | 2020 | 2021 | 2022 | CAGR* % 2018-2022 |
|---|---|---|---|---|---|---|---|
| Total - fish and seafood imports | 2.8 | 2.8 | 3.5 | 3.4 | 3.6 | 6.5 | |
| 030612 | frozen lobsters "homarus spp.", even smoked, whether in shell or not, including lobsters in shell, cooked by steaming or by boiling in water | 1.7 | 2.3 | 1.5 | 1.8 | 2.2 | 6.7 |
| 030632 | lobsters "homarus spp.", whether in shell or not, live, fresh or chilled | 2.8 | 2.2 | 2.2 | 2.0 | 1.8 | −10.5 |
| 030743 | cuttle fish and squid, frozen, with or without shell | 0.0 | 0.1 | 0.5 | 0.7 | 0.9 | 108.0[a] |
|
Source: Global Trade Tracker, 2022 *CAGR: Compound Annual Growth Rate a: CAGR 2019 to 2022 |
|||||||
Retail sales by category and distribution
Retail sales of fish, seafood, and processed seafood in South Korea experienced growth between 2018 and 2022, with varying rates across different categories. The overall fish and seafood market grew at a CAGR of 4.8% during this period, increasing from $3,979.8 million in 2018 to $4,793.3 million in 2022. Within this category, crustaceans experienced the highest growth, with a 5.9% CAGR, rising from $914.7 million to $1,151.1 million. Fish and molluscs and cephalopods followed with 4.4% and 4.6% CAGR, respectively.
In contrast, the processed seafood category exhibited a slower growth rate, with a 1.8% CAGR from 2018 to 2022, increasing from $1,043.6 million to $1,121.8 million. Among the subcategories, shelf-stable seafood grew at a modest 0.6% CAGR, while chilled processed seafood and frozen processed seafood experienced slightly higher growth rates of 3.0% and 4.2%, respectively.
Looking ahead, the forecast for 2022-2027 predicts continued growth across all categories. The overall fish and seafood market is expected to grow at a 4.9% CAGR, reaching $6,086.7 million in 2027. Crustaceans are projected to maintain the highest growth rate, at 7.1% CAGR, while fish and molluscs and cephalopods are expected to grow at 4.1% and 4.4% CAGR, respectively. The processed seafood category is also projected to grow, albeit at a slower pace, with a 2.2% CAGR. Within this category, shelf-stable seafood, chilled processed seafood, and frozen processed seafood are expected to grow at 3.0%, 1.5% and 0.9% CAGR, respectively, by 2027.
South Koreans are now seeking more convenient ways of cooking, such as using ready-to-heat items. This trend is also observed in processed meat, seafood, and alternatives to meat, leading to stagnation for product types that require more steps in the cooking process. Also, South Koreans are increasingly interested in healthier options in processed meat, and the ongoing health and wellness trend is supporting the growth of processed poultry and seafood. White meat is considered much healthier than red meat, particularly for protein intake, leading to the surge in processed poultry and seafood popularity.
| Category | 2018 | 2022 | CAGR* % 2018-2022 | 2023 | 2027 | CAGR* % 2022-2027 |
|---|---|---|---|---|---|---|
| Fish and Seafood | 3,979.8 | 4,793.3 | 4.8 | 5,064.0 | 6,086.7 | 4.9 |
| Crustaceans | 914.7 | 1,151.1 | 5.9 | 1,242.2 | 1,621.1 | 7.1 |
| Fish | 2,429.6 | 2,881.9 | 4.4 | 3,022.9 | 3,521.3 | 4.1 |
| Molluscs and Cephalopods | 635.4 | 760.3 | 4.6 | 798.9 | 944.2 | 4.4 |
| Processed Seafood | 1,043.6 | 1,121.8 | 1.8 | 1,164.3 | 1,252.4 | 2.2 |
| Shelf Stable Seafood | 571.3 | 586.2 | 0.6 | 605.7 | 679.7 | 3.0 |
| Chilled Processed Seafood | 384.0 | 431.6 | 3.0 | 450.4 | 464.2 | 1.5 |
| Frozen Processed Seafood | 88.3 | 104.0 | 4.2 | 108.3 | 108.5 | 0.9 |
|
Source: Euromonitor International, 2023 *CAGR: Compound Annual Growth Rate |
||||||
The distribution channels of processed meat and seafood in South Korea have experienced notable changes between 2018 and 2022, with the retail landscape shifting towards online platforms. The retail offline channel, which accounted for 93.2% of the market share in 2018, decreased to 81.6% in 2022, with a CAGR of −3.3%.
Within the retail offline channel, grocery retailers experienced a decline in market share from 89.8% in 2018 to 77.7% in 2022, with a −3.6% CAGR. Among grocery retailers, convenience stores saw a modest growth of 0.7% CAGR, while supermarkets and hypermarkets faced declines of −4.0% and −4.3% CAGR, respectively. Discounters and warehouse clubs, on the other hand, experienced significant growth, both at 7.5% CAGR. Food/drink/tobacco specialists and small local grocers faced a decline in market share, with −6.9% and −5.0% CAGR, respectively.
The non-grocery retailers channel showed growth, increasing from 3.4% in 2018 to 4.0% in 2022, with a 4.1% CAGR. General merchandise stores were the primary drivers of this growth. However, the most significant change in distribution channels occurred in retail e-commerce, which experienced a substantial increase in market share from 6.8% in 2018 to 18.3% in 2022, with an impressive 28.1% CAGR. This shift indicates a growing preference for online shopping among consumers in South Korea for processed meat and seafood products.
| Outlet Type | 2018 | 2019 | 2020 | 2021 | 2022 | CAGR* % 2018-2022 |
|---|---|---|---|---|---|---|
| Retail Channels | 100.0 | 100.0 | 100.0 | 100.0 | 100.0 | |
| Retail Offline | 93.2 | 89.2 | 84.3 | 82.9 | 81.6 | −3.3 |
| Grocery Retailers | 89.8 | 85.6 | 80.8 | 79.4 | 77.7 | −3.6 |
| Convenience Retail | 10.6 | 10.8 | 10.5 | 10.8 | 11.0 | 0.9 |
| Convenience Stores | 10.6 | 10.8 | 10.5 | 10.7 | 10.9 | 0.7 |
| Forecourt Retailers | 0.0 | 0.0 | 0.1 | 0.1 | 0.1 | |
| Supermarkets | 25.3 | 23.5 | 22.4 | 21.7 | 21.5 | −4.0 |
| Hypermarkets | 43.2 | 41.0 | 37.9 | 37.5 | 36.2 | −4.3 |
| Discounters | 0.3 | 0.4 | 0.4 | 0.4 | 0.4 | 7.5 |
| Warehouse Clubs | 0.9 | 1.0 | 1.0 | 1.2 | 1.2 | 7.5 |
| Food/drink/tobacco specialists | 5.2 | 4.9 | 4.5 | 4.1 | 3.9 | −6.9 |
| Small Local Grocers | 4.3 | 4.0 | 4.1 | 3.8 | 3.5 | −5.0 |
| Non-Grocery Retailers | 3.4 | 3.6 | 3.5 | 3.5 | 4.0 | 4.1 |
| General Merchandise Stores | 3.4 | 3.6 | 3.5 | 3.5 | 4.0 | 4.1 |
| Retail E-Commerce | 6.8 | 10.8 | 15.7 | 17.1 | 18.3 | 28.1 |
|
Source: Euromonitor International, 2023 1: Distribution channels for fish and seafood and processed seafood not available. *CAGR: Compound Annual Growth Rate Processed meat and seafood (as defined by Euromonitor International): processed meat, processed seafood and meat substitutes (includes all types of chilled, frozen and shelf stable meat and fish substitutes such as vegetarian sausages, vegetarian burgers, bean burgers, vegetarian fish filets etc. typically made of Quorn mycoprotein, tofu, soy or texturized vegetable protein). |
||||||
Competitive landscape
The processed seafood industry in South Korea is dominated by a few major companies and brands, as shown in the historic retail sales data from 2018 to 2022. Dongwon F&B Co., Ltd., CJ CheilJedang Corporation, and Sajo Daerim Corporation hold the top positions in the processed seafood market, with respective CAGRs of 2.3%, 1.4% and 1.3% from 2018 to 2022. In 2022, Dongwon F&B held the largest market share, at 36.8%, followed by CJ CheilJedang at 15.1% and Sajo Daerim at 12.9%.
Looking at specific product categories, Dongwon F&B Co., Ltd. dominates the shelf-stable seafood market with a 59.8% share in 2022, while Sajo Daerim Corporation leads the chilled processed seafood market with a 31.0% share. In the frozen processed seafood segment, CJ CheilJedang Corporation holds the largest market share with 27.6%.
| Category | Company | 2018 | 2019 | 2020 | 2021 | 2022 | CAGR* % 2018-2022 | Market share % 2022 |
|---|---|---|---|---|---|---|---|---|
| Processed Seafood | Dongwon F&B Co Ltd | 377.3 | 385.6 | 410.8 | 401.4 | 412.9 | 2.3 | 36.8 |
| CJ CheilJedang Corp | 160.5 | 151.3 | 153.5 | 159.0 | 169.8 | 1.4 | 15.1 | |
| Sajo Daerim Corp | 137.1 | 133.1 | 147.6 | 142.3 | 144.3 | 1.3 | 12.9 | |
| Hansung Enterprise Co Ltd | 66.5 | 61.5 | 58.0 | 55.6 | 57.3 | −3.7 | 5.1 | |
| Jinju Ham Co Ltd | 45.2 | 49.8 | 47.3 | 48.4 | 46.2 | 0.5 | 4.1 | |
| Total | 1,043.6 | 1,037.2 | 1,094.7 | 1,078.7 | 1,121.8 | 1.8 | ||
| Shelf Stable Seafood | Dongwon F&B Co Ltd | 318.1 | 328.8 | 349.3 | 341.1 | 350.7 | 2.5 | 59.8 |
| Jinju Ham Co Ltd | 45.2 | 49.8 | 47.3 | 48.4 | 46.2 | 0.5 | 7.9 | |
| Sajo Industrial Co Ltd | 41.0 | 40.7 | 44.4 | 42.9 | 46.2 | 3.0 | 7.9 | |
| Total | 571.3 | 569.6 | 587.8 | 571.9 | 586.2 | 0.6 | ||
| Chilled Processed Seafood | Sajo Daerim Corp | 122.7 | 120.4 | 135.5 | 130.7 | 133.9 | 2.2 | 31.0 |
| CJ CheilJedang Corp | 103.2 | 98.6 | 106.8 | 108.8 | 115.6 | 2.9 | 26.8 | |
| Dongwon F&B Co Ltd | 37.5 | 36.3 | 42.2 | 42.0 | 44.6 | 4.4 | 10.3 | |
| Total | 384.0 | 374.0 | 410.3 | 409.1 | 431.6 | 3.0 | ||
| Frozen Processed Seafood | CJ CheilJedang Corp | 14.3 | 17.5 | 20.7 | 23.9 | 28.7 | 19.0 | 27.6 |
| Dongwon F&B Co Ltd | 21.8 | 20.6 | 19.3 | 18.3 | 17.5 | −5.3 | 16.9 | |
| Hansung Enterprise Co Ltd | 18.3 | 17.2 | 15.7 | 14.1 | 15.1 | −4.7 | 14.5 | |
| Total | 88.3 | 93.5 | 96.5 | 97.7 | 104.0 | 4.2 | ||
|
Source: Euromonitor International, 2023 1: Data for fish and seafood not available *CAGR: Compound Annual Growth Rate |
||||||||
The top brands in the processed seafood market include Dongwon, Daerim and CJ, which have shown mixed growth rates from 2018 to 2022. The Dongwon brand experienced a modest growth of 1.0%, while Daerim and CJ faced declines of −0.4% and −5.6%, respectively. Among the shelf-stable seafood brands, Dongwon Tuna and Sajo Tuna exhibited growth, while Chunhajangsa remained stable. In the chilled processed seafood segment, Samho Fish Cake showed the most significant growth with an 18.4% CAGR, while the CJ brand declined. In the frozen processed seafood category, CJ demonstrated strong growth with a 14.1% CAGR, while Daerim and Hansung Frozen Fish Cutlet experienced declining growth rates.
| Category | Brand | Company | 2018 | 2019 | 2020 | 2021 | 2022 | CAGR* % 2016-2020 |
|---|---|---|---|---|---|---|---|---|
| Processed Seafood | Dongwon | Dongwon F&B Co Ltd | 31.4 | 32.5 | 33.1 | 32.9 | 32.7 | 1.0 |
| Daerim | Sajo Daerim Corp | 13.1 | 12.8 | 13.5 | 13.2 | 12.9 | −0.4 | |
| CJ | CJ CheilJedang Corp | 9.7 | 7.6 | 7.3 | 7.4 | 7.7 | −5.6 | |
| Samho Fish Cake | CJ CheilJedang Corp | 2.3 | 3.8 | 4.2 | 4.6 | 4.8 | 20.2 | |
| Hansung | Hansung Enterprise Co Ltd | 5.3 | 4.9 | 4.4 | 4.3 | 4.2 | −5.6 | |
| Shelf Stable Seafood | Dongwon Tuna | Dongwon F&B Co Ltd | 45.9 | 48.1 | 49.8 | 50.2 | 50.3 | 2.3 |
| Chunhajangsa | Jinju Ham Co Ltd | 7.9 | 8.7 | 8.0 | 8.5 | 7.9 | 0.0 | |
| Sajo Tuna | Sajo Industrial Co Ltd | 6.8 | 7.0 | 7.5 | 7.5 | 7.9 | 3.8 | |
| Chilled Processed Seafood | Daerim Fish Cake | Sajo Daerim Corp | 20.1 | 21.3 | 22.3 | 21.0 | 20.3 | 0.2 |
| CJ | CJ CheilJedang Corp | 20.1 | 15.3 | 14.2 | 13.7 | 13.3 | −9.8 | |
| Samho Fish Cake | CJ CheilJedang Corp | 6.3 | 10.7 | 11.3 | 12.1 | 12.4 | 18.4 | |
| Frozen Processed Seafood | CJ | CJ CheilJedang Corp | 16.3 | 18.7 | 21.5 | 24.5 | 27.6 | 14.1 |
| Daerim | Sajo Daerim Corp | 16.3 | 13.6 | 12.5 | 11.8 | 10.0 | −11.5 | |
| Hansung Frozen Fish Cutlet | Hansung Enterprise Co Ltd | 4.2 | 3.8 | 3.1 | 2.4 | 2.1 | −15.9 | |
|
Source: Euromonitor International, 2023 1: Data for fish and seafood not available *CAGR: Compound Annual Growth Rate |
||||||||
New product launch analysis
Between 2018 and 2022, South Korea experienced a steady number of new product launches in the fish and fish products market, with a total of 4,196 product launches across the years. The yearly product launches fluctuated, with 900 launches in 2018, 772 in 2019, 872 in 2020, 780 in 2021, and returning to 872 in 2022.
The top five categories of product launches in this period were Processed Fish, Meat & Egg Products (1,464 launches), Meals & Meal Centers (1,120), Snacks (605), Sauces & Seasonings (567) and Soup (251).The top five claims for these products included Convenience (1,978), Positioning (801), Ethical & Environmental (468), Natural (399) and Minus (162).
Regarding packaging, the most common types were Flexible (1,350), Flexible Stand-Up Pouch (631), Tray (485), Skinpack (417), and Flexible Sachet (317). In terms of launch types, New Variety/Range Extension was the most prevalent (1,898), followed by New Product (1,797), New Packaging (368), Relaunch (121), and New Formulation (12). The top five flavours (including blends) featured in these products were Unflavoured/Plain (829), Kimchi (174), Prawn/Shrimp (124), Salt/Salted (86), and Spice/Spicy (81).
Finally, the top five ingredients in the new product launches were Shrimp (Food) with 815 instances, Fish and Fish Products (Food) with 570, Anchovy (Food) with 551, Squid (Food) with 467, and Skipjack Tuna (Food) with 299.
| Product attributes | Yearly launch counts | Total | ||||
|---|---|---|---|---|---|---|
| 2018 | 2019 | 2020 | 2021 | 2022 | ||
| Yearly product launches | 900 | 772 | 872 | 780 | 872 | 4,196 |
| Top five categories | ||||||
| Processed Fish, Meat and Egg Products | 326 | 300 | 341 | 255 | 242 | 1,464 |
| Meals and Meal Centers | 209 | 204 | 182 | 242 | 283 | 1,120 |
| Snacks | 150 | 98 | 112 | 121 | 124 | 605 |
| Sauces and Seasonings | 123 | 98 | 136 | 101 | 109 | 567 |
| Soup | 50 | 50 | 44 | 30 | 77 | 251 |
| Top five claims | ||||||
| Convenience | 456 | 364 | 406 | 337 | 415 | 1,978 |
| Positioning | 139 | 162 | 168 | 157 | 175 | 801 |
| Ethical and environmental | 76 | 60 | 102 | 101 | 129 | 468 |
| Natural | 83 | 83 | 74 | 73 | 86 | 399 |
| Minus | 29 | 27 | 39 | 33 | 34 | 162 |
| Top packaged types | ||||||
| Flexible | 280 | 225 | 301 | 278 | 266 | 1,350 |
| Flexible stand-up pouch | 136 | 113 | 159 | 104 | 119 | 631 |
| Tray | 83 | 83 | 117 | 106 | 96 | 485 |
| Skinpack | 83 | 107 | 97 | 63 | 67 | 417 |
| Flexible sachet | 138 | 74 | 52 | 28 | 25 | 317 |
| Top launch types | ||||||
| New Variety/Range Extension | 417 | 337 | 379 | 367 | 398 | 1,898 |
| New Product | 389 | 347 | 372 | 319 | 370 | 1,797 |
| New Packaging | 69 | 71 | 88 | 57 | 83 | 368 |
| Relaunch | 24 | 15 | 29 | 33 | 20 | 121 |
| New Formulation | 1 | 2 | 4 | 4 | 1 | 12 |
| Top five flavours (including blend) | ||||||
| Unflavoured/Plain | 183 | 186 | 198 | 127 | 135 | 829 |
| Kimchi | 25 | 19 | 57 | 28 | 45 | 174 |
| Prawn/Shrimp | 28 | 16 | 25 | 28 | 27 | 124 |
| Salt/Salted | 40 | 18 | 13 | 6 | 9 | 86 |
| Spice/Spicy | 18 | 18 | 14 | 17 | 14 | 81 |
| Top five ingredients | ||||||
| Shrimp (Food) | 170 | 139 | 187 | 158 | 161 | 815 |
| Fish and Fish Products (Food) | 131 | 77 | 102 | 128 | 132 | 570 |
| Anchovy (Food) | 120 | 94 | 135 | 91 | 111 | 551 |
| Squid (Food) | 121 | 91 | 89 | 79 | 87 | 467 |
| Skipjack Tuna (Food) | 68 | 50 | 48 | 57 | 76 | 299 |
| Source: Mintel, 2023 | ||||||
Examples of new product launches
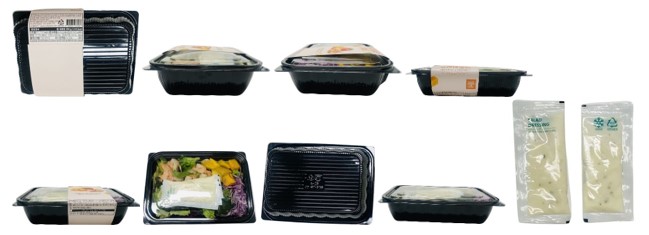
Just Green – Mango and Shrimp Salad with Yogurt Dressing

| Record ID | 10431252 |
|---|---|
| Market | South Korea |
| Company | Just Green |
| Sub-Category | Salads |
Date published: December 2022
Just Green Mango & Shrimp Salad with Yogurt Dressing is now available and retails in a 390 gram pack.
Additional product images
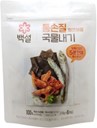
Beksul – Spicy Seafood Stock Bag
| Record ID | 10417568 |
|---|---|
| Market | South Korea |
| Company | CJ CheilJedang |
| Sub-Category | Stocks |
Date published: December 2022
Beksul Spicy Seafood Stock Bag is now available and retails in a 60 gram pack containing six 10 gram units. - Can be ready in just five minutes. - Made with 100% Korean ingredients, including anchovy, small shrimp, whole chilli pepper seed, and kelp. - Environmentally friendly tea bag, which is made from corn starch. - Logos and certifications: HACCP
Additional product images
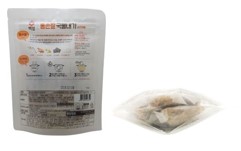
Mallorca Table – Bowl Octopus

| Record ID | 10403904 |
|---|---|
| Market | South Korea |
| Company | Team Seafood |
| Sub-Category | Fish products |
Date published: December 2022
Mallorca Table Bowl Octopus is now available and retails in a 500 gram pack. - Logos and certifications: HACCP
Additional product images
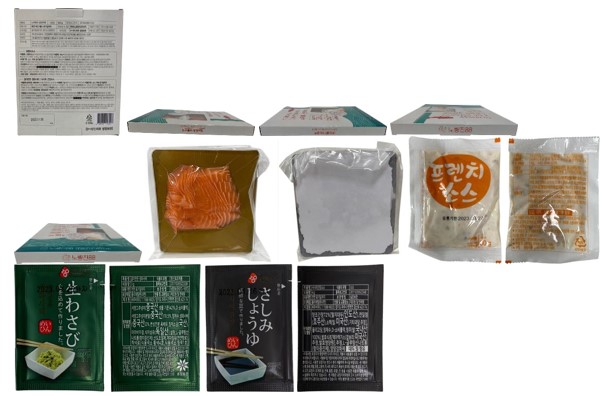
Noryangjin88 – Norway Raw Salmon
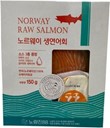
| Record ID | 10362664 |
|---|---|
| Market | South Korea |
| Company | Seondo Seafood |
| Sub-Category | Fish products |
Date published: November 2022
Noryangjin88 Norway Raw Salmon is now available, and retails in a 15 gram pack. - Contains three sauces including French sauce, sashimi soy sauce and fresh wasabi sauce. - Comprises 100% Norwegian superior grade salmon.
Additional product images
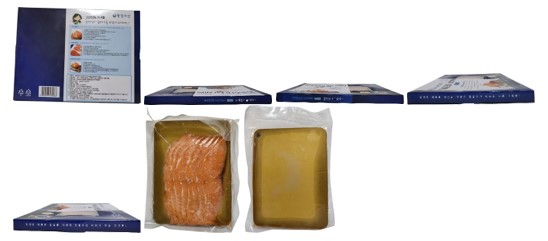
Wangsung – Smoked Salmon Slice
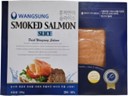
| Record ID | 10351694 |
|---|---|
| Market | South Korea |
| Company | Wangsung Fisheries |
| Sub-Category | Fish products |
Date published: November 2022
Wangsung Smoked Salmon Slice is now available, and retails in a 200 gram pack. - Premium healthy, clean and delicious - This salmon, caught within coasts of Norweigian and Chilean origin, is harvested from controlled environment on complete Traceability and Food Safety Program and a Certificate of Quality. - Expertly hand filleted and then immediately flash frozen for the best possible, the manufacturer's salmon is offered to home and family. - These delectable salmon fillets are individually vacuum packed and sealed for fresh and healthy appetite. - Logos and certifications: HACCP
Additional product images
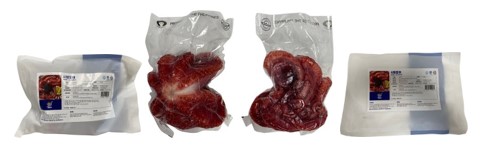
Yehyang – Gochujang Stir-Fried Dried Squid
| Record ID | 10434370 |
|---|---|
| Market | South Korea |
| Company | Yehyang |
| Sub-Category | Fish products |
Date published: December 2022
Yehyang Gochujang Jinmichae (Gochujang Stir-Fried Dried Squid) is now available and retails in a 100 gram pack. - Contains 64.67% squid and 2.91% gochujang. - Microwave safe pack
Additional product images
Opportunities for Canada
The Canada-Korea Free Trade Agreement (CKFTA), which came into force on January 1, 2015, has created numerous opportunities for Canadian businesses to expand their presence in the South Korean market. The CKFTA has significantly reduced or eliminated tariffs on a wide range of products, including seafood, offering Canadian exporters a competitive advantage in the South Korean market.
As shown in the historical data, frozen lobsters (Homarus spp.) have experienced significant growth in the Korean market. With the CKFTA providing a competitive edge through reduced tariffs, Canadian exporters should continue to focus on promoting and expanding their frozen lobster exports to South Korea. Additionally, exploring opportunities in other high-demand seafood products, such as frozen cuttle fish and squid, can further enhance Canada's presence in the Korean market.
For additional information on CKFTA, Canadian exporters should consult:
- Canada-Korea Free Trade Agreement (CKFTA)
- Opportunities and Benefits of CKFTA for Agri-Food Exporters
The Canada Tariff Finder will help you determine tariff information for the CETA market and other countries with which Canada has a free trade agreement.
For more information
The Canadian Trade Commissioner Service:
International Trade Commissioners can provide Canadian industry with on-the-ground expertise regarding market potential, current conditions and local business contacts, and are an excellent point of contact for export advice.
More agri-food market intelligence:
International agri-food market intelligence
Discover global agriculture and food opportunities, the complete library of Global Analysis reports, market trends and forecasts, and information on Canada's free trade agreements.
Agri-food market intelligence service
Canadian agri-food and seafood businesses can take advantage of a customized service of reports and analysis, and join our email subscription service to have the latest reports delivered directly to their inbox.
More on Canada's agriculture and agri-food sectors:
Canada's agriculture sectors
Information on the agriculture industry by sector. Data on international markets. Initiatives to support awareness of the industry in Canada. How the department engages with the industry.
For additional information on the upcoming Seoul Food & Hotel 2023 trade show, please contact:
Ben Berry, Deputy Director
Trade Show Strategy and Delivery
Agriculture and agri-food Canada
ben.berry@agr.gc.ca
Resources
- Euromonitor International, 2023
- Global Trade Tracker, 2023
- Mintel Global New Products Database, 2023
Sector Trend Analysis – Fish and seafood trends in South Korea
Global Analysis Report
Prepared by: Rouzbeh Parsi, Co-op Student
© His Majesty the King in Right of Canada, represented by the Minister of Agriculture and Agri-Food (2023).
Photo credits
All photographs reproduced in this publication are used by permission of the rights holders.
All images, unless otherwise noted, are copyright His Majesty the King in Right of Canada.
To join our distribution list or to suggest additional report topics or markets, please contact:
Agriculture and Agri-Food Canada, Global Analysis1341 Baseline Rd, Tower 5, 3rd floor
Ottawa ON K1A 0C5
Canada
Email: aafc.mas-sam.aac@agr.gc.ca
The Government of Canada has prepared this report based on primary and secondary sources of information. Although every effort has been made to ensure that the information is accurate, Agriculture and Agri-Food Canada (AAFC) assumes no liability for any actions taken based on the information contained herein.
Reproduction or redistribution of this document, in whole or in part, must include acknowledgement of agriculture and agri-food Canada as the owner of the copyright in the document, through a reference citing AAFC, the title of the document and the year. Where the reproduction or redistribution includes data from this document, it must also include an acknowledgement of the specific data source(s), as noted in this document.
Agriculture and Agri-Food Canada provides this document and other report services to agriculture and food industry clients free of charge.