

Note: This report includes forecasting data that is based on baseline historical data.
Executive summary
The Health and Wellness (H&W) food and beverage sector in India reached a retail sales value of US$11.7 billion in 2022, at a compound annual growth rate (CAGR) of 12.8% between 2018 and 2022 and are expected to continue to grow at a CAGR of 13.8% (2022 to 2026).
Naturally Healthy (NH) packaged food products reached US$4,077.3 million in 2022. Naturally healthy fruit snacks was the largest category (US$1,125.7 million) within naturally healthy packaged foods in 2022.
The naturally healthy beverage sector in India reached a retail sales value of US$1.3 billion in 2022, at a CAGR of 22.0% between 2018 and 2022 and are expected to continue to grow at a CAGR of 25.1% (2022 to 2026).
Naturally healthy foods and beverages were distributed mainly through store-based retailing at US$4,564.0 million representing 98.8% of all the distribution channels in 2021. It grew at a CAGR of 11.7% from 2017 to 2021.
Naturally healthy foods were distributed mainly through store-based retailing at US$3,512.1 million, representing 98.8% of all the distribution channels in 2021. It grew at a CAGR of 10.2% from 2017 to 2021.
Naturally healthy beverages were distributed mainly through store-based retailing at US$1,051.9 million, representing 98.7% of all the distribution channels in 2021. It grew at a CAGR of 17.4% from 2017 to 2021.
According to Mintel's Global New Products Database (GNPD), there were 2,185 natual products launched in India between January 2018 and December 2022.
Market overview
Health and wellness (H&W) is the combination of fortified/functional (FF) food and beverages, naturally healthy (NH) food and beverages, better for you (BFY) food, organic food and beverages, and beverages and food intolerance products.
Overall, the health and wellness food and beverage sector in India reached a retail sales value of US$11.7 billion in 2022, at a compound annual growth rate (CAGR) of 12.8% between 2018 and 2022 and are expected to continue to grow at a CAGR of 13.8% (2022 to 2026).
Annual growth 2021 to 2022 of health and wellness was 14.2% and total growth 2018-2022 of health and wellness 2018 to 2022 was 61.7%.
| Category | 2018 | 2019 | 2020 | 2021 | 2022 | CAGR* % 2018-2022 | Annual growth (%) 2021-2022 | Total growth (%) 2018-2022 |
|---|---|---|---|---|---|---|---|---|
| Health and Wellness | 7,251.7 | 8,243.3 | 9,225.8 | 10,274.1 | 11,728.1 | 12.8 | 14.2 | 61.7 |
| Naturally Healthy (NH) | 3,018.0 | 3,514.2 | 4,061.0 | 4,620.0 | 5,382.7 | 15.6 | 16.5 | 78.4 |
| Fortified/Functional (FF) | 3,645.2 | 4,012.8 | 4,407.9 | 4,842.6 | 5,360.7 | 10.1 | 10.7 | 47.1 |
| Better For You (BFY) | 503.4 | 614.7 | 641.9 | 679.9 | 828.8 | 13.3 | 21.9 | 64.6 |
| Organic | 61.1 | 73.9 | 88.4 | 104.3 | 126.9 | 20.0 | 21.7 | 107.7 |
| Free From | 23.9 | 27.8 | 26.6 | 27.4 | 29.1 | 5.0 | 6.2 | 21.8 |
|
Source: Euromonitor International, 2023 *CAGR: compound annual growth rate |
||||||||
Annual growth 2022 to 2023 of health and wellness is 14.1% and total growth 2022 to 2026 of health and wellness is also 67.8%.
| Category | 2023 | 2024 | 2025 | 2026 | CAGR* % 2022-2026 | Annual growth (%) 2022-2023 | Total growth (%) 2022-2026 |
|---|---|---|---|---|---|---|---|
| Health and Wellness | 13,378.4 | 15,221.4 | 17,303.4 | 19,679.7 | 13.8 | 14.1 | 67.8 |
| Naturally Healthy (NH) | 6,286.2 | 7,327.1 | 8,531.1 | 9,928.0 | 16.5 | 16.8 | 84.4 |
| Fortified/Functional (FF) | 5,907.5 | 6,486.3 | 7,113.2 | 7,805.2 | 9.8 | 10.2 | 45.6 |
| Better For You (BFY) | 999.2 | 1,187.8 | 1,400.0 | 1,641.2 | 18.6 | 20.6 | 98.0 |
| Organic | 154.8 | 187.8 | 225.0 | 269.7 | 20.7 | 22.0 | 112.5 |
| Free From | 30.8 | 32.5 | 34.0 | 35.4 | 5.0 | 5.8 | 21.6 |
|
Source: Euromonitor International, 2023 *CAGR: compound annual growth rate |
|||||||
Retail sales
Naturally healthy packaged food products reached US$4,077.3 million in 2022. Naturally healthy fruit snacks was the largest category (US$1,125.7 million) within naturally healthy packaged foods in 2022.
It is worth noting that naturally healthy high fibre sweet buiscuit represented over 35% of the entire naturally healthy high fibre food retail sale, reaching US$329.1 million in 2022.
Rice is one of the most widely consumed staples in India. It is consumed across all parts of the country in one form or another. In recent years, due to rising awareness of health and nutrition amongst consumers, demand for naturally healthy rice has increased, and is set to continue to rise, since naturally healthy rice has become part of the regular diet of Indian consumers (Euromonitor 2023). The naturally healthy rice subcategory had the fastest growth at a CAGR of 24.1% (2018 to 2022). It is expected to grow at CAGR of 17.9% between 2022 and 2026.
Annual growth 2021 to 2022 of naturally healthy packaged food was 14.7% and total gowth 2018 to 2022 of naturally healthy pacakaged food was 67.9%.
| Category | 2018 | 2019 | 2020 | 2021 | 2022 | CAGR* % 2018-2022 | Annual growth (%) 2021-2022 | Total growth (%) 2018-2022 |
|---|---|---|---|---|---|---|---|---|
| Naturally Healthy Packaged Food | 2,427.8 | 2,806.0 | 3,149.2 | 3,554.8 | 4,077.3 | 13.8 | 14.7 | 67.9 |
| NH Cereal Bars | 6.1 | 7.7 | 9.0 | 10.8 | 13.1 | 21.1 | 21.3 | 114.8 |
| NH Dairy | 542.2 | 647.9 | 725.6 | 790.9 | 923.7 | 14.2 | 16.8 | 70.4 |
| NH Sour Milk Products | 542.2 | 647.9 | 725.6 | 790.9 | 923.7 | 14.2 | 16.8 | 70.4 |
| NH Fruit Snacks | 657.7 | 765.8 | 855.5 | 977.5 | 1,125.7 | 14.4 | 15.2 | 71.2 |
| NH High Fibre Food | 588.5 | 658.5 | 729.8 | 827.3 | 937.4 | 12.3 | 13.3 | 59.3 |
| NH High Fibre Bread | 121.6 | 133.5 | 148.4 | 166.4 | 183.1 | 10.8 | 10.0 | 50.6 |
| NH High Fibre Breakfast Cereals | 141.1 | 164.1 | 192.5 | 225.4 | 261.7 | 16.7 | 16.1 | 85.5 |
| NH High Fibre Noodles | 70.2 | 87.0 | 108.3 | 133.4 | 163.5 | 23.5 | 22.6 | 132.9 |
| NH High Fibre Sweet Biscuits | 255.7 | 274.0 | 280.6 | 302.1 | 329.1 | 6.5 | 8.9 | 28.7 |
| NH Honey | 150.4 | 180.8 | 238.7 | 287.2 | 331.6 | 21.9 | 15.5 | 120.5 |
| NH Olive Oil | 121.0 | 133.2 | 140.0 | 154.2 | 169.3 | 8.8 | 9.8 | 39.9 |
| NH Rice | 20.7 | 25.8 | 32.6 | 40.4 | 49.1 | 24.1 | 21.5 | 137.2 |
| NH Nuts, Seeds and Trail Mixes | 341.2 | 386.3 | 418.0 | 466.4 | 527.5 | 11.5 | 13.1 | 54.6 |
|
Source: Euromonitor International, 2023 *CAGR: compound annual growth rate |
||||||||
Annual growth 2022 to 2023 of naturally healthy packaged food was 14.3% and total gowth 2022-2026 of naturally healthy pacakaged food was 65.2%. Naturally healthy cereal bars is expected to have the largest total growth of 119.1%, followed by the total growth of naturally healthy rice: 93.5% from 2022 to 2026.
| Category | 2023 | 2024 | 2025 | 2026 | CAGR* % 2022-2026 | Annual growth (%) 2022-2023 | Total growth (%) 2022-2026 |
|---|---|---|---|---|---|---|---|
| Naturally Healthy Packaged Food | 4,660.5 | 5,292.0 | 5,976.9 | 6,734.8 | 13.4 | 14.3 | 65.2 |
| NH Cereal Bars | 15.9 | 19.4 | 23.5 | 28.7 | 21.7 | 21.4 | 119.1 |
| NH Dairy | 1,074.9 | 1,234.9 | 1,405.6 | 1,593.9 | 14.6 | 16.4 | 72.6 |
| NH Sour Milk Products | 1,074.9 | 1,234.9 | 1,405.6 | 1,593.9 | 14.6 | 16.4 | 72.6 |
| NH Fruit Snacks | 1,292.5 | 1,476.6 | 1,683.3 | 1,915.3 | 14.2 | 14.8 | 70.1 |
| NH High Fibre Food | 1,054.5 | 1,177.0 | 1,305.3 | 1,446.8 | 11.5 | 12.5 | 54.3 |
| NH High Fibre Bread | 200.0 | 215.9 | 231.0 | 246.6 | 7.7 | 9.2 | 34.7 |
| NH High Fibre Breakfast Cereals | 301.7 | 343.0 | 387.3 | 436.0 | 13.6 | 15.3 | 66.6 |
| NH High Fibre Noodles | 194.1 | 229.0 | 266.2 | 308.5 | 17.2 | 18.7 | 88.7 |
| NH High Fibre Sweet Biscuits | 358.7 | 389.1 | 420.8 | 455.7 | 8.5 | 9.0 | 38.5 |
| NH Honey | 379.9 | 432.1 | 487.1 | 545.1 | 13.2 | 14.6 | 64.4 |
| NH Olive Oil | 184.7 | 200.9 | 218.1 | 235.5 | 8.6 | 9.1 | 39.1 |
| NH Rice | 58.8 | 69.8 | 81.8 | 95.0 | 17.9 | 19.8 | 93.5 |
| NH Nuts, Seeds and Trail Mixes | 599.3 | 681.3 | 772.1 | 874.6 | 13.5 | 13.6 | 65.8 |
|
Source: Euromonitor International, 2023 *CAGR: compound annual growth rate |
|||||||
The naturally healthy beverage sector in India reached a retail sales value of US$1.3 billion in 2022, at a CAGR of 22.0% between 2018 and 2022 and are expected to continue to grow at a CAGR of 25.1% (2022 to 2026).
Annual growth 2021 to 2022 of health and wellness was 22.5% and total growth 2018 to 2022 of health and wellness 2018 to 2022 was 121.2%.
| Category | 2018 | 2019 | 2020 | 2021 | 2022 | CAGR* % 2018-2022 | Annual growth (%) 2021-2022 | Total growth (%) 2018-2022 |
|---|---|---|---|---|---|---|---|---|
| Naturally Healthy (NH) | 3,018.0 | 3,514.2 | 4,061.0 | 4,620.0 | 5,382.7 | 15.6 | 16.5 | 78.4 |
| Naturally Healthy Beverages | 590.2 | 708.2 | 911.8 | 1,065.2 | 1,305.4 | 22.0 | 22.5 | 121.2 |
| NH Hot Drinks | 470.0 | 555.2 | 721.0 | 812.7 | 962.5 | 19.6 | 18.4 | 104.8 |
| NH Tea | 285.0 | 367.9 | 522.3 | 601.0 | 747.6 | 27.3 | 24.4 | 162.3 |
| NH Other Hot Drinks | 185.0 | 187.4 | 198.7 | 211.8 | 214.9 | 3.8 | 1.5 | 16.2 |
| NH Soft Drinks | 120.2 | 153.0 | 190.8 | 252.4 | 342.8 | 30.0 | 35.8 | 185.2 |
| NH Bottled Water | 6.6 | 8.0 | 7.4 | 8.7 | 10.4 | 12.0 | 19.5 | 57.6 |
| NH Natural Mineral Water | 6.6 | 8.0 | 7.4 | 8.7 | 10.4 | 12.0 | 19.5 | 57.6 |
| NH Still Natural Mineral Bottled Water | 6.6 | 8.0 | 7.4 | 8.7 | 10.4 | 12.0 | 19.5 | 57.6 |
| NH Fruit / Vegetable Juice | 113.7 | 145.0 | 183.4 | 243.7 | 332.4 | 30.8 | 36.4 | 192.3 |
| NH 100% Juice | 53.2 | 70.4 | 94.9 | 133.9 | 195.5 | 38.5 | 46.0 | 267.5 |
| NH Superfruit Juice | 60.5 | 74.6 | 88.4 | 109.8 | 136.9 | 22.6 | 24.7 | 126.3 |
| NH Superfruit Nectars (25-99% Juice) | 60.5 | 74.6 | 88.4 | 109.8 | 136.9 | 22.6 | 24.7 | 126.3 |
|
Source: Euromonitor International, 2023 *CAGR: compound annual growth rate |
||||||||
Annual growth 2022 to 2023 of naturally healthy beverage was 24.5% and total growth 2022 to 2026 of naturally healthy beverage was 144.6%. Naturally healthy 100% Juice is expected to have the largest total growth of 322.6% from 2022 to 2026.
| Category | 2023 | 2024 | 2025 | 2026 | CAGR* % 2022-2026 | Annual growth (%) 2022-2023 | Total growth (%) 2022-2026 |
|---|---|---|---|---|---|---|---|
| Naturally Healthy (NH) | 6,286.2 | 7,327.1 | 8,531.1 | 9,928.0 | 16.5 | 16.8 | 84.4 |
| Naturally Healthy Beverages | 1,625.7 | 2,035.1 | 2,554.2 | 3,193.3 | 25.1 | 24.5 | 144.6 |
| NH Hot Drinks | 1,148.9 | 1,385.4 | 1,673.3 | 2,016.1 | 20.3 | 19.4 | 109.5 |
| NH Tea | 932.6 | 1,160.0 | 1,439.7 | 1,786.5 | 24.3 | 24.7 | 139.0 |
| NH Other Hot Drinks | 216.4 | 225.4 | 233.5 | 229.7 | 1.7 | 0.7 | 6.9 |
| NH Soft Drinks | 476.8 | 649.7 | 880.9 | 1,177.1 | 36.1 | 39.1 | 243.4 |
| NH Bottled Water | 12.4 | 14.7 | 17.5 | 20.8 | 18.9 | 19.2 | 100.0 |
| NH Natural Mineral Water | 12.4 | 14.7 | 17.5 | 20.8 | 18.9 | 19.2 | 100.0 |
| NH Still Natural Mineral Bottled Water | 12.4 | 14.7 | 17.5 | 20.8 | 18.9 | 19.2 | 100.0 |
| NH Fruit / Vegetable Juice | 464.4 | 635.0 | 863.4 | 1,156.3 | 36.6 | 39.7 | 247.9 |
| NH 100% Juice | 293.9 | 422.6 | 598.8 | 826.1 | 43.4 | 50.3 | 322.6 |
| NH Superfruit Juice | 170.5 | 212.4 | 264.6 | 330.2 | 24.6 | 24.5 | 141.2 |
| NH Superfruit Nectars (25-99% Juice) | 170.5 | 212.4 | 264.6 | 330.2 | 24.6 | 24.5 | 141.2 |
|
Source: Euromonitor International, 2023 *CAGR: compound annual growth rate |
|||||||
Distribution channels
Naturally healthy foods and beverages were distributed mainly through store-based retailing at US$4,564.0 million representing 98.8% of all the distribution channels in 2021. It grew at a CAGR of 11.7% from 2017 to 2021. Non-store (E-Commerce) retailing at US$56.0 million representing 1.2% among all the distribution channels in 2021. It grew at a CAGR of 43.8% from 2017 to 2021.
| Channel | 2017 | 2018 | 2019 | 2020 | 2021 | CAGR* % 2017-2021 |
|---|---|---|---|---|---|---|
| Store-Based Retailing | 2,933.7 | 3,269.3 | 3,695.4 | 4,049.4 | 4,564.0 | 11.7 |
| Grocery Retailers | 2,933.7 | 3,269.3 | 3,695.4 | 4,049.4 | 4,564.0 | 11.7 |
| Modern Grocery Retailers | 826.8 | 923.0 | 1,049.6 | 1,158.7 | 1,312.4 | 12.2 |
| Convenience Stores | 47.5 | 51.8 | 57.3 | 63.6 | 72.1 | 11.0 |
| Forecourt Retailers | 12.4 | 12.5 | 14.1 | 15.4 | 17.4 | 8.8 |
| Hypermarkets | 404.6 | 450.1 | 511.1 | 557.2 | 631.5 | 11.8 |
| Supermarkets | 362.3 | 408.6 | 467.2 | 522.5 | 591.4 | 13.0 |
| Traditional Grocery Retailers | 2,106.9 | 2,346.3 | 2,645.8 | 2,890.7 | 3,251.6 | 11.5 |
| Independent Small Grocers | 2,064.9 | 2,299.1 | 2,591.9 | 2,832.1 | 3,181.8 | 11.4 |
| Other Grocery Retailers | 42.0 | 47.2 | 53.9 | 58.6 | 69.8 | 13.5 |
| Non-Store Retailing | 13.1 | 16.9 | 21.4 | 32.4 | 56.0 | 43.8 |
| E-Commerce | 13.1 | 16.9 | 21.4 | 32.4 | 56.0 | 43.8 |
|
Source: Euromonitor International, 2023 *CAGR: compound annual growth rate |
||||||
| Channel | 2017 | 2018 | 2019 | 2020 | 2021 | CAGR* % 2017-2021 |
|---|---|---|---|---|---|---|
| Store-Based Retailing | 99.6 | 99.5 | 99.4 | 99.2 | 98.8 | −0.2 |
| Grocery Retailers | 99.6 | 99.5 | 99.4 | 99.2 | 98.8 | −0.2 |
| Modern Grocery Retailers | 28.1 | 28.1 | 28.2 | 28.4 | 28.4 | 0.3 |
| Convenience Stores | 1.6 | 1.6 | 1.5 | 1.6 | 1.6 | 0.0 |
| Forecourt Retailers | 0.4 | 0.4 | 0.4 | 0.4 | 0.4 | 0.0 |
| Hypermarkets | 13.7 | 13.7 | 13.7 | 13.7 | 13.7 | 0.0 |
| Supermarkets | 12.3 | 12.4 | 12.6 | 12.8 | 12.8 | 1.0 |
| Traditional Grocery Retailers | 71.5 | 71.4 | 71.2 | 70.8 | 70.4 | −0.4 |
| Independent Small Grocers | 70.1 | 70.0 | 69.7 | 69.4 | 68.9 | −0.4 |
| Other Grocery Retailers | 1.4 | 1.4 | 1.5 | 1.4 | 1.5 | 1.7 |
| Non-Store Retailing | 0.4 | 0.5 | 0.6 | 0.8 | 1.2 | 31.6 |
| E-Commerce | 0.4 | 0.5 | 0.6 | 0.8 | 1.2 | 31.6 |
| Total | 100.0 | 100.0 | 100.0 | 100.0 | 100.0 | 0.0 |
|
Source: Euromonitor International, 2023 *CAGR: compound annual growth rate |
||||||
Naturally healthy foods were distributed mainly through store-based retailing at US$3,512.1 million, representing 98.8% of all the distribution channels in 2021. It grew at a CAGR of 10.2% from 2017 to 2021. Non-store retailing (E-Commerce) at US$42.7 million, representing 1.2% of all the distribution channels in 2021. It grew at a CAGR of 38.2% from 2017 to 2021.
| Channel | 2017 | 2018 | 2019 | 2020 | 2021 | CAGR* % 2017-2021 |
|---|---|---|---|---|---|---|
| Store-Based Retailing | 2,379.2 | 2,629.5 | 2,950.9 | 3,145.9 | 3,512.1 | 10.2 |
| Grocery Retailers | 2,379.2 | 2,629.5 | 2,950.9 | 3,145.9 | 3,512.1 | 10.2 |
| Modern Grocery Retailers | 673.4 | 744.4 | 839.9 | 900.3 | 1,009.9 | 10.7 |
| Convenience Stores | 35.9 | 38.3 | 41.5 | 44.3 | 49.8 | 8.5 |
| Forecourt Retailers | 10.8 | 10.6 | 11.9 | 12.7 | 14.2 | 7.1 |
| Hypermarkets | 359.0 | 396.7 | 448.1 | 479.3 | 539.9 | 10.7 |
| Supermarkets | 267.8 | 298.7 | 338.3 | 364.0 | 406.0 | 11.0 |
| Traditional Grocery Retailers | 1,705.8 | 1,885.2 | 2,111.0 | 2,245.6 | 2,502.3 | 10.1 |
| Independent Small Grocers | 1,705.8 | 1,885.2 | 2,111.0 | 2,245.6 | 2,502.3 | 10.1 |
| Non-Store Retailing | 11.7 | 14.0 | 16.9 | 19.4 | 42.7 | 38.2 |
| E-Commerce | 11.7 | 14.0 | 16.9 | 19.4 | 42.7 | 38.2 |
|
Source: Euromonitor International, 2023 *CAGR: compound annual growth rate |
||||||
| Channel | 2017 | 2018 | 2019 | 2020 | 2021 | CAGR* % 2017-2021 |
|---|---|---|---|---|---|---|
| Store-Based Retailing | 99.5 | 99.5 | 99.4 | 99.4 | 98.8 | −0.2 |
| Grocery Retailers | 99.5 | 99.5 | 99.4 | 99.4 | 98.8 | −0.2 |
| Modern Grocery Retailers | 28.2 | 28.2 | 28.3 | 28.4 | 28.4 | 0.2 |
| Convenience Stores | 1.5 | 1.5 | 1.4 | 1.4 | 1.4 | −1.7 |
| Forecourt Retailers | 0.4 | 0.4 | 0.4 | 0.4 | 0.4 | 0.0 |
| Hypermarkets | 15.0 | 15.0 | 15.1 | 15.1 | 15.2 | 0.3 |
| Supermarkets | 11.2 | 11.3 | 11.4 | 11.5 | 11.4 | 0.4 |
| Traditional Grocery Retailers | 71.3 | 71.3 | 71.1 | 70.9 | 70.4 | −0.3 |
| Independent Small Grocers | 71.3 | 71.3 | 71.1 | 70.9 | 70.4 | −0.3 |
| Non-Store Retailing | 0.5 | 0.5 | 0.6 | 0.6 | 1.2 | 24.5 |
| E-Commerce | 0.5 | 0.5 | 0.6 | 0.6 | 1.2 | 24.5 |
| Total | 100.0 | 100.0 | 100.0 | 100.0 | 100.0 | 0.0 |
|
Source: Euromonitor International, 2023 *CAGR: compound annual growth rate |
||||||
Naturally healthy beverages were distributed mainly through store-based retailing at US$1,051.9 million, representing 98.7% of all the distribution channels in 2021. It grew at a CAGR of 17.4% from 2017 to 2021. Non-store retailing (E-Commerce) at US$13.3 million representing 1.3% of all the distribution channels in 2021. It grew at a CAGR of 75.6% from 2017 to 2021.
| Channel | 2017 | 2018 | 2019 | 2020 | 2021 | CAGR* % 2017-2021 |
|---|---|---|---|---|---|---|
| Store-Based Retailing | 554.5 | 639.8 | 744.5 | 903.5 | 1,051.9 | 17.4 |
| Grocery Retailers | 554.5 | 639.8 | 744.5 | 903.5 | 1,051.9 | 17.4 |
| Modern Grocery Retailers | 153.4 | 178.7 | 209.7 | 258.4 | 302.5 | 18.5 |
| Convenience Stores | 11.7 | 13.5 | 15.7 | 19.2 | 22.4 | 17.6 |
| Forecourt Retailers | 1.7 | 1.9 | 2.2 | 2.7 | 3.2 | 17.1 |
| Hypermarkets | 45.6 | 53.3 | 62.9 | 77.9 | 91.6 | 19.1 |
| Supermarkets | 94.5 | 109.9 | 128.8 | 158.5 | 185.3 | 18.3 |
| Traditional Grocery Retailer | 401.1 | 461.1 | 534.8 | 645.1 | 749.4 | 16.9 |
| Independent Small Grocers | 359.1 | 413.9 | 480.9 | 586.5 | 679.6 | 17.3 |
| Other Grocery Retailers | 42.0 | 47.2 | 53.9 | 58.6 | 69.8 | 13.5 |
| Non-Store Retailing | 1.4 | 2.9 | 4.5 | 12.9 | 13.3 | 75.6 |
| E-Commerce | 1.4 | 2.9 | 4.5 | 12.9 | 13.3 | 75.6 |
|
Source: Euromonitor International, 2023 *CAGR: compound annual growth rate |
||||||
| Channel | 2017 | 2018 | 2019 | 2020 | 2021 | CAGR* % 2017-2021 |
|---|---|---|---|---|---|---|
| Store-Based Retailing | 99.7 | 99.6 | 99.4 | 98.6 | 98.7 | −0.3 |
| Grocery Retailers | 99.7 | 99.6 | 99.4 | 98.6 | 98.7 | −0.3 |
| Modern Grocery Retailers | 27.6 | 27.8 | 28.0 | 28.2 | 28.4 | 0.7 |
| Convenience Stores | 2.1 | 2.1 | 2.1 | 2.1 | 2.1 | 0.0 |
| Forecourt Retailers | 0.3 | 0.3 | 0.3 | 0.3 | 0.3 | 0.0 |
| Hypermarkets | 8.2 | 8.3 | 8.4 | 8.5 | 8.6 | 1.2 |
| Supermarkets | 17.0 | 17.1 | 17.2 | 17.3 | 17.4 | 0.6 |
| Traditional Grocery Retailer | 72.2 | 71.7 | 71.4 | 70.4 | 70.3 | −0.7 |
| Independent Small Grocers | 64.6 | 64.4 | 64.2 | 64.0 | 63.8 | −0.3 |
| Other Grocery Retailers | 7.6 | 7.3 | 7.2 | 6.4 | 6.6 | −3.5 |
| Non-Store Retailing | 0.3 | 0.4 | 0.6 | 1.4 | 1.3 | 44.3 |
| E-Commerce | 0.3 | 0.4 | 0.6 | 1.4 | 1.3 | 44.3 |
| Total | 100.0 | 100.0 | 100.0 | 100.0 | 100.0 | 0.0 |
|
Source: Euromonitor International, 2023 *CAGR: compound annual growth rate |
||||||
Top company retail shares
In 2021, leading companies in the naturally healthy packaged food category were fairly distributed and included the Gujarat Co-operative Milk Marketing Federation Ltd at a 7.1% market share, with a CAGR of 10.9% from 2017 to 2021. Haldiram Foods International Pvt Ltd (7.1% market share, with a CAGR of 7.8% from 2017 to 2021), and the Dabur India Ltd (3.5% market share, with a CAGR of 17.0% from 2017 to 2021).
| Company Name | 2017 | 2018 | 2019 | 2020 | 2021 | CAGR* % 2017-2021 | Market share % in 2021 |
|---|---|---|---|---|---|---|---|
| Gujarat Co-operative Milk Marketing Federation Ltd | 167.1 | 184.6 | 209.8 | 229.3 | 253.2 | 10.9 | 7.1 |
| Haldiram Foods International Pvt Ltd | 186.2 | 199.8 | 219.6 | 226.0 | 251.4 | 7.8 | 7.1 |
| Dabur India Ltd | 66.2 | 69.3 | 82.7 | 103.0 | 124.2 | 17.0 | 3.5 |
| Nestlé SA | 58.7 | 71.9 | 87.7 | 96.5 | 107.2 | 16.2 | 3.0 |
| ITC Group | 77.5 | 80.5 | 82.4 | 81.6 | 87.0 | 2.9 | 2.4 |
| Patanjali Ayurved Ltd | 28.8 | 43.1 | 50.1 | 74.3 | 83.5 | 30.5 | 2.3 |
| Marico Ltd | 28.4 | 34.6 | 43.2 | 60.7 | 76.8 | 28.2 | 2.2 |
| Parle Products Pvt Ltd | 79.4 | 76.7 | 75.2 | 71.6 | 75.9 | −1.1 | 2.1 |
| Tamil Nadu Cooperative Milk Producers Federation Ltd | 46.7 | 49.3 | 53.8 | 56.3 | 60.4 | 6.6 | 1.7 |
| Punjab State Cooperative Milk Producers Federation Ltd, The | 35.3 | 40.4 | 46.9 | 51.2 | 55.1 | 11.8 | 1.6 |
|
Source: Euromonitor International, 2023 *CAGR: compound annual growth rate |
|||||||
In 2021, top leaders within the naturally healthy drink category included Tata Consumer Products Ltd, 5.1% market share, followed by the Unilever Group (4.5% market share, with a CAGR of 31.7% from 2017 to 2021), and Dabur India Ltd (2.4% market share, with a CAGR of 12.7% from 2017 to 2021).
| Company Name | 2017 | 2018 | 2019 | 2020 | 2021 | CAGR* % 2017-2021 | Market share % in 2021 |
|---|---|---|---|---|---|---|---|
| Tata Consumer Products Ltd | 157.7 | 181.8 | N/C | 5.1 | |||
| Unilever Group | 53.4 | 76.7 | 98.3 | 135.4 | 160.6 | 31.7 | 4.5 |
| Dabur India Ltd | 54.0 | 59.0 | 66.2 | 72.8 | 87.0 | 12.7 | 2.4 |
| Rakyan Beverages Pvt Ltd | 5.6 | 10.5 | 17.9 | 32.7 | 56.1 | 77.9 | 1.6 |
| Cosmic Nutracos Solutions Pvt Ltd | 13.4 | 16.2 | 20.6 | 27.6 | 31.6 | 23.9 | 0.9 |
| ITC Foods Ltd | 16.9 | 18.1 | 20.7 | 22.9 | 28.1 | 13.6 | 0.8 |
| PepsiCo Inc | 11.8 | 12.7 | 14.4 | 15.4 | 16.8 | 9.2 | 0.5 |
| Associated British Foods Plc | 3.0 | 3.8 | 4.7 | 6.2 | 7.0 | 23.6 | 0.2 |
| Dharmapal Satyapal Ltd | 1.5 | 1.7 | 2.0 | 1.9 | 2.0 | 7.5 | 0.1 |
| Narang group, The | 0.9 | 0.9 | 1.1 | 1.3 | 1.4 | 11.7 | 0.04 |
|
Source: Euromonitor International, 2023 *CAGR: Compound annual growth rate N/C: Not calculable |
|||||||
New product launch analysis
According to Mintel's Global New Products Database (GNPD), there were 8,961 launches of functional food and beverage products in India between January 2018 and December 2022. 6,084 of these products were functional food and 2,877 products were functional beverages. The number of new packaged food launches is increasing, while the number of new functional beverage launches is decreasing.
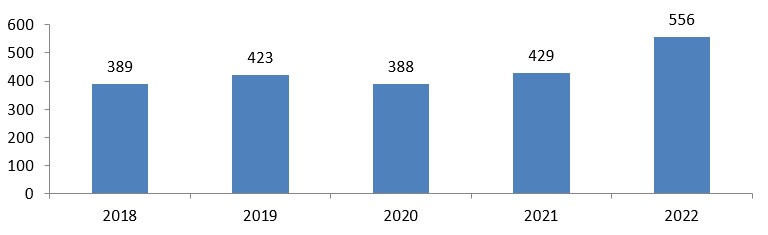
Description of above image
| Date published | Number of variants |
|---|---|
| 2018 | 389 |
| 2019 | 423 |
| 2020 | 388 |
| 2021 | 429 |
| 2022 | 556 |
Source: Mintel, 2023
| Date published | Number of natural food | Number of natural beverages |
|---|---|---|
| 2018 | 289 | 57 |
| 2019 | 304 | 59 |
| 2020 | 319 | 37 |
| 2021 | 333 | 70 |
| 2022 | 452 | 71 |
| Total Sample | 1,697 | 294 |
| Source: Mintel, 2023 | ||
In 2022, the top five natural healthy food products manufacturers were located in India, Thailand, United States, United Arab Emirates and France. The top five brands were Licious, Tata Sampann, NatureLand Organics, Forest Found and Accept Organic. The top ingredient claims were white sugar, salt, iodized salt. flavouring substances and food acids.
| Product attributes | Yearly launch count | |||||
|---|---|---|---|---|---|---|
| 2018 | 2019 | 2020 | 2021 | 2022 | Total | |
| Top five flavours component | ||||||
| Unflavoured/Plain | 120 | 122 | 150 | 152 | 213 | 757 |
| Masala | 13 | 4 | 2 | 13 | 15 | 47 |
| Roasted/Toasted | 4 | 1 | 10 | 16 | 14 | 45 |
| Chocolate | 8 | 10 | 9 | 7 | 7 | 41 |
| Salt/Salted | 2 | 3 | 8 | 11 | 12 | 36 |
| Top five locations of manufacture | ||||||
| India | 91 | 128 | 133 | 129 | 186 | 667 |
| Thailand | 1 | 0 | 0 | 2 | 1 | 4 |
| United States | 0 | 1 | 0 | 1 | 1 | 3 |
| United Arab Emirates | 1 | 1 | 0 | 1 | 0 | 3 |
| France | 2 | 0 | 0 | 0 | 0 | 2 |
| Top five brands | ||||||
| Licious | 1 | 3 | 0 | 13 | 16 | 33 |
| Tata Sampann | 0 | 0 | 1 | 7 | 19 | 27 |
| NatureLand Organics | 0 | 5 | 16 | 3 | 1 | 25 |
| Forest Found | 0 | 0 | 11 | 12 | 1 | 24 |
| Accept Organic | 0 | 3 | 15 | 4 | 0 | 22 |
| Top launch types | ||||||
| New Product | 98 | 129 | 165 | 143 | 227 | 762 |
| New Variety/Range Extension | 96 | 74 | 73 | 110 | 124 | 477 |
| New Packaging | 72 | 67 | 64 | 73 | 87 | 363 |
| Relaunch | 22 | 30 | 17 | 7 | 13 | 89 |
| New Formulation | 1 | 4 | 0 | 0 | 1 | 6 |
| Top five categories | ||||||
| Sauces and Seasonings | 47 | 59 | 68 | 65 | 82 | 321 |
| Processed Fish, Meat and Egg Products | 41 | 42 | 37 | 66 | 82 | 268 |
| Bakery | 64 | 46 | 40 | 41 | 70 | 261 |
| Snacks | 41 | 55 | 43 | 65 | 48 | 252 |
| Fruit and Vegetables | 7 | 15 | 29 | 19 | 39 | 109 |
| Top ingredient claims | ||||||
| White Sugar (Food) | 82 | 75 | 69 | 71 | 98 | 395 |
| Salt (Food) | 82 | 80 | 58 | 92 | 80 | 392 |
| Iodized Salt (Food) | 40 | 34 | 25 | 49 | 103 | 251 |
| Flavouring Substances (Food) | 45 | 47 | 41 | 64 | 52 | 249 |
| Food Acids | 52 | 46 | 33 | 54 | 61 | 246 |
| Source: Mintel, 2023 | ||||||
In 2022, the top five nutritions of the naturally healthy beverages were Carbohydrates, Protein, Fat, Energy and sugars. The top five brands were Mala's, Ganesh, Tetley, Organic Tattva and Complan. The top ingredient claims were natural, permitted, artificial, Class II Preservative and green.
| Product attributes | Yearly launch count | |||||
|---|---|---|---|---|---|---|
| 2018 | 2019 | 2020 | 2021 | 2022 | Total | |
| Top five flavours | ||||||
| Unflavoured / Plain | 11 | 8 | 7 | 9 | 9 | 44 |
| Lemon | 4 | 3 | 3 | 10 | 8 | 28 |
| Ginger | 2 | 3 | 4 | 6 | 8 | 23 |
| Chocolate | 4 | 4 | 1 | 8 | 3 | 20 |
| Tulsi / Holy Basil | 4 | 2 | 1 | 4 | 8 | 19 |
| Top five nutritions | ||||||
| Carbohydrates (listed on pack) | 46 | 49 | 33 | 56 | 47 | 231 |
| Protein (listed on pack) | 45 | 49 | 32 | 52 | 45 | 223 |
| Fat (listed on pack) | 45 | 47 | 31 | 53 | 45 | 221 |
| Energy (kcal) (listed on pack) | 44 | 42 | 30 | 53 | 47 | 216 |
| Sugars (listed on pack) | 37 | 41 | 23 | 43 | 36 | 180 |
| Top five brands | ||||||
| Mala's | 1 | 9 | 4 | 5 | 13 | 32 |
| Ganesh | 2 | 7 | 0 | 3 | 1 | 13 |
| Tetley | 0 | 0 | 0 | 5 | 5 | 10 |
| Organic Tattva | 3 | 1 | 0 | 1 | 1 | 6 |
| Complan | 0 | 0 | 1 | 5 | 0 | 6 |
| Top launch types | ||||||
| New Product | 30 | 23 | 17 | 29 | 12 | 111 |
| New Packaging | 9 | 17 | 12 | 28 | 37 | 103 |
| New Variety / Range Extension | 11 | 13 | 5 | 11 | 18 | 58 |
| Relaunch | 3 | 6 | 3 | 2 | 4 | 18 |
| New Formulation | 4 | 0 | 0 | 0 | 0 | 4 |
| Top categories | ||||||
| New Product | 30 | 23 | 17 | 29 | 12 | 111 |
| New Packaging | 9 | 17 | 12 | 28 | 37 | 103 |
| New Variety / Range Extension | 11 | 13 | 5 | 11 | 18 | 58 |
| Relaunch | 3 | 6 | 3 | 2 | 4 | 18 |
| New Formulation | 4 | 0 | 0 | 0 | 0 | 4 |
| Top five ingredient claims | ||||||
| Natural | 39 | 34 | 19 | 46 | 46 | 184 |
| Permitted | 26 | 32 | 6 | 29 | 25 | 118 |
| Artificial | 27 | 31 | 8 | 24 | 23 | 113 |
| Class II Preservative | 24 | 27 | 9 | 16 | 21 | 97 |
| Green | 5 | 9 | 6 | 11 | 10 | 41 |
| Source: Mintel, 2023 | ||||||
Examples of new product launches
Premium Raw Pumpkin Seeds
Source: Mintel, 2023
| Company | SKB Food Products |
|---|---|
| Manufacturer | SKB Food Products |
| Brand | Mr. Nuttz |
| Category | Snacks |
| Sub-category | Nuts |
| Market | India |
| Location of manufacture | India |
| Import status | Not imported |
| Store type | Internet / mail order |
| Date published | December 2022 |
| Product source | Shopper |
| Launch type | New variety / range extension |
| Price in local currency | INR399.00 |
| Price in US dollars | 4.90 |
| Price in Euros | 4.66 |
Mr. Nuttz Premium Raw Pumpkin Seeds are now available, and retail in a 500 gram pack. - Smart dieting for long life - 100% natural- Free from gluten and cholesterol - Source of fibre - Logos and certifications: FSSAI, Instagram, Facebook, QR code, Swachh Bharat Abhiyan (Clean India Proud Participant), Vegetarian green dot
Chapati
Source: Mintel, 2023
| Company | Shri Viswa Foods |
|---|---|
| Manufacturer | Shri Viswa Foods |
| Brand | Akshaya |
| Category | Bakery |
| Sub-category | Bread and bread products |
| Market | India |
| Store name | Spencer's |
| Store type | Mass merchandise / hypermarket |
| Date published | December 2022 |
| Launch type | New variety / range extension |
| Price in local currency | INR85.00 |
| Price in US dollars | 1.04 |
| Price in Euros | 0.99 |
Akshaya Chapati is now available, and retails in a 550 gram pack containing 10 pieces. - 100% vegetarian - Just heat and serve whole wheat chapati - Jumbo size with approximately 37% more weight - No added preservatives - Made with premium quality ingredients- Hygienic preparation - 100% natural - So easy so tasty - Logos and certifications: Swachh Bharat Abhiyan (Clean India Proud Participant), Vegetarian green dot, FSSAI.
Yellow Split Peas
Source: Mintel, 2023
| Company | Tender Agro Products |
|---|---|
| Manufacturer | Tender Agro Products |
| Brand | Tender Agro Products |
| Category | Fruit and vegetables |
| Sub-category | Vegetables |
| Market | India |
| Store type | Internet / mail order |
| Date published | December 2022 |
| Launch type | New product |
| Price in local currency | INR247.00 |
| Price in US dollars | 3.02 |
| Price in Euros | 2.91 |
Tender Agro Products Toor Dal (Yellow Split Peas) are now available and retail in a 1 kilogram pack. - Pure and natural - 100% quality - Logos and certifications: Vegetarian green dot, Save Trees, Save Earth, Save Water.
Paan Shot Syrup
Source: Mintel, 2023
| Company | Malas Fruit Products |
|---|---|
| Manufacturer | Malas Fruit Products |
| Brand | Mala's |
| Category | Nutritional drinks and other beverages |
| Sub-category | Beverage concentrates |
| Market | India |
| Store type | Convenience store |
| Date published | December 2022 |
| Launch type | New packaging |
| Price in local currency | INR155.00 |
| Price in US dollars | 1.90 |
| Price in Euros | 1.81 |
Mala's Paan Shot Syrup has been repackaged, and retails in a 750 millilitre pack. - Fruitilicious always - Use to make mocktails, cocktails, milkshakes and toppings - Serve with chilled water or milk - To be mixed with water 1:4 or milk 1:5 - Logos and certifications: ISO 22000, ISO 9001, FSSAI, Vegetarian green dot, YouTube, Twitter, Instagram, Facebook
Finely Crafted Gin Cherry Sour
Source: Mintel, 2023
| Company | Arjun Nanda Agro Products |
|---|---|
| Manufacturer | Radiohead Brands |
| Brand | Jimmy's Cocktails |
| Category | Nutritional drinks and other beverages |
| Sub-category | Beverage concentrates |
| Market | India |
| Store type | Supermarket |
| Store address | Secunderabad 500009 |
| Date published | October 2022 |
| Product source | Shopper |
| Launch type | New variety / range extension |
| Price in local currency | INR92.07 |
| Price in US dollars | 1.12 |
| Price in Euros | 1.13 |
Jimmy's Cocktails Finely Crafted Gin Cherry Sour is now available, and retails in a 250 millilitre pack. - Non-alcoholic beverage - With cherry, lime, ginger, apple - Best mixed with Gin - No artificial flavours and sweeter - Premium mixers - Ready to serve - Logos and certifications: FSSAI certified, QR code, Vegetarian green dot
For more information
The Canadian Trade Commissioner Service:
International Trade Commissioners can provide Canadian industry with on-the-ground expertise regarding market potential, current conditions and local business contacts, and are an excellent point of contact for export advice.
More agri-food market intelligence:
International agri-food market intelligence
Discover global agriculture and food opportunities, the complete library of Global Analysis reports, market trends and forecasts, and information on Canada's free trade agreements.
Agri-food market intelligence service
Canadian agri-food and seafood businesses can take advantage of a customized service of reports and analysis, and join our email subscription service to have the latest reports delivered directly to their inbox.
More on Canada's agriculture and agri-food sectors:
Canada's agriculture sectors
Information on the agriculture industry by sector. Data on international markets. Initiatives to support awareness of the industry in Canada. How the department engages with the industry.
For additional information on the Food Ingredients & Health Ingredients (FIHI), please contact:
Kesha Dhruv
Counsellor (Agriculture and Food) and Trade Commissioner
The Consulate General of Canada, Mumbai
Government of Canada
CanadainIndia.Agri@international.gc.ca
Resources
- Euromonitor International. 2023
- Euromonitor International: Naturally Healthy Packaged Food in India, Country Report, January 2023
- Mintel Global New Products Database. 2023
Customized Report Services – Ingredient focus: Products containing cocoa or chocolate chips in selected markets
Global Analysis Report
Prepared by: Erin-Ann Chauvin, Senior Market Analyst
© His Majesty the King in Right of Canada, represented by the Minister of Agriculture and Agri-Food (2023).
Photo credits
All photographs reproduced in this publication are used by permission of the rights holders.
All images, unless otherwise noted, are copyright His Majesty the King in Right of Canada.
To join our distribution list or to suggest additional report topics or markets, please contact:
Agriculture and Agri-Food Canada, Global Analysis1341 Baseline Rd, Tower 5, 3rd floor
Ottawa ON K1A 0C5
Canada
Email: aafc.mas-sam.aac@agr.gc.ca
The Government of Canada has prepared this report based on primary and secondary sources of information. Although every effort has been made to ensure that the information is accurate, Agriculture and Agri-Food Canada (AAFC) assumes no liability for any actions taken based on the information contained herein.
Reproduction or redistribution of this document, in whole or in part, must include acknowledgement of agriculture and agri-food Canada as the owner of the copyright in the document, through a reference citing AAFC, the title of the document and the year. Where the reproduction or redistribution includes data from this document, it must also include an acknowledgement of the specific data source(s), as noted in this document.
Agriculture and Agri-Food Canada provides this document and other report services to agriculture and food industry clients free of charge.