

Note: This report includes forecasting data that is based on baseline historical data.
Executive summary
In 2022, India imported a total of US$353.9 million (58.6 thousand tonnes) of plant-based and animal protein ingredients from the world. The top global suppliers of these protein ingredients to India were China (21.7%), the United States (20%), and Poland (11.4%) in 2022. While, India imported a total of US$1.3 million (87.6 metric tonnes) from Canada over the year.
The market size in terms of volume sales for non-animal derived proteins in India accounted for 1.9 thousand tonnes in 2022, while animal derived proteins totaled 45.7 thousand tonnes. Demand for plant-based protein products with the highest market share was for soy protein concentrate (49.4%), followed by soy protein isolate (36.1%), gluten (11.4%), vegetable proteins (3.1%), and pea protein (0.03%). In general, these plant-based protein ingredients were found in staple packaged food categories such as baked goods (flatbread, cakes), frozen processed poultry/red meat, instant noodle cups; ready meals, salad dressings; dairy products and alternatives (baby formula, powder milk, soy milk), snacks (potato chips, energy bars), and dog food.
In India, there is a high local consumer preference to purchase fresh foods over shelf stable or frozen foods. Thus, demand for meat substitutes or plant-based products remains neglible and is only slowly growing in the amount of options available on grocery shelves within India. Nevertheless, consumers in India are increasingly conscious of the nutritional value of what they eat, whereby 38% (n= 3,000) believe that eating a plant-based diet can help to reduce the risk of diseases. Positive nutritional claims for added/high protein are appearing more among plant-based drink launches - where high protein content is the most important feature that consumers seek for in health dietary attributes within plant-based drinks throughout the Asia Pacific (APAC) region.
In contrast, products in India with a high source of protein ingredients (animal or non-animal derived) registered total sales of US$14.7 million in 2021. As reported by India, proteins by fortified/functional (FF) milk formula were the highest in demand (US$10.3 million), along with proteins by protein/energy bars (US$4.4 million).
Global market overview and trends in the Asia Pacific
Globally, new plant-based, vegan and vegetarian product developments or launches have been growing not only in the food and beverage sector with 66.7% of claims in 2022 and a growth of 3.1% (2015-2021), while such plant-based claims are also becoming popular in the consumer health (50%), and the beauty and personal care segments (74.6%) by a growth of 8.3%. Plant-based eating and alternative proteins has been steadily rising (accelerated by the COVID-19 pandemic) amongst most countries, with the Middle East and Africa (MEA), having a higher propensity towards plant-based eating compared to their global peers.Footnote 1
Health benefits are the main reason for consuming plant-based diets and are mostly found in the plant-based meat substitutes and dairy milk alternatives food categories. Flexitarianism is a major driver for growth in the meatless category (23% trying to limit meat intake vs. 15% trying to follow a plant-based diet), while other motivations to a lesser extent over health reasoning includes climate change, sustainability, environmental, and animal rights/welfare concerns.Footnote 2 Consumers in the APAC region, find that positive nutritional quality claims such as 'added/high protein' content is the most important feature when purchasing plant-based drinks - as cited by nearly half of Chinese responders (48%) at a sample size of 2,936 users.Footnote 3
Plant-based innovation is now reaching all food segments like ingredient replacements in categories such as fish and seafood (ie; Green cuisine's fishless fingers and Nestlé's Vrimp), cheese (ie; Fromagerie Bel and Danone), sugar and chocolate confectionery (ie; Nestlé's vegan Kit Kat), sauces, dressings and condiments, prepared baby food, and ready meals etc. Although, plant-based alternatives are deemed to be healthier compared to their dairy/meat counterparts, the segment must continue to scientifically prove and to protect its "health halo" (not overestimate the healthfulness of their claims) by keeping labels transparent and easy to understand its ingredients through simple, clean benefit claims.Footnote 2
As the segment finds its place in the retail market, claims often used to differentiate its products and pull in more consumers include lab cultivated (pushed by regulatory bodies), animal free (preferred naming nomenclature), and more recently trying to battle the right to advertise as "natural" to compete with consumer concerns possibly found in real meat products such as toxins (mercury) and microplastics, antibiotics, added hormones, along with sustainability (overfishing). This natural claim is mostly used in plant-based beverages to market those products with natural ingredients and focus on top consumer trend claims such as those that have limited or no added sugar (sweetened instead with natural Stevia, Monkfruit, Allulose), free from preservatives, all natural, no artificial sweeteners, good for heart health, no added salt/fat/transfat or hydrogenated oils etc.Footnote 2
According to a Euromonitor survey (n=6,083), the challenge that the plant-based segment faces is that 30% of global consumers report that not enjoying the taste is a reason for not consuming plant-based dairy alternatives (Health and Nutrition Survey, Feb. 2022). In the past, soy beverages more for consumers with lactose intolerance did not taste good, which helped offset the segment's positive perception. However, there are new better tasting options like oat plant-based milks, boosting the segment further and improvements to the quality (possibly health) and natural taste are being addressed through precision fermentation for dairy-free and cell-cultivated meat and seafood products.Footnote 2 Precision-fermented proteins are being developed at a record pace but manufacturers must deliver tangible consumer-facing benefits to match those offered by plant-based alternatives.
To further drive the plant-based, vegan or vegetarian segment, next steps are working towards having more big foodservice companies to take-on these products and help propel the trend towards bringing plant-based products to a more general consumer base. Yum! BrandsFootnote 4 (KFC: Beyond Fried Chicken, Pizza Hut, Taco Bell etc.) were the first International brand to bring meat alternatives to consumers on a wide scale. Burger King pledges to reduce its meat consumption by 50% in the UK by 2030.Footnote 5 While, full-service restaurants (FSRs) are trying to introduce new plant-based options not as a deprivation but something to seek out, vary their menu items and follow healthy eating trends and wider green pushes.Footnote 2
Trade overview – India
In 2022, India imported a total of US$353.9 million (58.6 thousand tonnes) of plant-based and animal protein ingredients from the world (consisting of protein concentrates/substances, peptones and their derivatives, milk and egg or other albumins/albuminates, pea/bean/lentil or vegetable powder, whey proteins and wheat gluten, along with food preparations - that could include plant-based burgers, patties, sausages). This import value has been increasing at a CAGR of 10.1%, especially dried egg albumin (83.5%), casein (38.7%) and milk albumin (32%) between 2018 and 2022. During this time period, pea/bean/lentil or vegetable powder registered a significant decline of 42.5%.
The top global suppliers of plant-based and protein ingredients to India were China (21.7%), the US (20%), and Poland (11.4%) in 2022. While, India imported a total of US$1.3 million (87.6 metric tonnes) from Canada over the year.
| HS code | Description | 2018 | 2019 | 2020 | 2021 | 2022 | CAGR* % 2018-2022 |
|---|---|---|---|---|---|---|---|
| Total - imports from the world | 241.3 | 251.4 | 209.8 | 316.5 | 353.9 | 10.1 | |
| 350220 | Milk albumin, >80% proteins by weight (including concentrates of 2 or more whey proteins) | 47.8 | 63.0 | 44.8 | 119.9 | 145.2 | 32.0 |
| 350400 | Subtotal: Peptones and other protein substances and its derivatives, not elsewhere specified | 34.2 | 34.4 | 39.9 | 57.5 | 79.4 | 23.5 |
| 35040091 | Isolated soya protein | 24.4 | 22.8 | 25.9 | 41.2 | 58.4 | 24.3 |
| 35040010 | Peptones | 3.6 | 4.4 | 6.2 | 5.3 | 6.9 | 17.6 |
| 35040099 | Other proteins and its derivatives, not elsewhere specified | 6.1 | 7.3 | 7.7 | 11.0 | 14.1 | 23.3 |
| 21069099 | Other food preparations[1], not elsewhere specified | 43.9 | 44.5 | 38.6 | 39.8 | 43.6 | −0.2 |
| 210610 | Protein concentrates and textured protein substances | 76.9 | 64.0 | 26.2 | 46.5 | 30.5 | −20.7 |
| 110900 | Wheat gluten, whether or not dried | 19.5 | 15.5 | 16.1 | 17.9 | 24.9 | 6.3 |
| 040410 | Whey and modified whey proteins | 12.9 | 14.3 | 22.2 | 16.5 | 15.9 | 5.3 |
| 350190 | Caseinates and other casein derivatives | 3.9 | 7.6 | 12.4 | 14.0 | 10.5 | 27.9 |
| 350110 | Casein | 0.3 | 3.8 | 7.9 | 1.8 | 1.3 | 38.7 |
| 350219 | Egg albumin, excluding dried | 0.003 | 0.011 | 0.028 | 0.1 | 0.006 | 23.5 |
| 350211 | Egg albumin, dried (for example, sheets, scales, flakes, powders) | 0.1 | 0.7 | 0.2 | 0.5 | 0.0 | 83.5 |
| 350290 | Other albumins, albuminates and its derivatives (excluding egg and milk albumins) | 1.2 | 2.3 | 1.3 | 2.0 | 2.7 | 23.0 |
| 110610 | Flour, meal and powder of peas, beans, lentils and the other dried leguminous vegetables of heading 0713 | 0.6 | 1.3 | 0.3 | 0.1 | 0.0 | −42.5 |
|
Source: Global trade tracker, 2023 *CAGR: Compound Annual Growth Rate 1: Food preparations - All plant-based meat products would be classified under HS 21069099 that is, burgers, patties, sausages, yet also includes other various food preparations, not elsewhere specified (thus, not true representation of segment) |
|||||||
| HS code | Description | 2018 | 2019 | 2020 | 2021 | 2022 | CAGR* % 2018-2022 |
|---|---|---|---|---|---|---|---|
| Total - imports from the world | 53,201 | 54,491 | 52,315 | 62,120 | 58,595 | 2.4 | |
| 350220 | Milk albumin, >80% proteins by weight (including concentrates of 2 or more whey proteins) | 9,032 | 10,816 | 8,041 | 17,275 | 12,868 | 9.3 |
| 350400 | Subtotal: Peptones and other protein substances and its derivatives, not elsewhere specified | 8,178 | 8,036 | 9,062 | 11,701 | 15,573 | 17.5 |
| 35040091 | Isolated soya protein | 6,860 | 6,546 | 7,614 | 10,300 | 13,801 | 19.1 |
| 35040010 | Peptones | 329 | 351 | 420 | 232 | 325 | −0.3 |
| 35040099 | Other proteins and its derivatives, not elsewhere specified | 989 | 1,139 | 1,028 | 1,169 | 1,447 | 10.0 |
| 21069099 | Other food preparations[1], not elsewhere specified | 6,030 | 4,912 | 3,767 | 3,402 | 4,949 | −4.8 |
| 210610 | Protein concentrates and textured protein substances | 8,010 | 6,596 | 2,885 | 4,481 | 2,859 | −22.7 |
| 110900 | Wheat gluten, whether or not dried | 12,045 | 11,121 | 12,463 | 12,359 | 13,320 | 2.5 |
| 040410 | Whey and modified whey proteins | 7,614 | 8,767 | 12,918 | 10,590 | 7,685 | 0.2 |
| 350190 | Caseinates and other casein derivatives | 475 | 1,024 | 1,424 | 1,575 | 1,016 | 20.9 |
| 350110 | Casein | 84 | 572 | 1,078 | 234 | 148 | 15.2 |
| 350219 | Egg albumin, excluding dried | 0 | 1 | 13 | 11 | 0 | −100.0 |
| 350211 | Egg albumin, dried (for example, sheets, scales, flakes, powders) | 6 | 125 | 32 | 63 | 0 | −100.0 |
| 350290 | Other albumins, albuminates and its derivatives (excluding egg and milk albumins) | 138 | 299 | 205 | 290 | 177 | 6.4 |
| 110610 | Flour, meal and powder of peas, beans, lentils and the other dried leguminous vegetables of heading 0713 | 1,589 | 2,222 | 427 | 139 | 0 | −100.0 |
|
Source: Global trade tracker, 2023 *CAGR: Compound Annual Growth Rate 1: Food preparations - All plant-based meat products would be classified under HS 21069099 that is, burgers, patties, sausages, yet also includes other various food preparations, not elsewhere specified (thus, not true representation of segment) |
|||||||
| Country | 2018 | 2019 | 2020 | 2021 | 2022 | CAGR* % 2018-2022 |
|---|---|---|---|---|---|---|
| Total - global suppliers | 241.3 | 251.4 | 209.8 | 316.5 | 353.9 | 10.1 |
| 1. China | 28.4 | 26.3 | 23.9 | 48.9 | 76.7 | 28.2 |
| 2. United States | 122.0 | 120.5 |
56.7 |
72.4 | 70.8 | −12.7 |
| 3. Poland | 2.1 | 3.4 | 4.3 | 28.4 | 40.5 | 109.4 |
| 4. Netherlands | 14.0 | 18.2 | 23.2 | 33.6 | 33.3 | 24.2 |
| 5. New Zealand | 10.3 | 14.6 | 16.3 | 16.5 | 23.0 | 22.2 |
| 6. United Kingdom | 4.0 | 6.7 | 10.2 | 27.9 | 20.7 | 50.9 |
| 7. France | 11.2 | 15.0 | 22.4 | 16.4 | 18.2 | 12.9 |
| 8. Germany | 5.4 | 7.5 | 5.4 | 14.4 | 13.5 | 26.1 |
| 9. Denmark | 4.4 | 4.4 | 2.3 | 8.9 | 6.7 | 11.5 |
| 10. Sri Lanka | 0.6 | 0.1 | 0.2 | 0.043 | 5.6 | 72.1 |
| Subtotal - top 10 suppliers | 202.3 | 216.7 | 165.0 | 267.5 | 309.1 | 11.2 |
| Canada (24th) | 2.2 | 1.5 | 1.1 | 0.9 | 1.3 | −12.0 |
|
Source: Global trade tracker, 2023 *CAGR: Compound Annual Growth Rate |
||||||
| Country | 2018 | 2019 | 2020 | 2021 | 2022 | CAGR* % 2018-2022 |
|---|---|---|---|---|---|---|
| Total - global suppliers | 53,201.2 | 54,490.7 | 52,314.0 | 62,121.3 | 58,594.9 | 2.4 |
| 1. China | 13,693.0 | 13,464.7 | 11,898.7 | 18,007.9 | 23,318.5 | 14.2 |
| 2. United States | 14,792.9 | 14,502.5 | 7,161.2 | 7,812.5 | 6,197.7 | −19.5 |
| 3. Netherlands | 2,681.7 | 2,800.9 | 3,902.5 | 4,904.4 | 4253.0 | 12.2 |
| 4. Poland | 400.3 | 972.2 | 1,349.8 | 4,208.2 | 3910.0 | 76.8 |
| 5. France | 3,745.2 | 4,704.7 | 7,282.5 | 5,403.1 | 3,859.1 | 0.8 |
| 6. New Zealand | 1,986.4 | 2,541.1 | 2,340.5 | 2,476.0 | 2298.0 | 3.7 |
| 7. Germany | 1,962.5 | 2,868.9 | 2057.0 | 4,230.1 | 1,998.5 | 0.5 |
| 8. Iran | 304.1 | 232.8 | 805.0 | 1,108.0 | 1,870.8 | 57.5 |
| 9. United Kingdom | 596.0 | 1,051.3 | 1,072.6 | 2,809.4 | 1,626.1 | 28.5 |
| 10. Lithuania | 500.0 | 238.8 | 911.0 | 375.2 | 1,289.2 | 26.7 |
| Subtotal - top 10 suppliers | 93,863.2 | 97,868.3 | 91,094.9 | 113,456.1 | 109,215.8 | 3.9 |
| Canada (32) | 635.4 | 267.5 | 150.4 | 111.5 | 87.6 | −39.1 |
|
Source: Global trade tracker, 2023 *CAGR: Compound Annual Growth Rate |
||||||
Canada's performance
Canada was India's 24th largest supplier for plant-based and protein ingredients, representing 0.4% market share at Can$1.6 million in 2022. India's imports from Canada have declined by 12.6% (2018-2022). Top plant-based or protein ingredients that Canada supplied to India were milk albumin, >80% proteins by weight (including concentrates of 2 or more whey proteins) (HS: 350220) at Can$709.6 thousand, followed by protein concentrates and textured protein substances (HS: 210610) at Can$707.6 thousand, and other food preparations, not elsewhere specified that may contain plant-based or vegetarian meat products (HS: 21069099) at Can$212.4 thousand in 2022.
Peptones and other protein substances and their derivatives, not elsewhere specified (HS: 350400) has picked up over the years increasing by a CAGR of 604.8% (2018-2022); while pea/beans/lentil and other leguminous vegetable flour, meal and powder, along with other plant-based food preparations declined by a CAGR of 78.6% and 38.1%, respectively.
| HS code | Description | 2018 | 2019 | 2020 | 2021 | 2022 | CAGR* % 2018-2022 |
|---|---|---|---|---|---|---|---|
| Total - imports from Canada | 2,798.6 | 1,974.1 | 1,508.5 | 1,114.7 | 1,629.6 | −12.6 | |
| 350220 | Milk albumin, >80% proteins by weight (including concentrates of 2 or more whey proteins) | 565.1 | 283.8 | 828.5 | 228.7 | 709.6 | 5.9 |
| 210610 | Protein concentrates and textured protein substances | 409.9 | 1,268.3 | 285.6 | 699.7 | 707.6 | 14.6 |
| 21069099 | Other food preparations[1], not elsewhere specified | 1,442.9 | 340.3 | 394.3 | 186.3 | 212.4 | −38.1 |
| 350400 | Peptones and other protein substances and their derivatives, not elsewhere specified | 0.0 | 0.143 | 0.346 | 0.059 | 50.1 | 604.8 |
| 110610 | Flour, meal and powder of peas, beans, lentils and the other dried leguminous vegetables of heading 0713 | 380.8 | 81.7 | 0.0 | 0.0 | 0.0 | −78.6 |
|
Source: Global trade tracker, 2023 *CAGR: Compound Annual Growth Rate 1: Food preparations - all plant-based meat products are classified under HS 210690 that is, burgers, patties, sausages, yet also includes other various food preparations, not elsewhere specified (thus, not true representation of segment) |
|||||||
| HS code | Description | 2018 | 2019 | 2020 | 2021 | 2022 | CAGR* % 2018-2022 |
|---|---|---|---|---|---|---|---|
| Total - imports from Canada | 635,412 | 267,510 | 150,354 | 111,494 | 86,724 | −39.2 | |
| 350220 | Milk albumin, >80% proteins by weight (including concentrates of 2 or more whey proteins) | 99,920 | 32,980 | 126,106 | 45,155 | 31,700 | −24.9 |
| 210610 | Protein concentrates and textured protein substances | 31,740 | 142,185 | 14,964 | 60,639 | 48,834 | 11.4 |
| 21069099 | Other food preparations[1], not elsewhere specified | 72,313 | 18,863 | 9,284 | 5,700 | 6,190 | −45.9 |
| 350400 | Peptones and other protein substances and their derivatives, not elsewhere specified | 0 | 1 | 1 | 0 | 900 | 865.5 |
| 110610 | Flour, meal and powder of peas, beans, lentils and the other dried leguminous vegetables of heading 0713 | 431,439 | 73,482 | 0 | 0 | 0 | −100.0 |
|
Source: Global trade tracker, 2023 *CAGR: Compound Annual Growth Rate 1: Food preparations - all plant-based meat products are classified under HS 210690 that is, burgers, patties, sausages, yet also includes other various food preparations, not elsewhere specified (thus, not true representation of segment) |
|||||||
Market sizes
In 2022, the market size of animal derived protein ingredients in India registered a volume of 45.7 thousand tonnes, equivalent to an historical volume sales CAGR of 9.0% (2017-2022) and a forecast CAGR of 9.6% (2022-2027) set to reach 72.4 thousand tonnes by 2027. In 2022, the majority of the animal derived protein market consisted of 88.2% of caseinates (40.3 thousand tonnes), followed by 5.6% of whey protein concentrate (2.6 thousand tonnes) and 5.1% of gelatin (2.3 thousand tonnes); smaller market sizes being hydrolysed keratins, whey protein isolates, milk protein concentrates, egg whites, casein, albumin, and milk protein isolates. Historically, volume sales of egg white had the largest compound growth of 11.4%, followed by casein (10.9%) and caseinates (9.7%).
In 2022, demand in India for animal derived protein ingredients in terms of volume was highest within packaged food categories such as dairy products at 85.6% (39.1 thousand tonnes), especially for protein found in yogurt and sour milk at 80.1% within its category. Snacks were the second highest category in demand for animal derived protein ingredients by 6.9% (3.1 thousand tonnes), specifically within sugar confectionery (3.3%), potato chips (1.8%) and chocolate confectionery (1.6%) products in 2022. Staple foods were the next in demand at 1.8% (809.3 tonnes) mostly for baked cake goods, followed by cooking ingredients and meals at 0.4% (164.9 tonnes) mostly within the sauces, dressings and condiments sub-category.
| Category | 2017 | 2022 | CAGR* % 2017-2022 | 2023 | 2027 | CAGR* % 2022-2027 |
|---|---|---|---|---|---|---|
| Total - animal derived proteins | 29,724.9 | 45,689.2 | 9.0 | 50,604.0 | 72,353.0 | 9.6 |
| Albumin | 11.8 | 12.0 | 0.3 | 12.3 | 13.6 | 2.5 |
| Casein | 20.9 | 35.1 | 10.9 | 38.5 | 53.4 | 8.8 |
| Caseinates | 25,406.5 | 40,291.0 | 9.7 | 44,885.6 | 65,326.9 | 10.1 |
| Egg white | 37.4 | 64.3 | 11.4 | 69.4 | 89.2 | 6.8 |
| Gelatin | 1,951.4 | 2,314.4 | 3.5 | 2,426.2 | 2,849.8 | 4.2 |
| Milk protein concentrates | 111.0 | 150.3 | 6.2 | 162.6 | 206.5 | 6.6 |
| Milk protein isolate | 1.7 | 2.3 | 6.2 | 2.5 | 3.2 | 6.8 |
| Whey protein concentrate | 1,961.6 | 2,579.7 | 5.6 | 2,760.5 | 3,543.6 | 6.6 |
| Whey protein isolate | 222.7 | 240.2 | 1.5 | 246.2 | 266.8 | 2.1 |
| Hydrolysed keratins | 232.5 | 273.9 | 3.3 | 283.0 | 318.0 | 3.0 |
|
Source: Euromonitor International, 2023 *CAGR: Compound Annual Growth Rate |
||||||
| Category | Data type | 2017 | 2022 | CAGR* % 2017-2022 | 2023 | 2027 | CAGR* % 2022-2027 |
|---|---|---|---|---|---|---|---|
| Total - packaged food (animal derived proteins) | Total volume | 27,499.5 | 43,231.6 | 9.5 | 48,101.4 | 69,672.8 | 10.0 |
| % breakdown | 92.5 | 94.6 | 0.4 | 95.1 | 96.3 | 0.4 | |
| Snacks: | Total volume | 2,538.5 | 3,134.7 | 4.3 | 3,300.0 | 3,956.9 | 4.8 |
| % breakdown | 8.5 | 6.9 | −4.1 | 6.5 | 5.5 | −4.4 | |
| Chocolate confectionery | Total volume | 671.4 | 744.2 | 2.1 | 778.2 | 908.2 | 4.1 |
| % breakdown | 2.3 | 1.6 | −7.0 | 1.5 | 1.3 | −4.1 | |
| Sugar confectionery | Total volume | 1,254.4 | 1,510.0 | 3.8 | 1,572.9 | 1,793.9 | 3.5 |
| % breakdown | 4.2 | 3.3 | −4.7 | 3.1 | 2.5 | −5.4 | |
| Ice cream | Total volume | 8.6 | 7.0 | −4.0 | 8.1 | 12.9 | 13.0 |
| Potato chips | Total volume | 582.4 | 836.9 | 7.5 | 900.7 | 1,185.8 | 7.2 |
| % breakdown | 2.0 | 1.8 | −2.1 | 1.8 | 1.6 | −2.3 | |
| Puffed snacks | Total volume | 20.6 | 34.5 | 10.9 | 37.9 | 52.2 | 8.6 |
| % breakdown | 0.1 | 0.1 | 0.0 | 0.1 | 0.1 | 0.0 | |
| Tortilla chips | Total volume | 0.7 | 1.4 | 14.9 | 1.6 | 2.7 | 14.0 |
| Protein/energy bars | Total volume | 0.3 | 0.5 | 10.8 | 0.6 | 1.1 | 17.1 |
| Dairy products and alternatives: | Total volume | 24,130.4 | 39,122.7 | 10.1 | 43,768.9 | 64,457.9 | 10.5 |
| % breakdown | 81.2 | 85.6 | 1.1 | 86.5 | 89.1 | 0.8 | |
| Baby milk formula | Total volume | 525.4 | 548.3 | 0.9 | 547.1 | 534.6 | −0.5 |
| % breakdown | 1.8 | 1.2 | −7.8 | 1.1 | 0.7 | −10.2 | |
| Processed cheese (excluding spreadable) | Total volume | 270.8 | 418.9 | 9.1 | 466.3 | 674.3 | 10.0 |
| % breakdown | 0.9 | 0.9 | 0.0 | 0.9 | 0.9 | 0.0 | |
| Yogurt and sour milk | Total volume | 21,915.6 | 36,598.5 | 10.8 | 41,125.5 | 61,312.5 | 10.9 |
| % breakdown | 73.7 | 80.1 | 1.7 | 81.3 | 84.7 | 1.1 | |
| Coffee Whiteners | Total volume | 887.1 | 980.1 | 2.0 | 1,038.5 | 1,274.7 | 5.4 |
| % breakdown | 3.0 | 2.1 | −6.9 | 2.1 | 1.8 | −3.0 | |
| Condensed milk | Total volume | 531.6 | 577.0 | 1.7 | 591.6 | 661.9 | 2.8 |
| % breakdown | 1.8 | 1.3 | −6.3 | 1.2 | 0.9 | −7.1 | |
| Cooking ingredients and meals: | Total volume | 115.1 | 164.9 | 7.5 | 173.5 | 205.4 | 4.5 |
| % breakdown | 0.4 | 0.4 | 0.0 | 0.3 | 0.3 | −5.6 | |
| Ready meals | Total volume | 32.4 | 55.5 | 11.4 | 59.3 | 72.0 | 5.3 |
| % breakdown | 0.1 | 0.1 | 0.0 | 0.1 | 0.1 | 0.0 | |
| Other sauces, dressings and condiments | Total volume | 82.7 | 109.4 | 5.8 | 114.2 | 133.4 | 4.0 |
| % breakdown | 0.3 | 0.2 | −7.8 | 0.2 | 0.2 | 0.0 | |
| Staple foods: | Total volume | 715.5 | 809.3 | 2.5 | 859.0 | 1,052.5 | 5.4 |
| % breakdown | 2.4 | 1.8 | −5.6 | 1.7 | 1.5 | −3.6 | |
| Baked cake goods | Total volume | 709.9 | 799.7 | 2.4 | 848.1 | 1,034.4 | 5.3 |
| % breakdown | 2.4 | 1.8 | −5.6 | 1.7 | 1.4 | −4.9 | |
| Processed frozen potatoes | Total volume | 5.6 | 9.5 | 11.1 | 10.9 | 18.1 | 13.8 |
|
Source: Euromonitor, 2023 *CAGR: Compound Annual Growth Rate |
|||||||
In 2022, the market size of plant-based protein ingredients (non-animal derived) in India registered a volume of 1.9 thousand tonnes, equivalent to an historical volume sales CAGR of 8.0% (2017-2022) and a forecast CAGR of 7.7% (2022-2027) set to reach 2.8 thousand tonnes by 2027. In 2022, 49.4% of non-animal derived protein ingredients consisted of soy protein concentrate (953.8 tonnes), followed by 36.1% of soy protein isolate (696.2 tonnes), 11.4% of gluten (219.5 tonnes), 3.1% of vegetable proteins (59.0 tonnes), and 0.03% pea protein (0.6 tonnes). Historically, volume sales of pea protein has been increasing with the largest compound growth of 14.9%, followed by soy protein concentrate (9.3%) and gluten (7.9%). Noting that protein hydrolysates (3.1 thousand tonnes) and other proteins (1.7 thousand tonnes) were not included in the protein ingredients total since these categories may not necessarily be all inclusively non-animal derived. However, typically these proteins do come from plant, pulse or cereal sources.
| Category | 2017 | 2022 | CAGR* % 2017-2022 | 2023 | 2027 | CAGR* % 2022-2027 |
|---|---|---|---|---|---|---|
| Total - non-animal derived proteins[1] | 1,313.5 | 1,929.2 | 8.0 | 2,098.8 | 2,801.8 | 7.7 |
| Gluten | 150.1 | 219.5 | 7.9 | 239.4 | 315.1 | 7.5 |
| Pea protein | 0.3 | 0.6 | 14.9 | 0.7 | 1.2 | 14.9 |
| Soy protein concentrate | 612.2 | 953.8 | 9.3 | 1,051.2 | 1,494.9 | 9.4 |
| Soy protein isolate | 501.8 | 696.2 | 6.8 | 746.4 | 921.4 | 5.8 |
| Vegetable proteins | 49.0 | 59.0 | 3.8 | 61.2 | 69.3 | 3.3 |
| Protein hydrolysates[1] | 1,943.5 | 3,149.3 | 10.1 | 3,445.6 | 4,710.0 | 8.4 |
| Other proteins[1] | 1,744.0 | 3,737.3 | 16.5 | 4,192.9 | 6,549.6 | 11.9 |
|
Source: Euromonitor International, 2023 *CAGR: Compound Annual Growth Rate 1: Non-animal derived proteins - Note that this category is not all inclusive since non-animal derived proteins may be used in the more ambiguous categories "Hydrolysed Keratins", "Protein Hydrolysates" and "Other Proteins" (not including in total volume). Typically, however, these proteins come from plant, pulse or cereal sources. |
||||||
In 2022, demand in India for plant-based protein ingredients in terms of volume was highest within packaged food categories such as staple food products at 63.1% (1.2 thousand tonnes), especially for added protein found in frozen processed poultry/red meat at 57.5% and packaged cakes at 3.9% within its category. Cooking ingredients and meals were the second highest category in demand for non-animal derived protein ingredients at 16% (308.4 tonnes), specifically within salad dressings (13.1%), and ready meals (2.9%) products. Dairy products and alternatives were the next in demand at 10.4% (199.7 tonnes) mostly for powder milk (6.2%), special baby powder milk formula (3.2%), and plant-based soy milk (1.2%); followed by the snacks category at 6.8% (130.8 tonnes) mostly for protein energy bars (6.4%) and salty potato chips (0.4%); lastly in demand was dog food at 1.2% (22.3 tonnes) in 2022.
| Category | Data type | 2017 | 2022 | CAGR* % 2017-2022 | 2023 | 2027 | CAGR* % 2022-2027 |
|---|---|---|---|---|---|---|---|
| Total - packaged food (non-animal derived proteins) | Total volume | 1,252.5 | 1,856.2 | 8.2 | 2,023.4 | 2,717.7 | 7.9 |
| % breakdown | 95.4 | 96.2 | 0.2 | 96.4 | 97.0 | 0.2 | |
| Snacks: | Total volume | 64.4 | 130.8 | 15.2 | 148.6 | 250.6 | 13.9 |
| % breakdown | 4.9 | 6.8 | 6.8 | 7.1 | 8.9 | 5.5 | |
| Salty potato chips | Total volume | 5.6 | 8.0 | 7.4 | 8.6 | 11.3 | 7.2 |
| % breakdown | 0.4 | 0.4 | 0.0 | 0.4 | 0.4 | 0.0 | |
| Protein energy bars | Total volume | 58.9 | 122.8 | 15.8 | 140.0 | 239.2 | 14.3 |
| % breakdown | 4.5 | 6.4 | 7.3 | 6.7 | 8.5 | 5.8 | |
| Dairy products and alternatives: | Total volume | 144.7 | 199.7 | 6.7 | 209.1 | 243.1 | 4.0 |
| % breakdown | 11.0 | 10.4 | −1.1 | 10.0 | 8.7 | −3.5 | |
| Special baby powdered milk formula | Total volume | 46.4 | 61.4 | 5.8 | 66.4 | 83.9 | 6.4 |
| % breakdown | 3.5 | 3.2 | −1.8 | 3.2 | 3.0 | −1.3 | |
| Powder milk | Total volume | 82.0 | 119.0 | 7.7 | 123.3 | 139.3 | 3.2 |
| % breakdown | 6.2 | 6.2 | 0.0 | 5.9 | 5.0 | −4.2 | |
| Plant-based soy milk | Total volume | 16.3 | 19.3 | 3.4 | 19.5 | 20.0 | 0.7 |
| % breakdown | 1.2 | 1.0 | −3.6 | 0.9 | 0.7 | −6.9 | |
| Cooking ingredients and meals: | Total volume | 164.7 | 308.4 | 13.4 | 349.6 | 562.0 | 12.8 |
| % breakdown | 12.5 | 16.0 | 5.1 | 16.7 | 20.1 | 4.7 | |
| Ready meals | Total volume | 34.9 | 56.5 | 10.1 | 62.3 | 88.7 | 9.4 |
| % breakdown | 2.7 | 2.9 | 1.4 | 3.0 | 3.2 | 2.0 | |
| Salad dressings | Total volume | 129.7 | 252.0 | 14.2 | 287.3 | 473.3 | 13.4 |
| % breakdown | 9.9 | 13.1 | 5.8 | 13.7 | 16.9 | 5.2 | |
| Staple foods: | Total volume | 878.7 | 1,217.3 | 6.7 | 1,316.0 | 1,662.0 | 6.4 |
| % breakdown | 66.9 | 63.1 | −1.2 | 62.7 | 59.3 | −1.2 | |
| Baked goods: | Total volume | 58.5 | 80.1 | 6.5 | 87.3 | 113.4 | 7.2 |
| % breakdown | 4.5 | 4.2 | −1.4 | 4.2 | 4.0 | −1.0 | |
| Packaged flat bread | Total volume | 3.4 | 5.3 | 9.3 | 6.4 | 10.6 | 14.9 |
| % breakdown | 0.3 | 0.3 | 0.0 | 0.3 | 0.4 | 5.9 | |
| Packaged cakes | Total volume | 55.2 | 74.8 | 6.3 | 80.9 | 102.8 | 6.6 |
| % breakdown | 4.2 | 3.9 | −1.5 | 3.9 | 3.7 | −1.0 | |
| Frozen processed poultry / red meat | Total volume | 799.9 | 1,108.7 | 6.7 | 1,196.5 | 1,496.7 | 6.2 |
| % breakdown | 60.9 | 57.5 | −1.1 | 57.0 | 53.4 | −1.5 | |
| Noodles - instant cups | Total volume | 20.3 | 28.5 | 7.0 | 32.2 | 51.9 | 12.7 |
| % breakdown | 1.5 | 1.5 | 0.0 | 1.5 | 1.9 | 4.8 | |
| Pet - dog food: | Total volume | 16.7 | 22.3 | 6.0 | 23.2 | 26.0 | 3.1 |
| % breakdown | 1.3 | 1.2 | −1.6 | 1.1 | 0.9 | −5.6 | |
|
Source: Euromonitor, 2023 *CAGR: Compound Annual Growth Rate |
|||||||
Retail sales
Demand for meat substitutes remains negligible in India. There is a high local consumer preference to purchase fresh foods over shelf stable or frozen foods. Additionally, there is limited availability and marketing regarding alternative products and consumers in India are less aware about their alternative options. Meat substitute start-ups in India are mainly restricted to online shopping from players such as Urban Platter, Vezlay, Wakao Foods, Good Dot and VegetaGold.Footnote 6
In 2022, the strong return of avian influenza in India has significantly reduced the availability of poultry to be processed in multiple states including Bihar, Maharashtra and Kerala. Also, with a rise in feed prices for chickens, demand slowed for processed poultry in particular and as a result, caused unit prices of processed meat to increase amid lower livestock and high inflation.Footnote 6 Albeit, value sales of processed meat continued to record double digit annual growth by 13.2% moving from US$217.9 million in 2021 to US$246.7 million in 2022.
In comparison, products with a high source of protein ingredients (animal or non-animal derived) registered total sales of US$14.7 million in 2021. Generally, products that contain a high source of protein ingredients include naturally healthy (NH) fruit and nut bars, fortified/functional (FF), organic and NH cereal bars; FF protein/energy bars, FF milk (powder, flavoured drinks, formula), and FF yogurt. As reported by India, proteins by FF milk formula were the highest in demand (US$10.3 million) and proteins by protein/energy bars (US$4.4 million).
| Category | 2016 | 2017 | 2018 | 2019 | 2020 | 2021 |
|---|---|---|---|---|---|---|
| Total - processed meat | 118.2 | 133.9 | 151.9 | 170.4 | 195.9 | 217.9 |
| Total - high source of protein ingredients | 9.3 | 10.3 | 11.6 | 13.7 | 14.2 | 14.7 |
| Proteins by fortified / functional milk formula | 8.7 | 9.1 | 9.7 | 10.9 | 10.5 | 10.3 |
| Proteins by fortified / functional
protein/energy bars |
0.6 | 1.1 | 1.9 | 2.8 | 3.7 | 4.4 |
| Source: Euromonitor International, 2023 | ||||||
| Category | Annual growth % 2021/2020 | CAGR* % 2016-2021 | Total growth % 2016-2021 |
|---|---|---|---|
| Total - processed meat | 11.2 | 13.0 | 84.3 |
| Total - high source of protein ingredients | 3.5 | 9.6 | 58.1 |
| Proteins by fortified / functional milk formula | −1.9 | 3.4 | 18.4 |
| Proteins by fortified / functional protein/energy bars | 18.9 | 49.0 | 633.3 |
|
Source: Euromonitor International, 2023 *CAGR: Compound Annual Growth Rate |
|||
Competitive landscape
In 2021, packaged food companies (brands) for animal/non-animal derived high in protein ingredients products (FF milk formula, FF protein/energy bars) in India included the Bombay Oxygen Corporation Ltd. (Lactodex) at a market share of 70.0% (US$10.3 million), Sproutlife Foods Pvt. Ltd. (Yoga Bar) at 27.7% (US$4.1 million), 365 Build Technologies Pvt. Ltd. (HYP Protein bar) at 1.3% (US$0.2 million), and General Mills Inc. (Nature Valley) at 1.0% (US$0.2 million).
| Company | Top brand | Retail sales (US$ million) | Market share in 2021 |
|---|---|---|---|
| Bombay Oxygen Corporation Ltd. | Lactodex | 10.3 | 70.0 |
| Sproutlife Foods Pvt. Ltd. | Yoga Bar | 4.1 | 27.7 |
| 365 Build Technologies Pvt. Ltd. | HYP Protein bar | 0.2 | 1.3 |
| General Mills Inc. | Nature Valley | 0.2 | 1.0 |
| Total - proteins by fortified / functional protein / energy bars or milk formula products | 14.7 | 100.0 | |
| Source: Euromonitor International, 2023 | |||
New product launches in India
Mintel indicated that there were 4,246 new protein food (3,372), drink (668), and pet food (206) products launched in India's grocery retailer outlets (including new variety/range extension, packaging, formulation or relaunched) between the period of January 2018 and May 31st, 2023: which consisted of 14.1% claims suitable for plant-based (599) and 91.2% of high/added protein (3,874) products. [Note: each product can contain more than one of these claims]
Total food, drink and pet food product item count (4,246) (January 2018 to May 2023)
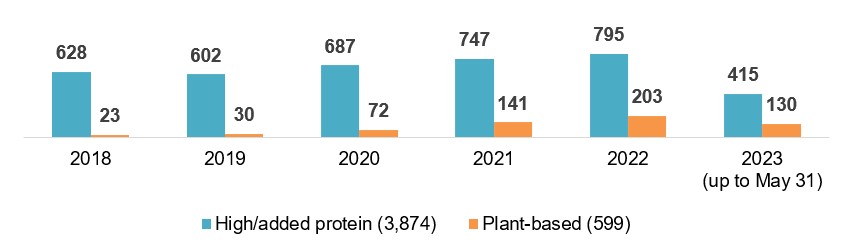
Description of above image
| 2018 | 2019 | 2020 | 2021 | 2022 | 2023 (up to May 31) | |
|---|---|---|---|---|---|---|
| High/added protein (3,874) | 628 | 602 | 687 | 747 | 795 | 415 |
| Plant-based (599) | 23 | 30 | 72 | 141 | 203 | 130 |
Source: Mintel, 2023
Meat substitute launches in Asia with meat and poultry flavours are surging ahead in the retail market. Asian consumers are interested in reducing their meat intake mostly as a dietary staple, and many want to enjoy the same meat-like taste and texture of meat. Asian consumers are also keen on having a diverse range of meat flavour-inspired options (including fauna - dark fruit, light tannins wine flavours), along with infused flavours like pairing umami vegetables and seaweed with plant-based meat substitutes.Footnote 7
The APAC region seek health dietary attributes, which are linked to longevity and disease prevention. Meat substitute brands are highlighting high protein, low/no/reduced cholesterol content, added fibre and other better-for-you or nutritional beneficial claims; while reducing artificial ingredients. Consumers in India are increasingly conscious of the nutritional value of what they eat, whereby 38% (sample size= 3,000) believe that eating a plant-based diet can help to reduce the risk of diseases.Footnote 7
Leading parent companies launching plant-based or high/added protein food and drink products (1,257) in India between Q2-2022 and Q2-2023 were Happilo International (34), Bright Lifecare (33), Hector Beverages (17), Istore Direct Trading (17), Flogre International (16), and Naturell (15). New brands appearing for the first time launched in the Indian market within the last 6 months, included Nutraj Snackrite (sports mix), Brave Nutrition Series Your Starter Protein (vanilla flavoured protein powder), The Naturik Co. (oats Cheela mix) and Desi Nutri (multi millet health drink mix).
Top categories for plant-based or high/added protein claims in India were snacks (30%), nutritional drinks and other beverages (14.5%), bakery (10%), breakfast cereals (9%), and dairy (7%) between January 2018 and May 2023. New baby food ingredients appearing within the last 12 months included jasmine, lotus root, starches enzyme treated, yellow mustard seed, dill seed, chlorella flour, lemon mint and Kakvi (jaggery or gur, unrefined sweetener). The fastest growing baby food flavours were Masala (+500%), berry (+300%), peppercorn, hazelnut, barbecue, and Cardamom (+200%) between Q2-2021 and Q2-2023.
Between January 2018 and May 2023, top claims for high/added and/or plant-based protein food and beverage (not including pet food) product launches include vegetarian, high/added protein, no additives/preservatives, high/added fibre, free from added/artificial preservatives, low/no/reduced allergen, gluten free, all natural product, functional - energy, low/no/reduced cholesterol, and plant-based. Top growing plant-based and high in protein claims were palm oil free (+1100%), hormone free (+800%), Kosher (+400%), time/speed (+288%), and ethical - human (+250%) between Q1-2022 and Q1-2023. Meanwhile, declining claims by −100% were male, carbon neutral, ethical - biodegradable, functional - beauty benefits, and functional - eye health (−83%) during the same period.
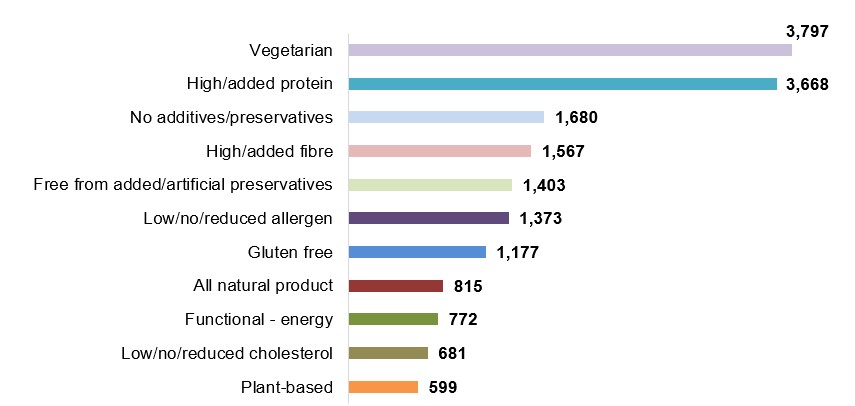
Description of above image
- Vegetarian: 3,797
- High / added protein: 3,668
- No additives / preservatives: 1,680
- High / added fibre: 1,567
- Free from added / artificial preservatives: 1,403
- Low / no / reduced allergen: 1,373
- Gluten free: 1,177
- All natural product: 815
- Functional - energy: 772
- Low / no / reduced cholesterol: 681
- Plant-based: 599
Total item count (excluding pet food): 4,040
Source: Mintel, 2023
| Product attributes | Yearly launch - item count | ||||||
|---|---|---|---|---|---|---|---|
| 2018 | 2019 | 2020 | 2021 | 2022 | 2023 | Total | |
| Yearly product launches | 616 | 579 | 696 | 785 | 890 | 474 | 4,040 |
| Top launch types | |||||||
| New product | 291 | 272 | 447 | 434 | 415 | 224 | 2,083 |
| New variety / range extension | 132 | 121 | 131 | 182 | 267 | 154 | 987 |
| New packaging | 154 | 148 | 102 | 144 | 164 | 92 | 804 |
| Relaunch | 37 | 30 | 15 | 24 | 41 | 3 | 150 |
| New formulation | 2 | 8 | 1 | 1 | 3 | 1 | 16 |
| Top sub-categories | |||||||
| Snacks | 131 | 165 | 229 | 232 | 320 | 143 | 1,220 |
| Nutritional drinks and other beverages | 140 | 93 | 88 | 132 | 92 | 42 | 587 |
| Bakery | 82 | 64 | 71 | 67 | 76 | 46 | 406 |
| Breakfast cereals | 59 | 51 | 59 | 72 | 80 | 42 | 363 |
| Dairy | 58 | 44 | 55 | 47 | 40 | 41 | 285 |
| Top five companies / parent | |||||||
| Bright Lifecare | 22 | 7 | 7 | 15 | 22 | 13 | 86 |
| SproutLife Foods Private | 5 | 6 | 21 | 5 | 13 | 1 | 51 |
| Happilo International | 4 | 6 | 4 | 7 | 11 | 19 | 51 |
| Naturell | 9 | 18 | 0 | 6 | 14 | 2 | 49 |
| BigBasket - Supermarket Grocery Supplies | 13 | 2 | 17 | 7 | 6 | 1 | 46 |
| Top five brands | |||||||
| Urban Platter | 3 | 7 | 7 | 11 | 19 | 5 | 52 |
| Happilo | 3 | 5 | 5 | 5 | 10 | 17 | 45 |
| Yoga Bar | 5 | 6 | 13 | 5 | 13 | 3 | 45 |
| True Elements | 4 | 4 | 2 | 12 | 5 | 2 | 29 |
| Epigamia | 6 | 3 | 9 | 4 | 1 | 5 | 28 |
| Import status (if reported) | |||||||
| Not imported | 144 | 179 | 194 | 285 | 361 | 182 | 1,345 |
| Imported | 24 | 17 | 7 | 18 | 20 | 5 | 91 |
| Location of manufacture | |||||||
| India | 144 | 179 | 194 | 285 | 361 | 182 | 1,345 |
| United States | 6 | 7 | 3 | 2 | 5 | 0 | 23 |
| Thailand | 6 | 2 | 0 | 3 | 1 | 1 | 13 |
| Bhutan | 5 | 2 | 1 | 0 | 0 | 0 | 8 |
| Italy | 0 | 1 | 0 | 3 | 2 | 1 | 7 |
| Top five flavours (including blend) | |||||||
| Unflavoured / plain | 268 | 215 | 308 | 338 | 348 | 194 | 1,671 |
| Chocolate | 72 | 51 | 38 | 66 | 50 | 28 | 305 |
| Vanilla / vanilla Bourbon / vanilla Madagascar | 25 | 13 | 11 | 11 | 20 | 5 | 85 |
| Peanut butter | 6 | 16 | 13 | 18 | 20 | 10 | 83 |
| Roasted/toasted | 6 | 11 | 19 | 9 | 24 | 5 | 74 |
| Top package types | |||||||
| Flexible (stand-up pouch / sachet) | 388 | 384 | 435 | 510 | 637 | 334 | 2,688 |
| Jar | 100 | 100 | 122 | 153 | 119 | 61 | 655 |
| Carton | 36 | 29 | 39 | 23 | 28 | 18 | 173 |
| Can | 23 | 18 | 28 | 25 | 30 | 6 | 130 |
| Tub | 28 | 13 | 20 | 16 | 17 | 18 | 112 |
| Source: Mintel; Global New Product Database, 2023 | |||||||
Examples of new products
100% Plant-based Spicy Fingers
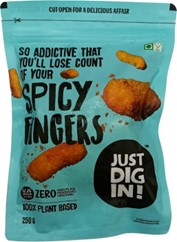
Source: Mintel, 2023
| Company | Novolutions Food & Beverage |
|---|---|
| Manufacturer | SFP Foods, India |
| Brand | Just Dig In! |
| Category | Meat substitutes |
| Market | India |
| Related claims | No additives / preservatives, low / no / reduced cholesterol / transfat, vegan / no animal ingredients, plant-based |
| Related ingredients | Textured vegetable protein (soya), wheat gluten, breadcrumbs, natural flavouring seasoning, Methyl cellulose binder mix and gaur gum (stabilizers), refined coconut, sesame seed and palm oil |
| Store name | Modern Bazaar |
| Store type | Department store |
| Date published | July 2022 |
| Launch type | New product |
| Price in US dollars | 3.85 |
This 100% Plant Based Spicy Fingers product contains 12.2 grams protein per 100 gram. This vegetarian and vegan product is free from trans fat, MSG, preservatives and cholesterol, and retails in a 250 gram pack.
Sports Mix
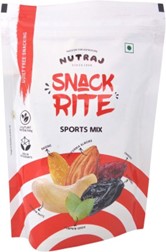
Source: Mintel, 2023
| Company | VKC Nuts |
|---|---|
| Brand | Nutraj Snackrite |
| Category | Snacks, snack mixes |
| Market | India |
| Related claims | No additives / preservatives, low / no / reduced cholesterol, high / added fibre, vegetarian, gluten-free, antioxidant, high / added protein, on-the-go, plant based |
| Store name | D-Mart, Bangalore 560062 |
| Store type | Supermarket |
| Date published | June 2023 |
| Launch type | New product |
| Price in US dollars | 1.81 |
This product retails in a 150 gram pack. Guilt free snacking at 6.5 grams plant protein per 100 gram of product. Rich in antioxidants, fibre, plant protein, minerals and vitamins. Contains raisins, California almond, cranberry, blueberry, pumpkin seeds and cashew nuts. Free from GMO, gluten, cholesterol and added preservatives. Recyclable pack with vegetarian green dot logo. Also, available in varieties such as nuts and dry fruit, roasted and salted almond, cranberry and nuts trio and nutty corn mixes.
Protein Rich Ragi Cheela Mix
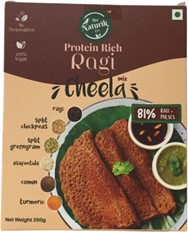
Source: Mintel, 2023
| Company | Wholesoul Consumer Products |
|---|---|
| Manufacturer | Samasta Foods |
| Brand | The Naturik Co. |
| Category | Bakery, baking ingredients and mixes |
| Market | India, not imported |
| Related claims | No additives / preservatives, vegetarian, high / added protein, time / speed, ease of use, vegan / no animal |
| Store name | JioMart |
| Store type | Internet / mail order |
| Date published | June 2023 |
| Launch type | New product |
| Price in US dollars | 1.80 |
This product retails in a 250 gram pack. No preservatives: 100% vegan, 81% ragi pulses. Comprises ragi, split chickpeas, split green gram, asafoetida, cumin and turmeric. Convenient food options. Blend of savour and well-being for everyone who wants a nutritious, protein rich meal ready in quick three minutes. Recyclable pack with logos and certifications: FSSAI, Vegetarian green dot. Also, available in oats or multigrain Cheela mix.
Multi Millet Health Drink Mix
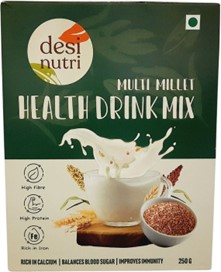
Source: Mintel, 2023
| Company | Skandhanshi Agro Foods |
|---|---|
| Manufacturer | Adithi Millets & Organics |
| Brand | Desi Nutri |
| Category | Nutritional drinks and meal replacement drinks |
| Market | India, not imported |
| Related claims | High / added fibre, vegetarian, functional – cardiovascular, immune system, energy and slimming, high / added protein, ease of use, vegan / no animal ingredients |
| Store name | Ushodaya Supper Market |
| Store type | Supermarket, Hyderabad 500007 |
| Date published | June 2023 |
| Launch type | New product |
| Price in US dollars | 1.80 |
This drink mix retails in a 250 gram pack. High in fibre and protein. Rich in iron and calcium. Balances blood sugar, improves immunity. A wholesome mix of essential millets, pulses and cereals. Easy to prepare, energy packed powder can be had warm with water or milk. Rich in nutrients, making it a perfect choice for weight watchers and those looking for a holistic health solution for their family. The manufacturer provides natural, millet-based, holistic-health anchored, nutritionally balanced functional foods to enrich everyday meals; they also empower farmer communities. Recyclable pack.
For more information
The Canadian Trade Commissioner Service:
International Trade Commissioners can provide Canadian industry with on-the-ground expertise regarding market potential, current conditions and local business contacts, and are an excellent point of contact for export advice.
More agri-food market intelligence:
International agri-food market intelligence
Discover global agriculture and food opportunities, the complete library of Global Analysis reports, market trends and forecasts, and information on Canada's free trade agreements.
Agri-food market intelligence service
Canadian agri-food and seafood businesses can take advantage of a customized service of reports and analysis, and join our email subscription service to have the latest reports delivered directly to their inbox.
More on Canada's agriculture and agri-food sectors:
Canada's agriculture sectors
Information on the agriculture industry by sector. Data on international markets. Initiatives to support awareness of the industry in Canada. How the department engages with the industry.
For additional information on the Food Ingredients & Health Ingredients (FIHI) - 2023 event in India from August 17-19, please contact:
Kesha Dhruv
Counsellor (Agriculture and Food) and Trade Commissioner
The Consulate General of Canada, Mumbai
Government of Canada
CanadainIndia.Agri@international.gc.ca
Resources
- Euromonitor, 2023. Presentation: The Evolution of Plant Base – Eating and Beyond
- Euromonitor International | January 2023. Country Report: Processed meat, seafood and alternatives to meat in India
- Euromonitor | March 2022. Plant-Based Eating and Alternative Proteins in Middle East and Africa
- Mintel Global New Products Database, 2023
- Mintel | October 2022. A year of innovation in meat substitutes and eggs: Asia
- Walji, Amrin. Mintel | A year of innovation in plant-based drinks, yogurt & ice cream, 2023
Sector Trend Analysis – Plant-based protein food and drink trends in India
Global Analysis Report
Prepared by: Erin-Ann Chauvin, Senior Market Analyst
© His Majesty the King in Right of Canada, represented by the Minister of Agriculture and Agri-Food (2023).
Photo credits
All photographs reproduced in this publication are used by permission of the rights holders.
All images, unless otherwise noted, are copyright His Majesty the King in Right of Canada.
To join our distribution list or to suggest additional report topics or markets, please contact:
Agriculture and Agri-Food Canada, Global Analysis1341 Baseline Rd, Tower 5, 3rd floor
Ottawa ON K1A 0C5
Canada
Email: aafc.mas-sam.aac@agr.gc.ca
The Government of Canada has prepared this report based on primary and secondary sources of information. Although every effort has been made to ensure that the information is accurate, Agriculture and Agri-Food Canada (AAFC) assumes no liability for any actions taken based on the information contained herein.
Reproduction or redistribution of this document, in whole or in part, must include acknowledgement of agriculture and agri-food Canada as the owner of the copyright in the document, through a reference citing AAFC, the title of the document and the year. Where the reproduction or redistribution includes data from this document, it must also include an acknowledgement of the specific data source(s), as noted in this document.
Agriculture and Agri-Food Canada provides this document and other report services to agriculture and food industry clients free of charge.