

Note: This report includes forecasting data that is based on baseline historical data.
Executive summary
Top global importers of flour, meal and powder made from peas, beans, lentils & other dried leguminous vegetables, importing a total of Can$197.0 million in 2022, were the United States, Germany, United Kingdom, Canada, and the Netherlands. In 2022, the Philippines imported a total of 0.5% (Can$9,440) of these plant-based pulse ingredients that were supplied by India and the United States.
The market sizes in terms of volume sales for pulses (dry beans, peas, other pulses harvested only for grains) in the Philippines totaled 97.2 thousand tonnes; while plant-based (non-animal) derived proteins (including vegetable proteins) totaled 4.9 thousand tonnes, hydrolysed vegetable protein (HVP) at 921.7 tonnes, and other flours (including pea flour) at 94.9 thousand tonnes in 2022. In general, HVP ingredients used mostly as a flavour enhancer were found mostly within packaged foods such as instant noodle pouches and cups (94.3%), cooking bouillon liquid stocks and fonds (5.3%), and chocolate confectionery countlines (0.4%). The majority of products that contained vegetable proteins were found in beauty and personal care (69.7%) and shelf stable packaged ready meal (29.3%) products.
Plant-based eating and alternative proteins has been steadily rising across the world. Health benefits are the main reason for consuming plant-based diets and are mostly found in the plant-based meat substitutes and dairy milk alternatives food categories. Products with 'added/high in protein', along with claims derived from pulses and legumes are positively being considered as a healthy or nutritional alternative within a broad range of food and drink categories. According to Mintel, top growing categories for pulse ingredient products in the Philippines were snacks, bakery, and sauces & seasonings between Q3-2022 and Q3-2023; while declining categories during this period were dairy, side dishes, and soup.
Between January 2018 and July 6th 2023, top ingredients listed on packaging for new product launches derived from pulses mostly included soybean protein (including hydrolyzed soy protein isolates & concentrates, textured, soybean flour) and textured or vegetable protein hydrolysates. Other popular new products that were derived using pulses or related powder ingredients were those containing peas, Mung beans, peanut flour, black bean, chickpea, kidney beans, chickpea flour, pea protein, and potato protein.
Key demographic indicators
Plant-based eating and alternative proteins has been steadily rising (accelerated by the COVID-19 pandemic) amongst most countries. Globally, new plant-based, vegan and vegetarian product developments or launches have been growing not only in the food and beverage sector with 66.7% of claims in 2022 and a growth of 3.1% (2015 to 2021), while such plant-based claims are also becoming popular in the consumer health (50%), and the beauty and personal care segments (74.6%) by a growth of 8.3%.Footnote 1
Health benefits are the main reason for consuming plant-based diets and are mostly found in the plant-based meat substitutes and dairy milk alternatives food categories. Consumers in the Asia Pacific region, find that positive nutritional quality claims such as 'added/high protein' content is the most important feature when purchasing plant-based drinks - as cited by nearly half of responders (48%) at a sample size of 2,936 users.Footnote 2
Protein in particular, has been moving to the forefront of nutrition as consumers continue to seek out snack products that deliver a slow energy release, as opposed to traditional quick delivery energy products. Pea protein chips (Wellness Foods) is one of a new wave of protein products that emerged into the snacking categories as early as 2013, beyond cereal/energy bars or dairy products.Footnote 3 Snacks made from green peas or containing pea protein ingredients or vegetable powders that come in chips, rice or corn puffs or nut mixes (bean based) formats are becoming more and more popular.
Pulses and legumes are also, gaining traction outside meals, and are moving into a wide range of food and drink categories associated to health ingredient claims. Yofi brand has introduced into the France market (March 2023) two plant-based milk alternative (M.lk) variants made from either "Oat & Chickpea or Rice & Chickpea", which boasts as having a high nutritional value, while delivering on superior texture and taste, and being a sustainable plant food source to the environment. Les Petites Pousses plant-based brand from France (not imported), alongside its almond and coconut milk variants, has also recently came out with its new Wonder Pea dessert (May 2023), whose main base ingredient is pea juice made from French-sourced green peas.Footnote 4
Trade overview
In 2022, global imports of pea flour and other dried leguminous flour, meal and powder (HS:110610) totalled Can$197.0 million (116.7 thousand tonnes), increasing at a value CAGR of 10.9% between 2018 and 2022. The top global importers for these pulse ingredients from the world were the United States (32.8%), Germany (10.4%), the United Kingdom (8.4%), Canada (5.9%), and the Netherlands (4.8%) in 2022. The Philippines was the 74th largest importer from the world for these pulse ingredients at a total of Can$9,440 (6 metric tonnes) over the year, which has been declining by a value CAGR of 26.9% (2018 to 2022).
| Country | 2018 | 2019 | 2020 | 2021 | 2022 | CAGR* % 2018-2022 |
|---|---|---|---|---|---|---|
| Total - global importers | 130.1 | 131.5 | 145.4 | 192.4 | 197.0 | 10.9 |
| 1. United States | 34.0 | 38.7 | 36.5 | 50.5 | 64.7 | 17.4 |
| 2. Germany | 7.3 | 6.4 | 14.1 | 38.7 | 20.4 | 29.3 |
| 3. United Kingdom | 12.7 | 13.2 | 14.6 | 12.4 | 16.5 | 6.7 |
| 4. Canada | 14.6 | 7.0 | 13.3 | 11.1 | 11.5 | −5.7 |
| 5. Netherlands | 5.0 | 6.3 | 4.0 | 8.1 | 9.5 | 17.4 |
| 6. Australia | 1.9 | 3.0 | 7.0 | 9.0 | 7.2 | 39.4 |
| 7. Austria | 4.6 | 4.4 | 5.9 | 5.7 | 6.4 | 8.7 |
| 8. Italy | 6.4 | 6.2 | 5.7 | 6.4 | 6.1 | −1.2 |
| 9. Poland | 0.7 | 0.4 | 0.4 | 2.1 | 5.1 | 63.6 |
| 10. France | 2.7 | 4.6 | 3.8 | 3.9 | 4.7 | 15.4 |
| Subtotal - top 10 suppliers | 89.9 | 90.3 | 105.3 | 147.9 | 152.0 | 14.1 |
| Philippines (74th) | 0.033 | 0.061 | 0.029 | 0.054 | 0.009 | −26.9 |
|
Source: Global trade tracker, 2023 1: HS 110610 - Flour, meal and powder of peas, beans, lentils and other dried leguminous vegetables of heading 0713 *CAGR: Compound Annual Growth Rate |
||||||
| Country | 2018 | 2019 | 2020 | 2021 | 2022 | CAGR* % 2018-2022 |
|---|---|---|---|---|---|---|
| Total - global importers | 124,588 | 100,018 | 100,537 | 120,300 | 116,656 | −1.6 |
| 1. United States | 21,862 | 24,116 | 23,025 | 32,403 | 37,482 | 14.4 |
| 2. United Kingdom | 6,512 | 7,161 | 7,441 | 6,606 | 9,375 | 9.5 |
| 3. Germany | 3,513 | 3,100 | 4,698 | 10,561 | 8,704 | 25.5 |
| 4. Austria | 2,490 | 4,349 | 6,629 | 6,782 | 7,042 | 29.7 |
| 5. Netherlands | 3,861 | 2,605 | 3,133 | 6,679 | 6,595 | 14.3 |
| 6. Canada | 25,121 | 6,269 | 7,386 | 5,565 | 5,081 | −32.9 |
| 7. Italy | 5,496 | 5,637 | 5,388 | 5,774 | 4,649 | −4.1 |
| 9. Australia | 791 | 1,080 | 7,826 | 10,243 | 3,792 | 48.0 |
| 10. France | 1,656 | 3,962 | 2,520 | 2,505 | 3,405 | 19.7 |
| 15. Poland | 598 | 274 | 317 | 822 | 1792 | 31.6 |
| Subtotal - top 10 suppliers | 71,900 | 58,553 | 68,363 | 87,940 | 87,917 | 5.2 |
| Philippines (65) | 18 | 26 | 14 | 16 | 6 | −24.0 |
|
Source: Global trade tracker, 2023 1: HS 110610 - Flour, meal and powder of peas, beans, lentils and other dried leguminous vegetables of heading 0713 *CAGR: Compound Annual Growth Rate |
||||||
In 2022, the Philippines imported its supply of pea flour and other dried leguminous flour, meal and powder (HS:110610) globally from India and the United States - with Peru, the Netherlands, and Hong Kong being other markets it imported from over the last five-year period (2018 to 2022). Compared to other flour, meal and powder ingredients made from either fruit, nuts or peels of citrus or melons (Chapter 8) at imports of Can$1.9 million (88.7%) and sago, roots or tubers with a high content of starch or inulin (Heading 0714) at Can$228,534 (10.8%), only 0.5% (Can$9,440) of the Philippines' flour imports from the world consisted of pea flour and other dried leguminous flour, meal and powder in 2022.
| Country | 2018 | 2019 | 2020 | 2021 | 2022 | CAGR* % 2018-2022 |
|---|---|---|---|---|---|---|
| Total - global suppliers | 33,049 | 60,482 | 29,326 | 54,224 | 9,440 | −26.9 |
| 1. India | 27,792 | 25,372 | 20,653 | 22,159 | 7,937 | −26.9 |
| 2. United States | 5,257 | 17,848 | 5,936 | 6,453 | 1,503 | −26.9 |
| 3. Peru | 0 | 984 | 0 | 0 | 0 | n/a |
| 4. Netherlands | 0 | 16,278 | 2,737 | 0 | 0 | −83.2 |
| 5. Hong Kong | 0 | 0 | 0 | 25,612 | 0 | n/a |
|
Source: Global trade tracker, 2023 1: HS 110610 - Flour, meal and powder of peas, beans, lentils and other dried leguminous vegetables of heading 0713 *CAGR: Compound Annual Growth Rate n/a: not applicable |
||||||
| HS Code | Description | 2018 | 2019 | 2020 | 2021 | 2022 | CAGR* % 2018-2022 |
|---|---|---|---|---|---|---|---|
| Total - imports by commodity type | 2.8 | 2.1 | 1.2 | 1.2 | 2.1 | −6.6 | |
| 110630 | Flour, meal and powder made from edible fruit, nuts, peel of citrus fruits or melons (chapter 8) | 1.7 | 1.9 | 0.716 | 1.1 | 1.9 | 2.5 |
| 110620 | Flour, meal and powder made from sago, roots or tubers (including manioc, arrowroot, salep, sweet potatoes etc.) with a high content of starch or inulin (heading 0714) | 1.0 | 0.149 | 0.426 | 0.115 | 0.229 | −31.5 |
| 110610 | Flour, meal and powder made from peas, beans, lentils and the other dried leguminous vegetables (heading 0713) | 0.033 | 0.061 | 0.029 | 0.054 | 0.009 | −26.9 |
|
Source: Global trade tracker, 2023 *CAGR: Compound Annual Growth Rate |
|||||||
| HS Code | Description | 2018 | 2019 | 2020 | 2021 | 2022 | CAGR* % 2018-2022 |
|---|---|---|---|---|---|---|---|
| Total - imports by commodity type | 730.8 | 236.9 | 491.4 | 301.1 | 385.2 | −14.8 | |
| 110630 | Flour, meal and powder made from edible fruit, nuts, peel of citrus fruits or melons (chapter 8) | 119.4 | 160.8 | 103.2 | 133.7 | 298.1 | 25.7 |
| 110620 | Flour, meal and powder made from sago, roots or tubers (including manioc, arrowroot, salep, sweet potatoes etc.) with a high content of starch or inulin (heading 0714) | 593.3 | 50.4 | 373.8 | 151.1 | 81.5 | −39.1 |
| 110610 | Flour, meal and powder made from peas, beans, lentils and the other dried leguminous vegetables (heading 0713) | 18.1 | 25.7 | 14.4 | 16.3 | 5.6 | −25.4 |
|
Source: Global trade tracker, 2023 *CAGR: Compound Annual Growth Rate |
|||||||
Market sizes
The APAC region leads in the production of vegetable oils, grain mill products and commodities such as sugar, coffee, tea and spices.Footnote 5 In 2022, the Philippines was the 11th largest pulse market (aggregate of dry beans, peas, other pulses harvested only for dry grains) within the APAC region in terms of retail volume sales at a total of 97.2 thousand tonnes (0.2%); while the top APAC markets were India (76.1%), Pakistan (9.5%), Bangladesh (6.7%), China (1.9%), and Sri Lanka (1.2%).
| Category | 2017 | 2018 | 2019 | 2020 | 2021 | 2022 |
|---|---|---|---|---|---|---|
| Total - Asia Pacific pulses[1] | 39,327.9 | 40,305.3 | 38,206.6 | 37,941.3 | 38,809.3 | 40,145.2 |
| Philippines - pulses | 81.7 | 83.4 | 83.7 | 82.4 | 91.9 | 97.2 |
| Total - Asia Pacific other pulses[2] | 30,277.5 | 29,208.7 | 27,421.4 | 26,899.5 | 27,337.6 | 27,906.3 |
| Philippines - other pulses | 27.5 | 28.1 | 28.3 | 28.6 | 31.9 | 33.8 |
|
Source: Euromonitor International, 2023 1: Pulses - This category is limited to leguminous crops harvested only for dry grains (dry beans, peas and other pulses). Excludes crops harvested green for food (green peas, green bean, string beans, etc), which are considered to be vegetables and are included in other vegetables category. Also, excludes those used mainly for the extraction of oil (for example, soybeans) and those leguminous crops such as clover and alfalfa, which are seeds that are almost used exclusively for sowing purpose. 2: Other pulses - Includes all other unprocessed pulses, whether packaged or unpackaged such as chick peas, cow peas, pigeon peas, lentils, bambara beans, lupins etc. Excludes packaged or processed pulses that are canned, frozen or chilled. |
||||||
| Category | CAGR* % 2017-2022 | Annual growth (%) 2022/2021 | Total growth (%) 2017-2022 |
|---|---|---|---|
| Total - Asia Pacific pulses[1] | 0.4 | 3.4 | 2.1 |
| Philippines - pulses | 3.5 | 5.8 | 19.0 |
| Total - Asia Pacific other pulses[2] | −1.6 | 2.1 | −7.8 |
| Philippines - other pulses | 4.2 | 6.0 | 22.9 |
|
Source: Euromonitor International, 2023 *CAGR: Compound Annual Growth Rate 1: Pulses - This category is limited to leguminous crops harvested only for dry grains (dry beans, peas and other pulses). Excludes crops harvested green for food (green peas, green bean, string beans, etc), which are considered to be vegetables and are included in other vegetables category. Also, excludes those used mainly for the extraction of oil (for example, soybeans) and those leguminous crops such as clover and alfalfa, which are seeds that are almost used exclusively for sowing purpose. 2: Other pulses - Includes all other unprocessed pulses, whether packaged or unpackaged such as chick peas, cow peas, pigeon peas, lentils, bambara beans, lupins etc. Excludes packaged or processed pulses that are canned, frozen or chilled. |
|||
| Category | 2022 | 2023 | 2024 | 2025 | 2026 | 2027 |
|---|---|---|---|---|---|---|
| Total - Asia Pacific pulses[1] | 40,145.2 | 41,308.2 | 42,425.2 | 43,469.4 | 44,475.1 | 45,491.5 |
| Philippines - pulses | 97.2 | 98.9 | 100.5 | 102.0 | 103.5 | 105.0 |
| Total - Asia Pacific other pulses[2] | 27,906.3 | 28,395.8 | 28,933.6 | 29,514.2 | 30,123.5 | 30,751.1 |
| Philippines - other pulses | 33.8 | 34.4 | 35.1 | 35.6 | 36.1 | 36.6 |
|
Source: Euromonitor International, 2023 1: Pulses - This category is limited to leguminous crops harvested only for dry grains (dry beans, peas and other pulses). Excludes crops harvested green for food (green peas, green bean, string beans, etc), which are considered to be vegetables and are included in other vegetables category. Also, excludes those used mainly for the extraction of oil (for example, soybeans) and those leguminous crops such as clover and alfalfa, which are seeds that are almost used exclusively for sowing purpose. 2: Other pulses - Includes all other unprocessed pulses, whether packaged or unpackaged such as chick peas, cow peas, pigeon peas, lentils, bambara beans, lupins etc. Excludes packaged or processed pulses that are canned, frozen or chilled. |
||||||
| Category | CAGR* % 2022-2027 | Annual growth (%) 2023/2022 | Total growth (%) 2022-2027 |
|---|---|---|---|
| Total - Asia Pacific pulses[1] | 2.5 | 2.9 | 13.3 |
| Philippines - pulses | 1.6 | 1.7 | 8.0 |
| Total - Asia Pacific other pulses[2] | 2.0 | 1.8 | 10.2 |
| Philippines - other pulses | 1.6 | 1.8 | 8.3 |
|
Source: Euromonitor International, 2023 *CAGR: Compound Annual Growth Rate 1: Pulses - This category is limited to leguminous crops harvested only for dry grains (dry beans, peas and other pulses). Excludes crops harvested green for food (green peas, green bean, string beans, etc), which are considered to be vegetables and are included in other vegetables category. Also, excludes those used mainly for the extraction of oil (for example, soybeans) and those leguminous crops such as clover and alfalfa, which are seeds that are almost used exclusively for sowing purpose. 2: Other pulses - Includes all other unprocessed pulses, whether packaged or unpackaged such as chick peas, cow peas, pigeon peas, lentils, bambara beans, lupins etc. Excludes packaged or processed pulses that are canned, frozen or chilled. |
|||
In 2022, the market size of plant-based protein ingredients (non-animal derived) in the Philippines registered a volume of 4.9 thousand tonnes, equivalent to an historical volume sales CAGR of 4.7% (2017 to 2022) and a forecast CAGR of 3.0% (2022 to 2027) set to reach 5.7 thousand tonnes by 2027. In 2022, 70.6% of non-animal derived protein ingredients consisted of soy protein isolate (3.5 thousand tonnes), followed by 25.5% of soy protein concentrate (1.3 thousand tonnes), 3.7% of gluten (179.5 tonnes), 0.2% of vegetable proteins (8.9 tonnes), and 0% pea protein. Hydrolysed vegetable protein or HVP (often used as a flavour enhancer in noodles and other packaged food products) totalled volume sales of 921.7 tonnes in 2022, which historically registered the largest CAGR of 7.4% (2017 to 2022).
Note: Protein hydrolysates (825.3 tonnes) and other proteins (1.3 thousand tonnes) were not included in the protein ingredients total since these categories may not necessarily be all inclusively non-animal derived. However, typically these proteins do come from plant, pulse or cereal sources. Also, if a product listing declared the inclusion of 'pea flour', its volume sales was included in the 'other flours' category - totalling 94.9 thousand tonnes in 2022.
| Category | 2017 | 2018 | 2019 | 2020 | 2021 | 2022 |
|---|---|---|---|---|---|---|
| Total - non-animal derived proteins[1] | 3,892.5 | 4,102.7 | 4,305.8 | 4,494.6 | 4,742.5 | 4,900.3 |
| Gluten | 168.6 | 176.3 | 185.4 | 159.8 | 168.8 | 179.5 |
| Soy protein concentrate | 1,040.4 | 1,090.1 | 1,137.5 | 1,121.7 | 1,187.2 | 1,250.8 |
| Soy protein isolate | 2,676.0 | 2,828.7 | 2,975.1 | 3,204.3 | 3,377.7 | 3,461.2 |
| Vegetable proteins | 7.4 | 7.5 | 7.7 | 8.8 | 8.8 | 8.9 |
| Hydrolysed vegetable protein[2] | 644.1 | 670.2 | 699.2 | 842.7 | 890.8 | 921.7 |
| Protein hydrolysates[3] | 652.1 | 682.2 | 716.7 | 763.7 | 793.2 | 825.3 |
| Other proteins[3] | 895.4 | 927.0 | 964.0 | 1,158.1 | 1,222.3 | 1,263.1 |
| Other flours (including pea flour)[4] | 71,208.5 | 73,450.8 | 76,783.5 | 83,145.9 | 89,078.2 | 94,854.8 |
|
Source: Euromonitor International, 2023 1: Non-animal derived proteins - Note that this category is not all inclusive since non-animal derived proteins may be used in the more ambiguous categories 'Hydrolysed Keratins,' 'Protein Hydrolysates' and 'Other Proteins' (not including in total volume). Typically, however, these proteins come from plant, pulse or cereal sources. 2: Hydrolysed vegetable protein (HVP) - Produced by boiling vegetable matter in hydrochloric acid and then neutralising with sodium hydroxide. HVP contains glutamic acid and can, therefore, be used as a flavour enhancer mainly used in noodles and other packaged food products. 3: Protein hydrolysates - are a solution of amino acids that are prepared from meat, fish, milk, soy and wheat gluten proteins using acid or enzymatic hydrolysis. They are used as an enhancer in beauty and personal care products, as well as, in foods including baby milk formula, noodles and savoury snacks 4: Other flours - This is a general category that includes any flours (other than wheat, wholemeal, rye, soya flour) that have not been specifically named within the flours category. Please note that if a product listing declares inclusion of 'Pea Flour,' this will be tracked in this category. |
||||||
| Category | CAGR* % 2017-2022 | Annual growth (%) 2022/2021 | Total growth (%) 2017-2022 |
|---|---|---|---|
| Total - non-animal derived proteins | 4.7 | 3.3 | 25.9 |
| Gluten | 1.3 | 6.3 | 6.5 |
| Soy protein concentrate | 3.8 | 5.4 | 20.2 |
| Soy protein isolate | 5.3 | 2.5 | 29.3 |
| Vegetable proteins | 3.8 | 1.1 | 20.3 |
| Hydrolysed vegetable protein | 7.4 | 3.5 | 43.1 |
| Protein hydrolysates | 4.8 | 4.0 | 26.6 |
| Other proteins | 7.1 | 3.3 | 41.1 |
| Other flours (including pea flour) | 5.9 | 6.5 | 33.2 |
|
Source: Euromonitor International, 2023 *CAGR: Compound Annual Growth Rate |
|||
| Category | 2022 | 2023 | 2024 | 2025 | 2026 | 2027 |
|---|---|---|---|---|---|---|
| Total - non-animal derived proteins | 4,900.3 | 5,059.5 | 5,224.5 | 5,376.6 | 5,529.3 | 5,691.2 |
| Gluten | 179.5 | 191.4 | 204.1 | 215.7 | 227.1 | 239.5 |
| Soy protein concentrate | 1,250.8 | 1,314.4 | 1,379.0 | 1,439.2 | 1,499.2 | 1,563.0 |
| Soy protein isolate | 3,461.2 | 3,544.7 | 3,632.4 | 3,712.7 | 3,793.9 | 3,879.6 |
| Vegetable proteins | 8.9 | 9.0 | 9.0 | 9.1 | 9.1 | 9.2 |
| Hydrolysed vegetable protein | 921.7 | 942.6 | 958.9 | 972.8 | 986.1 | 999.4 |
| Protein hydrolysates | 825.3 | 858.0 | 893.3 | 930.1 | 969.0 | 1,009.8 |
| Other proteins | 1,263.1 | 1,290.0 | 1,310.9 | 1,328.7 | 1,345.6 | 1,362.6 |
| Other flours (including pea flour) | 94,854.8 | 100,065.4 | 104,955.7 | 109,296.9 | 113,360.0 | 117,651.9 |
|
Source: Euromonitor International, 2023 |
||||||
| Category | CAGR* % 2022-2027 | Annual growth (%) 2023/2022 | Total growth (%) 2022-2027 |
|---|---|---|---|
| Total - non-animal derived proteins | 3.0 | 3.2 | 16.1 |
| Gluten | 5.9 | 6.6 | 33.4 |
| Soy protein concentrate | 4.6 | 5.1 | 25.0 |
| Soy protein isolate | 2.3 | 2.4 | 12.1 |
| Vegetable proteins | 0.7 | 1.1 | 3.4 |
| Hydrolysed vegetable protein | 1.6 | 2.3 | 8.4 |
| Protein hydrolysates | 4.1 | 4.0 | 22.4 |
| Other proteins | 1.5 | 2.1 | 7.9 |
| Other flours (including pea flour) | 4.4 | 5.5 | 24.0 |
|
Source: Euromonitor International, 2023 *CAGR: Compound Annual Growth Rate |
|||
In 2022, demand in the Philippines for HVP ingredients in terms of volume sales pecentages were most popular within packaged foods such as instant noodle pouches and cups by 94.3%, followed by cooking bouillon liquid stocks & fonds (5.3%), and chocolate confectionery countlines (0.4%). The majority of products that contained vegetable proteins were found in beauty and personal hair care products by a total of 69.7% such as standard shampoos (53.9%) and conditioners & treatments (15.8%) in 2022. While the remainder of 29.3% of products with vegetable protein ingredients were reported within the shelf stable packaged ready meals category over the year.
| Category | 2017 | 2022 | CAGR* % 2017-2022 | 2023 | 2027 | CAGR* % 2022-2027 |
|---|---|---|---|---|---|---|
| Total - hydrolysed vegetable protein | 100.0 | 100.0 | 100.0 | 100.0 | ||
| Cooking bouillon - liquid stocks & fonds | 6.1 | 5.3 | −2.8 | 5.3 | 5.5 | 0.7 |
| Instant noodle cups | 17.0 | 19.3 | 2.6 | 19.5 | 20.0 | 0.7 |
| Instant noodle pouches | 76.5 | 75.0 | −0.4 | 74.8 | 74.0 | −0.3 |
| Snacks - chocolate confectionery countlines | 0.4 | 0.4 | 0.0 | 0.4 | 0.5 | 4.6 |
| Total - vegetable proteins | 100.0 | 100.0 | 100.0 | 100.0 | ||
| Beauty and personal hair care | 77.0 | 69.7 | −2.0 | 68.5 | 64.6 | −1.5 |
| Packaged food - shelf stable ready meals | 23.0 | 30.3 | 5.7 | 31.5 | 35.4 | 3.2 |
|
Source: Euromonitor, 2023 *CAGR: Compound Annual Growth Rate |
||||||
New product launches
Mintel indicated that there were 1,124 new food products containing pulse ingredients launched in grocery retailer outlets in the Philippines (including new variety/range extension, packaging, formulation or relaunched) between the period of January 2018 and July 6, 2023: which consisted of a search using keywords such as black eyed peas (white Lobia), legume & pulse flour (chickpea, green & black gram pulse- Mascalai, mat or moth bean), kidney bean (red bean extract, juice, paste, powder), Indian spiced peas (Khesari), pea protein (peptides, concentrate, flour, hydrolysate, isolate, rehydrated, textured), vegetable protein, pigeon peas (red gram, yellow split Dal Arhar), and pigeon pea extract.
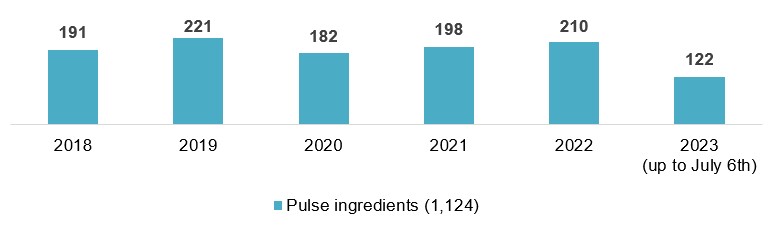
Description of above image
| 2018 | 2019 | 2020 | 2021 | 2022 | 2023 (up to July 6th) | Total | |
|---|---|---|---|---|---|---|---|
| Pulse ingredients launched | 191 | 221 | 182 | 198 | 210 | 122 | 1,124 |
Source: Mintel, 2023
Leading parent companies launching these pulse ingredient products (228) in the Philippines between Q3-2022 and Q3-2023 were Virginia Food (18), San Miguel Corporation (11), CDO Foodsphere (9), Pampanga's Best (7), Century Pacific Food (6), and Nissin Foods (6). New brands appearing for the first time launched in the Filipino market within the last 6 months, included Jack 'n Jill Dewberry (blueberries 'n yogurt flavoured cake), Metro Select Essentials (premium soy sauce), Royal Smokehouse (chicken luncheon meat) and Sweet 'n Juicy (Jumbo hotdog).
Top growing categories for pulse ingredient products in the Philippines were snacks (+300%), bakery (+150%), sauces & seasonings (+75%), fruit and vegetables (+50%), and meals and meal centers (+43%) between Q3-2022 and Q3-2023. During this same period, declining categories were dairy, side dishes, and soup (−100%). New ingredients found within these products appearing within the last 12 months included brewed vinegar, natural ginger flavour, Pandan (vanilla with hint of coconut tasting flavoring), red rice, white vinegar powder, zinc gluconate, grape seed extract, peanut protein, brominated vegetable oils, and natural alcohol flavour. The fastest growing or most common flavours used were smoke (+100%), pork, salt/salted, chili/sweet chilli pepper, seafood, and vanilla (bourbon/Madagascar) between Q3-2021 and Q3-2023.
Between January 2018 and July 6th 2023, top ingredient claims listed on packaging for these product launches derived from pulses mostly included soybean protein (including hydrolyzed soy protein isolates and concentrates, textured, soybean flour), followed by textured and vegetable protein hydrolysates. Other popular new products that were derived using pulses or related ingredients were those containing peas (66), Mung beans (20), peanut flour (18), black bean (17), chickpea (16), kidney beans (13), chickpea flour (7), pea protein (7), and potato protein (6).
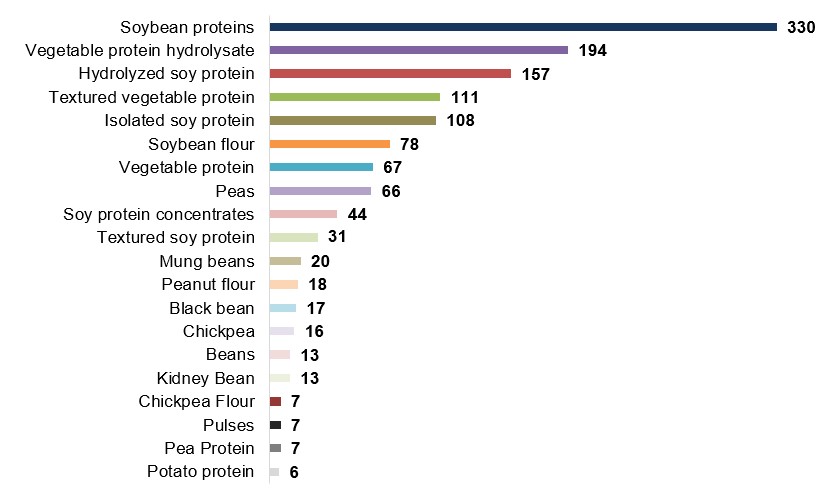
Description of above image
- Soybean proteins: 330
- Vegetable protein hydrolysate: 194
- Hydrolyzed soy protein: 157
- Textured vegetable protein: 111
- Isolated soy protein: 108
- Soybean flour: 78
- Vegetable protein: 67
- Peas: 66
- Soy protein concentrates: 44
- Textured soy protein: 31
- Mung beans: 20
- Peanut flour: 18
- Black bean: 17
- Chickpea: 16
- Kidney Bean: 13
- Beans: 13
- Pea Protein: 7
- Pulses: 7
- Chickpea Flour: 7
- Potato protein: 6
Total item count: 1,124
Source: Mintel, 2023
| Product attributes | Yearly launch - item count | ||||||
|---|---|---|---|---|---|---|---|
| 2018 | 2019 | 2020 | 2021 | 2022 | 2023 | Total | |
| Yearly product launches | 191 | 221 | 182 | 198 | 210 | 122 | 1,124 |
| Top launch types | |||||||
| New variety / range extension | 92 | 89 | 86 | 79 | 89 | 45 | 480 |
| New packaging | 49 | 85 | 60 | 71 | 47 | 41 | 353 |
| New product | 25 | 27 | 22 | 37 | 53 | 29 | 193 |
| Relaunch | 23 | 18 | 12 | 11 | 18 | 7 | 89 |
| New formulation | 2 | 2 | 2 | 0 | 3 | 0 | 9 |
| Top sub-categories | |||||||
| Meat products | 67 | 62 | 30 | 48 | 53 | 19 | 279 |
| Poultry products | 18 | 21 | 17 | 14 | 30 | 17 | 117 |
| Instant noodles | 14 | 40 | 20 | 12 | 14 | 8 | 108 |
| Fish products | 9 | 10 | 19 | 15 | 5 | 6 | 64 |
| Prepared meals | 11 | 3 | 4 | 11 | 20 | 6 | 55 |
| Top five companies / parent | |||||||
| San Miguel Corporation | 21 | 21 | 11 | 10 | 29 | 2 | 94 |
| Purefoods-Hormel | 20 | 19 | 11 | 9 | 28 | 1 | 88 |
| CDO Foodsphere | 20 | 16 | 7 | 25 | 7 | 6 | 81 |
| The Pacific Meat Co. | 9 | 12 | 5 | 11 | 11 | 4 | 52 |
| Virginia Food | 5 | 7 | 7 | 11 | 13 | 7 | 50 |
| Top five brands | |||||||
| CDO | 6 | 2 | 4 | 18 | 4 | 5 | 39 |
| Lucky Me! | 2 | 12 | 2 | 4 | 5 | 0 | 25 |
| Virginia | 1 | 0 | 3 | 4 | 9 | 7 | 24 |
| Purefoods Hormel Tender Juicy | 3 | 11 | 4 | 1 | 1 | 0 | 20 |
| Nongshim | 5 | 5 | 4 | 2 | 0 | 0 | 16 |
| Location of manufacture | |||||||
| Philippines | 108 | 127 | 92 | 101 | 107 | 62 | 597 |
| South Korea | 5 | 7 | 6 | 4 | 10 | 1 | 33 |
| China | 2 | 8 | 2 | 1 | 2 | 7 | 22 |
| Thailand | 5 | 1 | 2 | 3 | 3 | 3 | 17 |
| Italy | 7 | 1 | 0 | 3 | 2 | 0 | 13 |
| Top five flavours (including blend) | |||||||
| Unflavoured/plain | 67 | 73 | 46 | 59 | 61 | 44 | 350 |
| Cheese | 13 | 19 | 10 | 7 | 13 | 5 | 67 |
| Pork | 4 | 0 | 2 | 5 | 14 | 2 | 27 |
| Barbecue/BBQ/Barbacoa | 6 | 4 | 4 | 3 | 6 | 2 | 25 |
| Chicken | 4 | 2 | 4 | 4 | 5 | 2 | 21 |
| Top ingredient preparation | |||||||
| Powdered | 70 | 85 | 73 | 65 | 76 | 41 | 410 |
| Hydrolysed | 46 | 84 | 57 | 64 | 59 | 50 | 360 |
| Skimmed | 32 | 27 | 25 | 21 | 26 | 17 | 148 |
| Dehydrated | 14 | 36 | 14 | 17 | 18 | 14 | 113 |
| Paste | 13 | 24 | 20 | 20 | 21 | 7 | 105 |
| Top or related ingredient claims | |||||||
| Vegetable based (#1) | 103 | 109 | 72 | 69 | 98 | 59 | 510 |
| Natural (#2) | 38 | 57 | 39 | 65 | 81 | 40 | 320 |
| Artificial (#3) | 42 | 66 | 47 | 45 | 62 | 43 | 305 |
| Green (#4) | 17 | 43 | 24 | 27 | 28 | 6 | 145 |
| Plant based (#12) | 3 | 1 | 5 | 4 | 4 | 1 | 18 |
| Source: Mintel; Global New Product Database, 2023 | |||||||
Examples of new products
Supreme Thin Crust Gluten-Free Pizza
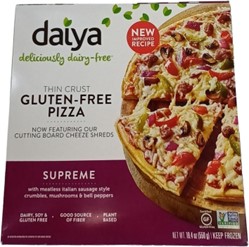
Source: Mintel, 2023
| Company / manufacturer | Daiya Foods |
|---|---|
| Brand | Daiya |
| Sub-category | Meals and meals centers, pizzas |
| Market | Philippines, imported from Canada |
| Related claims | High/added fibre, premium, gluten free, low / no / reduced allergen, vegan / no animal ingredients, GMO and dairy free, plant-based |
| Related ingredients | Gluten-free crust (tapioca / potato / rice starch, rice flour, chickpea flour, milled flaxseed, chicory root extract, locust bean gum), chickpea protein |
| Store name | Marketplace by Rustan's, Taguig 1634 |
| Store type | Supermarket |
| Date published | December 2022 |
| Launch type | New formulation |
| Price in US dollars | 13.90 |
This thin crust gluten-free pizza has been reformulated with a new improved recipe, and retails in a 550 gram pack. Now featuring premium cutting board cheeze shreds, which melt ans stretch just like dairy. With meatless Italian sausage style crumbles, mushroom and bell peppers. Free from dairy, soy and gluten. Good source of fiber, plant based, vegan, recyclable pack. Certified gluten-free, non GMO project.
Rice Snack
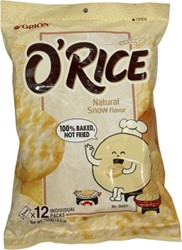
Source: Mintel, 2023
| Company / manufacturer | Orion Food Vina |
|---|---|
| Distributor | Federated Distributors |
| Brand | Orion O'Rice |
| Market | Philippines, imported from Vietnam |
| Related claims | No additives / preservatives, low / no / reduced cholesterol |
| Related ingredients | Japonica rice (59.7%), vegetable based palm oil, hydrolysed pea protein, antioxidants |
| Store name | SM, Quezon City 1105 |
| Store type | Department store |
| Date published | July 2023 |
| Launch type | New product |
| Price in US dollars | 1.97 |
This product retails in a 129 gram pack containing twelve 10.8 gram individual packets, each packet containing two pieces. 100% baked, not fried. Anytime snack, to help get over those hunger pangs. No preservatives or cholesterol.
Cheese Balls
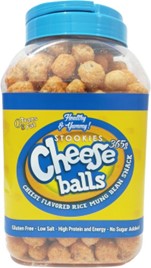
Source: Mintel, 2023
| Company / manufacturer | Aretei Foods Corporation |
|---|---|
| Brand | Healthy & Yummy! Stookies |
| Category | Snacks, rice snacks |
| Market | Philippines |
| Related claims | Low / no / reduced sodium, reduced transfat and allergen, gluten free, high / added protein, no added sugar |
| Related ingredients | Rice, mung beans, cheese powder |
| Store name | SM, Quezon City 1118 |
| Store type | Department store |
| Date published | August 2022 |
| Launch type | New product |
| Price in US dollars | 3.14 |
This product is described as a cheese flavoured rice mung bean snack. It retails in a 365 gram pack and provides 0 grams trans fat, is low in salt, is high in protein and energy and contains no gluten or added sugar.
Unsweetened M.lk
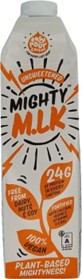
Source: Mintel, 2023
| Company / manufacturer | The Mighty Society |
|---|---|
| Distributor | Yummy Organics Food Products |
| Brand | Mighty M.lk |
| Category | Dairy alternatives, plant based drinks |
| Market | Philippines, imported by United Kingdom |
| Related claims | Added calcium, vitamin / mineral fortified low / no / reduced allergen, vegan / no animal ingredients, dairy / sugar free, plant based |
| Related ingredients | Pea protein isolate (3%), sunflower oil |
| Store name | Landmark PH, Taguig 1634 |
| Store type | Shopper, supermarket |
| Date published | February 2023 |
| Launch type | New product |
| Price in US dollars | 5.57 |
This product retails in a 1 litre pack. 100% vegan. Free from dairy, nuts and soy. Provides 24 gram of protein in every carton. Fortified with calcium, iodine, vitamin D and B12. Plant-based UHT plant protein based drink. Free from sugar. Contains 50% more calcium than cow's milk. A dairy-free alternative to milk made from yellow split peas. Also, available in a new variety drink format made from semi or whole pea protein isolate.
Special Pinoy Bawang Flavour Chip-Charon
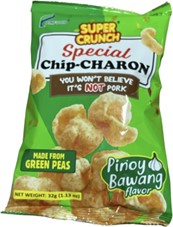
Source: Mintel, 2023
| Company / manufacturer | Prifood Corporation |
|---|---|
| Brand | Prifood Super Crunch |
| Sub-category | Snacks, bean-based |
| Market | Philippines, not imported |
| Related ingredients | Green peas, vegetable oil, tapioca starch, dehydrated potato, BHA antioxidant |
| Store name | Rustan's, Mandaluyong 1552 |
| Store type | Supermarket |
| Date published | May 2023 |
| Launch type | New packaging |
| Price in US dollars | 0.19 |
This product has been repackaged, and retails in a 32 gram pack. Made from green peas. An alternative to the favourite chicharon. Uses a special recipe made with green peas as its main ingredient, along with flavourings, spices and natural ingredients that make it flavourful and crunchy.
Hot & Spicy Flavour Crispy Green Pea Snack
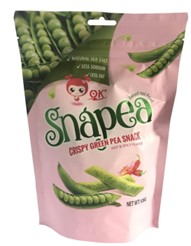
Source: Mintel, 2023
| Company / manufacturer | YanYan International (Phils.) Inc. |
|---|---|
| Brand | GG Bean OK Snapea |
| Category | Snacks, bean-based snacks |
| Market | Philippines |
| Related claims | Low / no / reduced fat and sodium |
| Related ingredients | Green peas, rice, vegetable oil |
| Store name | Landers Superstore, EDSA Balintawak QC,1106 |
| Store type | Club store |
| Date published | April 2021 |
| Launch type | New product |
| Price in US dollars | 1.02 |
This product is said to be baked not fried, and contains natural sea salt, less sodium and less fat. The product retails in a 108 gram pack.
For more information
The Canadian Trade Commissioner Service:
International Trade Commissioners can provide Canadian industry with on-the-ground expertise regarding market potential, current conditions and local business contacts, and are an excellent point of contact for export advice.
More agri-food market intelligence:
International agri-food market intelligence
Discover global agriculture and food opportunities, the complete library of Global Analysis reports, market trends and forecasts, and information on Canada's free trade agreements.
Agri-food market intelligence service
Canadian agri-food and seafood businesses can take advantage of a customized service of reports and analysis, and join our email subscription service to have the latest reports delivered directly to their inbox.
More on Canada's agriculture and agri-food sectors:
Canada's agriculture sectors
Information on the agriculture industry by sector. Data on international markets. Initiatives to support awareness of the industry in Canada. How the department engages with the industry.
For additional information on the World Food Expo (WOFEX) event held in Manila, Philippines, please contact:
The Trade Commissioner Service in the Philippines
Government of Canada
Infocentre-manila@international.gc.ca
Resources
- Euromonitor International. 17 January, 2018. Briefing: Food, Beverages and Tobacco Industry in Asia Pacific
- Euromonitor International. March 2022. Plant-Based Eating and Alternative Proteins in Middle East and Africa
- Mintel Global New Products Database, 2023
- Pilington, Alice. Mintel. March 8, 2023. Plant Based World Expo Europe: November 2022
- Strutton, Michelle. Mintel. July 14, 2014. Launched by Wellness Foods, Canada: Pea Protein now seen in snacks
- Walji, Amrin. Mintel. A year of innovation in plant-based drinks, yogurt & ice cream, 2023
Sector Trend Analysis – Plant-based pulse ingredients in the Philippines
Global Analysis Report
Prepared by: Erin-Ann Chauvin, Senior Market Analyst
© His Majesty the King in Right of Canada, represented by the Minister of Agriculture and Agri-Food (2023).
Photo credits
All photographs reproduced in this publication are used by permission of the rights holders.
All images, unless otherwise noted, are copyright His Majesty the King in Right of Canada.
To join our distribution list or to suggest additional report topics or markets, please contact:
Agriculture and Agri-Food Canada, Global Analysis1341 Baseline Rd, Tower 5, 3rd floor
Ottawa ON K1A 0C5
Canada
Email: aafc.mas-sam.aac@agr.gc.ca
The Government of Canada has prepared this report based on primary and secondary sources of information. Although every effort has been made to ensure that the information is accurate, Agriculture and Agri-Food Canada (AAFC) assumes no liability for any actions taken based on the information contained herein.
Reproduction or redistribution of this document, in whole or in part, must include acknowledgement of agriculture and agri-food Canada as the owner of the copyright in the document, through a reference citing AAFC, the title of the document and the year. Where the reproduction or redistribution includes data from this document, it must also include an acknowledgement of the specific data source(s), as noted in this document.
Agriculture and Agri-Food Canada provides this document and other report services to agriculture and food industry clients free of charge.