

Note: This report includes forecasting data that is based on baseline historical data.
Executive summary
This report covers sweet spreads in the United Kingdom, France, Germany, the Netherlands and Italy. Each of these markets have unique consumption trends and preferences, and Canadian exporters to these countries need to understand these complexities.
Canada has extensive trade in sweet spreads with the United Kingdom, France, Germany and the Netherlands, mostly in maple products. Trade with Italy is significantly more limited, however, but appears to be growing.
The sweet spreads market grew in each of our five focal markets from 2017 to 2022, and this holds across sweet spreads categories. Growth is forecasted for each market through 2027.
Nut and seed-based spreads are most popular in the United Kingdom and the Netherlands. They are moderately popular in Italy and France, and not particularly popular in Germany. It is worth noting that the leading nut and seed-based spread product in France is chestnut cream, which is produced locally.
Organic and natural spreads are popular in Europe, especially when it comes to peanut butter. Many of the leading sweet spreads brands are natural, naturally healthy or organic, and 3,246 new product launches between 2018 and 2022 were organic.
Private label products are generally quite popular across Europe, and this is particularly the case in the Netherlands, Germany and the United Kingdom. Certain brands, such as Ferrero's Nutella, are popular across Europe, while others are popular in specific markets. Generally speaking, each of our five European markets has its own favourite peanut butter brand, which will dominate the local retail landscape.
Overview
This custom report was prepared with a focus on nut and seed-based spreads, but covers all categories of sweet spreads. The top five markets for sales of nut and seed-based spreads in Western Europe were the United Kingdom, the Netherlands, Italy, France and GermanyFootnote 1.
Total sweet spreads sales in these five countries stood at US$6.7 billion in 2022, with total nut and seed-based spreads sales totaling US$445 millionFootnote 2. Germany was the leading market for sweet spreads, with US$2.2 billion in sales in 2022, followed by France and Italy. The leading country for nut and seed-based spreads sales in 2022 was the United Kingdom, with US$220 million in sales in 2022. Germany had the lowest nut and seed-based spreads sales in 2022, at US$28.3 million. Chocolate spreads were the most popular category for spreads in France, Italy and Germany. Jams and preserves were the most popular category for spreads in the United Kingdom. Nut and seed-based spreads were the most popular category in the Netherlands, with US$89.5 million in sales in 2022, representing 30% of the total sweet spreads market.
Altogether, these five countries imported US$5.7 billion in sweet spreads from the world in 2022, including US$109.8 million from Canada. Canadian imports increased in all five countries, most notably in the Netherlands.
Trade performance
United Kingdom imports
The United Kingdom imported US$1.4 billion in sweet spreads, honey, maple products and peanut butter in 2022, with a total volume of 955 million kilograms. By sales value, the UK's three largest import partners in 2022 were Belgium (US$192 million), Germany (US$165 million) and the Netherlands (US$163 million). The three leading import products were sugar confectionery, cane molasses and natural honey.
| HS code | Description | Value | Volume | Top import markets and value share in % | ||
|---|---|---|---|---|---|---|
| 1 | 2 | 3 | ||||
| Total - global imports | 1,394.2 | 954.9 | Belgium: 13.8 | Germany: 11.9 | Netherlands: 11.7 | |
| 170490 | Sugar confectionery not containing cocoa, including white chocolate | 781.2 | 233.7 | Germany: 17.7 | Belgium: 15.2 | Netherlands: 10.6 |
| 040900 | Natural honey | 127.1 | 51.4 | China: 41.5 | New Zealand: 19.0 | Mexico: 6.0 |
| 200799 | Jams, jellies, marmalades, purées or pastes of fruit, non-homogenized | 115.5 | 42.8 | France: 33.6 | Belgium: 19.2 | Germany: 13.2 |
| 170220 | Maple sugar, in solid form, and maple syrup | 28.9 | 4.3 | Canada: 87.2 | Denmark: 5.0 | Netherlands: 3.6 |
| 170310 | Cane molasses resulting from the extraction or refining of sugar | 127.8 | 516.3 | India: 33.3 | Netherlands: 19.7 | Pakistan: 12.8 |
| 170290 | Sugars in solid form,(excluding cane or beet sugar, chemically pure sucrose, lactose, maple sugar, glucose, fructose, and syrups thereof) | 88.3 | 64.4 | France: 41.7 | Belgium: 17.6 | Netherlands: 14.2 |
| 200811 | Peanut butter and other peanut preparations | 78.7 | 27.7 | Netherlands: 41.3 | Belgium: 26.3 | Argentina: 9.3 |
| 200710 | Jams, jellies, marmalades, purées or pastes of fruit, homogenized | 35.0 | 9.4 | Spain: 50.9 | Italy: 16.2 | Belgium: 15.7 |
| 200791 | Citrus fruit jams, jellies, marmalades, purées or pastes | 11.7 | 4.9 | France: 42.6 | Germany: 19.4 | Italy: 12.0 |
| Source: Global Trade Tracker, 2023 | ||||||
The United Kingdom reported US$27.4 million in imports from Canada in 2022, up from US$16.5 million in 2018. Maple sugar, syrup and products represented 92.0% of UK imports from Canada in 2022.
| HS code | Description | 2018 | 2019 | 2020 | 2021 | 2022 | CAGR* % 2018-2022 |
|---|---|---|---|---|---|---|---|
| Total - Imports from Canada | 16,483.1 | 18,820.2 | 26,187.2 | 28,420.0 | 27,350.5 | 13.5 | |
| 170490 | Sugar confectionery not containing cocoa, including white chocolate | 771.6 | 474.2 | 730.8 | 897.9 | 1,728.8 | 22.3 |
| 040900 | Natural honey | 57.3 | 57.8 | 253.6 | 110.3 | ||
| 200799 | Jams, jellies, marmalades, purées or pastes of fruit, non-homogenized | 222.1 | 250.1 | 231.6 | N/C | ||
| 170220 | Maple sugar, in solid form, and maple syrup | 15,617.4 | 16,892.3 | 23,895.8 | 27,021.7 | 25,150.9 | 12.7 |
| 170310 | Cane molasses resulting from the extraction or refining of sugar | 11.9 | N/C | ||||
| 170290 | Sugars in solid form,(excluding cane or beet sugar, chemically pure sucrose, lactose, maple sugar, glucose, fructose, and syrups thereof) | 4.4 | 5.1 | 3.5 | 81.0 | 107.3 | |
| 200811 | Peanut butter and other peanut preparations | 89.6 | 1,226.5 | 1,222.2 | 207.5 | 105.6 | 4.2 |
| 200710 | Jams, jellies, marmalades, purées or pastes of fruit, homogenized | 30.6 | N/C | ||||
| 200791 | Citrus fruit jams, jellies, marmalades, purées or pastes | 19.1 | N/C | ||||
|
Source: Global Trade Tracker, 2023 *CAGR: Compound Annual Growth Rate N/C: Not calculable |
|||||||
France imports
France imported US$1.2 billion in sweet spreads, honey, maple products and peanut butter in 2022, with a total volume of 562 million kilograms. France's three largest import partners by value were the Netherlands (US$241 million), Belgium (US$178 million) and Spain (US$155 million). The three leading import products were sugar confectionery, jams and jellies, and peanut butter.
| HS code | Description | Value | Volume | Top import markets and value share in % | ||
|---|---|---|---|---|---|---|
| 1 | 2 | 3 | ||||
| Total - global imports | 1,161.8 | 560.7 | Netherlands: 20.8 | Belgium: 15.3 | Spain: 13.3 | |
| 170490 | Sugar confectionery not containing cocoa, including white chocolate | 489.5 | 148.2 | Spain: 20.5 | Belgium: 17.0 | Germany: 16.1 |
| 040900 | Natural honey | 140.9 | 35.5 | Spain: 19.8 | China: 13.4 | Ukraine: 11.4 |
| 200799 | Jams, jellies, marmalades, purées or pastes of fruit, non-homogenized | 197.1 | 90.5 | Netherlands: 23.3 | Belgium: 20.3 | Italy: 20.2 |
| 170220 | Maple sugar, in solid form, and maple syrup | 29.2 | 3.7 | Canada: 92.3 | Netherlands: 4.0 | Mexico: 1.0 |
| 170310 | Cane molasses resulting from the extraction or refining of sugar | 31.6 | 127.6 | India: 66.0 | Belgium: 9.7 | Guatemala: 9.0 |
| 170290 | Sugars in solid form,(excluding cane or beet sugar, chemically pure sucrose, lactose, maple sugar, glucose, fructose, and syrups thereof) | 105.7 | 87.8 | Belgium: 22.2 | Netherlands: 20.4 | Slovakia: 9.5 |
| 200811 | Peanut butter and other peanut preparations | 148.5 | 60.8 | Netherlands: 66.3 | Belgium: 10.2 | Argentina: 6.2 |
| 200710 | Jams, jellies, marmalades, purées or pastes of fruit and nuts, homogenized | 13.3 | 4.1 | Spain: 26.2 | Italy: 17.6 | Belgium: 13.5 |
| 200791 | Citrus fruit jams, jellies, marmalades, purées or pastes | 5.9 | 2.4 | Italy: 36.1 | Belgium: 18.0 | United Kingdom: 17.0 |
| Source: Global Trade Tracker, 2023 | ||||||
France reported US$27.6 million in imports from Canada in 2022, up from US$12.1 million in 2018. Maple sugar, syrup and products represented 97.7% of UK imports from Canada in 2022.
| HS code | Description | 2018 | 2019 | 2020 | 2021 | 2022 | CAGR* % 2018-2022 |
|---|---|---|---|---|---|---|---|
| Total - Imports from Canada | 12,083.2 | 16,381.4 | 18,074.6 | 23,096.6 | 27,630.3 | 23.0 | |
| 170490 | Sugar confectionery not containing cocoa, including white chocolate | 128.4 | 162.9 | 79.1 | 101.4 | 159.4 | 5.6 |
| 040900 | Natural honey | 61.5 | 0.1 | 0.1 | 0.5 | 3.5 | −51.1 |
| 200799 | Jams, jellies, marmalades, purées or pastes of fruit, non-homogenized | 26.0 | 36.9 | 13.0 | 118.7 | 147.7 | 54.5 |
| 170220 | Maple sugar, in solid form, and maple syrup | 11,787.8 | 16,157.0 | 17,968.5 | 22,521.8 | 26,989.8 | 23.0 |
| 170310 | Cane molasses resulting from the extraction or refining of sugar | 0.7 | 0.4 | N/C | |||
| 170290 | Sugars in solid form,(excluding cane or beet sugar, chemically pure sucrose, lactose, maple sugar, glucose, fructose, and syrups thereof) | 77.4 | 10.5 | 4.8 | 4.4 | 42.3 | −14.0 |
| 200811 | Peanut butter and other peanut preparations | 0.5 | 3.1 | 0.8 | 339.9 | 286.9 | 392.4 |
| 200710 | Jams, jellies, marmalades, purées or pastes of fruit, homogenized | 1.3 | 3.7 | 4.7 | 2.0 | 0.6 | −18.5 |
| 200791 | Citrus fruit jams, jellies, marmalades, purées or pastes | 0.3 | 6.5 | 3.2 | 7.9 | N/C | |
|
Source: Global Trade Tracker, 2023 *CAGR: Compound Annual Growth Rate N/C: Not calculable |
|||||||
Netherlands imports
The Netherlands imported US$958.6 billion in sweet spreads, honey, maple products and peanut butter in 2022, with a total volume of 546 million kilograms. The Netherlands' three largest import partners were Belgium (US$212 million), Germany (US$188 million) and France (US$59 million). The three leading import products were sugar confectionary, jams and jellies, and solid sugars.
| HS code | Description | Value | Volume | Top import markets and value share in % | ||
|---|---|---|---|---|---|---|
| 1 | 2 | 3 | ||||
| Total - global imports | 958.6 | 546.1 | Belgium: 22.1 | Germany: 19.6 | France: 6.1 | |
| 170490 | Sugar confectionery not containing cocoa, including white chocolate | 461.2 | 118.2 | Belgium: 26.6 | Germany: 22.5 | Italy: 6.2 |
| 040900 | Natural honey | 67.6 | 17.8 | Germany: 25.4 | Belgium: 22.6 | China: 20.6 |
| 200799 | Jams, jellies, marmalades, purées or pastes of fruit, non-homogenized | 147.0 | 96.1 | Germany: 13.7 | Belgium: 11.9 | Turkey: 11.3 |
| 170220 | Maple sugar, in solid form, and maple syrup | 48.0 | 27.0 | Germany: 44.6 | Canada: 42.0 | Belgium: 9.1 |
| 170310 | Cane molasses resulting from the extraction or refining of sugar | 38.3 | 146.7 | India: 62.6 | Guatemala: 8.8 | United Kingdom: 6.5 |
| 170290 | Sugars in solid form,(excluding cane or beet sugar, chemically pure sucrose, lactose, maple sugar, glucose, fructose, and syrups thereof) | 127.4 | 112.0 | Belgium: 34.4 | France: 21.6 | China: 10.7 |
| 200811 | Peanut butter and other peanut preparations | 32.0 | 11.8 | Germany: 21.9 | India: 16.1 | Poland: 13.3 |
| 200710 | Jams, jellies, marmalades, purées or pastes of fruit and nuts, homogenized | 33.3 | 14.9 | Spain: 35.6 | Germany: 15.0 | France: 14.2 |
| 200791 | Citrus fruit jams, jellies, marmalades, purées or pastes | 3.7 | 1.6 | Germany: 47.0 | United Kingdom: 21.6 | France: 15.9 |
| Source: Global Trade Tracker, 2023 | ||||||
Canadian imports from the Netherlands increased significantly from 2018 to 2022, driven by growth in maple sugar and syrup imports, which accounted for 92.7% of Canadian imports by value in 2022. It is worth noting that Canada accounted for only 42% of the Netherlands' reported maple imports in 2022, behind Germany, which indicates that the Netherlands may be misreporting the origin of its maple importsFootnote 3. If this error was even more pronounced prior to 2020, maple imports in previous years would be significantly understated.
| HS code | Description | 2018 | 2019 | 2020 | 2021 | 2022 | CAGR* % 2018-2022 |
|---|---|---|---|---|---|---|---|
| Total - Imports from Canada | 147.5 | 6,534.7 | 13,418.1 | 14,874.7 | 21,775.2 | 248.6 | |
| 170490 | Sugar confectionery not containing cocoa, including white chocolate | 16.8 | 88.8 | 54,0 | 462.8 | 1,337.0 | 198.7 |
| 040900 | Natural honey | 1.7 | 11.8 | 1.5 | 0.3 | 2.8 | 14.2 |
| 200799 | Jams, jellies, marmalades, purées or pastes of fruit, non-homogenized | 0.4 | 16.0 | 31.3 | 7.1 | 0.3 | −8.0 |
| 170220 | Maple sugar, in solid form, and maple syrup | 6,035.1 | 12,544.8 | 13,550.1 | 20,192.5 | N/C | |
| 170310 | Cane molasses resulting from the extraction or refining of sugar | 0.0 | N/C | ||||
| 170290 | Sugars in solid form,(excluding cane or beet sugar, chemically pure sucrose, lactose, maple sugar, glucose, fructose, and syrups thereof) | 0.0 | 208.7 | 188.2 | 209.0 | 127.4 | 772.4 |
| 200811 | Peanut butter and other peanut preparations | 128.5 | 174.2 | 598.3 | 643.8 | 115.0 | −2.7 |
| 200710 | Jams, jellies, marmalades, purées or pastes of fruit, homogenized | 0.1 | 0.1 | 0.0 | 1.7 | 0.1 | −1.2 |
| 200791 | Citrus fruit jams, jellies, marmalades, purées or pastes | N/C | |||||
|
Source: Global Trade Tracker, 2023 *CAGR: Compound Annual Growth Rate N/C: Not Calculable |
|||||||
Germany imports
In 2022, Germany imported US$1.7 billion in sweet spreads, honey, maple products and peanut butter, with a total volume of 663 million kilograms. By sales value, Germany's three largest import partners in 2022 were the Netherlands (US$185 million), Belgium (US$164 million) and France (US$126 million). The three leading import products by value were sugar confectionery, natural honey and jams and jellies.
| HS code | Description | Value | Volume | Top import markets and value share in % | ||
|---|---|---|---|---|---|---|
| 1 | 2 | 3 | ||||
| Total - global imports | 1,684.5 | 663.3 | Netherlands: 11.0 | Belgium: 9.7 | France: 7.5 | |
| 170490 | Sugar confectionery not containing cocoa, including white chocolate | 737.1 | 194.4 | Netherlands: 14.7 | Belgium: 13.1 | Poland: 12.4 |
| 040900 | Natural honey | 302.5 | 75.1 | Ukraine: 14.3 | Argentina: 13.2 | Mexico: 12.6 |
| 200799 | Jams, jellies, marmalades, purées or pastes of fruit, non-homogenized | 263.1 | 112.8 | Italy: 19.4 | Austria: 17.5 | France: 13.9 |
| 170220 | Maple sugar, in solid form, and maple syrup | 31.4 | 4.2 | Canada: 93.1 | Netherlands: 3.6 | United States: 1.8 |
| 170310 | Cane molasses resulting from the extraction or refining of sugar | 15.0 | 58.1 | India: 51.5 | Paraguay: 15.5 | Nicaragua: 12.3 |
| 170290 | Sugars in solid form,(excluding cane or beet sugar, chemically pure sucrose, lactose, maple sugar, glucose, fructose, and syrups thereof) | 167.3 | 163.9 | France: 34.9 | Belgium: 16.6 | Netherlands: 10.8 |
| 200811 | Peanut butter and other peanut preparations | 106.6 | 37.2 | Netherlands: 30.4 | Luxembourg: 17.9 | Poland: 8.7 |
| 200710 | Jams, jellies, marmalades, purées or pastes of fruit and nuts, homogenized | 50.4 | 13.7 | Spain: 32.4 | Belgium: 22.9 | Italy: 18.0 |
| 200791 | Citrus fruit jams, jellies, marmalades, purées or pastes | 11.1 | 4.0 | United Kingdom: 25.9 | Denmark: 17.9 | France: 17.2 |
| Source: Global Trade Tracker, 2023 | ||||||
Germany's reported imports from Canada totalled US$29.5 million in 2022, up slightly from US$24.9 million in 2018. The vast majority of this import value (99.3%) was maple sugar and syrup, which grew at 4.6% CAGR from 2018 to 2022.
| HS code | Description | 2018 | 2019 | 2020 | 2021 | 2022 | CAGR* % 2018-2022 |
|---|---|---|---|---|---|---|---|
| Total - Imports from Canada | 24,911.7 | 28,751.2 | 33,830.1 | 38,029.3 | 29,509.2 | 4.3 | |
| 170490 | Sugar confectionery not containing cocoa, including white chocolate | 293.2 | 166.0 | 102.3 | 46.9 | 147.2 | −15.8 |
| 040900 | Natural honey | 65.6 | 3,8 | 437.1 | 8.0 | 10.8 | −36.3 |
| 200799 | Jams, jellies, marmalades, purées or pastes of fruit, non-homogenized | 0.9 | 1.1 | N/C | |||
| 170220 | Maple sugar, in solid form, and maple syrup | 24,457.2 | 26,554.5 | 30,665.0 | 37,830.4 | 29,272.7 | 4.6 |
| 170310 | Cane molasses resulting from the extraction or refining of sugar | N/C | |||||
| 170290 | Sugars in solid form,(excluding cane or beet sugar, chemically pure sucrose, lactose, maple sugar, glucose, fructose, and syrups thereof) | 45.5 | 8.0 | 1.4 | 13.5 | 49.2 | 2.0 |
| 200811 | Peanut butter and other peanut preparations | 50.3 | 2,018.1 | 2,624.2 | 128.4 | 28.3 | −13.4 |
| 200710 | Jams, jellies, marmalades, purées or pastes of fruit, homogenized | 2.2 | N/C | ||||
| 200791 | Citrus fruit jams, jellies, marmalades, purées or pastes | 0.0 | N/C | ||||
|
Source: Global Trade Tracker, 2023 *CAGR: Compound Annual Growth Rate N/C: Not calculable |
|||||||
Italy imports
Italy imported US$530.7 million in sweet spreads, honey, maple products and peanut butter, with a total volume of 309 million kilograms. By sales value, Italy's three largest import partners in 2022 were Germany (US$104 million), Spain (US$72 million) and France (US$45 million). The three leading import products by value were sugar confectionery, natural honey and jams and jellies.
| HS code | Description | Value | Volume | Top import markets and value share in % | ||
|---|---|---|---|---|---|---|
| 1 | 2 | 3 | ||||
| Total - global imports | 530.7 | 309.0 | Germany: 19.7 | Spain: 13.6 | France: 8.5 | |
| 170490 | Sugar confectionery not containing cocoa, including white chocolate | 189.3 | 54.1 | Germany: 24.2 | Spain: 18.3 | Belgium: 11.8 |
| 040900 | Natural honey | 106.1 | 26.2 | Hungary: 34.7 | Romania: 15.0 | Spain: 7.5 |
| 200799 | Jams, jellies, marmalades, purées or pastes of fruit, non-homogenized | 104.8 | 35.9 | Germany: 35.8 | Spain: 16.0 | Turkey: 15.5 |
| 170220 | Maple sugar, in solid form, and maple syrup | 7.9 | 1.9 | Canada: 44.5 | Denmark: 14.1 | Germany: 11.6 |
| 170310 | Cane molasses resulting from the extraction or refining of sugar | 35.6 | 138.5 | India: 42.1 | Pakistan: 41.5 | UAE: 4.5 |
| 170290 | Sugars in solid form,(excluding cane or beet sugar, chemically pure sucrose, lactose, maple sugar, glucose, fructose, and syrups thereof) | 59.5 | 43.6 | France: 29.3 | Netherlands: 15.4 | Spain: 14.2 |
| 200811 | Peanut butter and other peanut preparations | 18.3 | 5.4 | Netherlands: 33.9 | Germany: 33.4 | Spain: 7.5 |
| 200710 | Jams, jellies, marmalades, purées or pastes of fruit and nuts, homogenized | 6.9 | 2.6 | Germany: 34.4 | Spain: 31.1 | Greece: 17.3 |
| 200791 | Citrus fruit jams, jellies, marmalades, purées or pastes | 2.3 | 1.0 | Germany: 25.6 | Spain: 22.5 | France: 19.4 |
| Source: Global Trade Tracker, 2023 | ||||||
Italy reported US$3.5 million in imports from Canada in 2022, almost all of which (99.1%) were maple sugar and syrup imports. Imports grew at 14.8% CAGR from 2018 to 2022, but remain small compared to other European countries.
| HS code | Description | 2018 | 2019 | 2020 | 2021 | 2022 | CAGR* % 2018-2022 |
|---|---|---|---|---|---|---|---|
| Total - Imports from Canada | 2,036.8 | 2,195.7 | 2,935.8 | 4,941.9 | 3,541.2 | 14.8 | |
| 170490 | Sugar confectionery not containing cocoa, including white chocolate | 3.9 | 9.3 | 1.3 | 1.4 | 13.1 | 35.7 |
| 040900 | Natural honey | N/C | |||||
| 200799 | Jams, jellies, marmalades, purées or pastes of fruit, non-homogenized | N/C | |||||
| 170220 | Maple sugar, in solid form, and maple syrup | 2,029.4 | 2,183.5 | 2,904.0 | 4,909.8 | 3,509.9 | 14.7 |
| 170310 | Cane molasses resulting from the extraction or refining of sugar | N/C | |||||
| 170290 | Sugars in solid form,(excluding cane or beet sugar, chemically pure sucrose, lactose, maple sugar, glucose, fructose, and syrups thereof) | 4.4 | N/C | ||||
| 200811 | Peanut butter and other peanut preparations | 2.9 | 26.1 | 30.6 | 18.2 | N/C | |
| 200710 | Jams, jellies, marmalades, purées or pastes of fruit, homogenized | 3.5 | N/C | ||||
| 200791 | Citrus fruit jams, jellies, marmalades, purées or pastes | 35.7 | |||||
|
Source: Global Trade Tracker, 2023 *CAGR: Compound Annual Growth Rate N/C: Not calculable |
|||||||
Market sizes
United Kingdom market sizes
Retail sales of sweet spreads in the United Kingdom reached US$980.0 million in 2022, with the most popular category being jams and preserves. Retail sales grew in value by 6.8% CAGR from 2017 to 2022, and are forecasted to continue growing by 4.1% CAGR through 2027Footnote 4. Nut and seed based spreads had the fastest growth over this period, at 10.4% CAGR from 2018 to 2022. High growth in this category is forecasted through 2027, at 5.2% CAGR.
| Category | 2017 | 2022 | CAGR* % 2017-2022 | 2023 | 2027 | CAGR* % 2022-2027 |
|---|---|---|---|---|---|---|
| Sweet spreads | 703.9 | 980.0 | 6.8 | 1,032.4 | 1,197.3 | 4.1 |
| Honey | 195.9 | 250.4 | 5.0 | 263.4 | 299.8 | 3.7 |
| Chocolate spreads | 118.3 | 167.8 | 7.2 | 176.4 | 212.1 | 4.8 |
| Jams and preserves | 255.5 | 341.9 | 6.0 | 359.4 | 402.1 | 3.3 |
| Nut and seed based spreads | 134.2 | 219.9 | 10.4 | 233.3 | 283.4 | 5.2 |
|
Source: Euromonitor International, 2023, all rights reserved *CAGR: Compound Annual Growth Rate |
||||||
France market sizes
Retail sales of sweet spreads in France reached US$1.8 billion in 2022, up from US$1.6 billion in 2017. Sales grew by 2.7% from 2017 to 2022, primarily driven by chocolate spreads, which grew by 4.8% CAGR over this period. Nut and seed-based spreads were the fastest growing category in France, but remain marginal in the market. Growth in sweet spreads is forecasted at 3.0% CAGR from 2022 to 2027, and this will hold across the three major categories, with nut and seed-based spreads having faster growth at 4.7%.
| Category | 2017 | 2022 | CAGR* % 2017-2022 | 2023 | 2027 | CAGR* % 2022-2027 |
|---|---|---|---|---|---|---|
| Sweet spreads | 1,579.7 | 1,809.1 | 2.7 | 1,868.8 | 2,101.8 | 3.0 |
| Honey | 446.8 | 483.9 | 1.6 | 499.2 | 559.8 | 3.0 |
| Chocolate spreads | 554.5 | 699.5 | 4.8 | 722.8 | 816.0 | 3.1 |
| Jams and preserves | 542.5 | 575.9 | 1.2 | 593.3 | 663.5 | 2.9 |
| Nut and seed based spreads | 35.8 | 49.8 | 6.8 | 53.5 | 62.5 | 4.7 |
|
Source: Euromonitor International, 2023, all rights reserved *CAGR: Compound Annual Growth Rate |
||||||
Netherlands market sizes
The Netherlands is not a large market for sweet spreads, with only US$298.6 million in sales in 2022. However, nut and seed-based spreads are the most popular category of spread in the Netherlands, with US$89.5 million in sales (30% of total sweet spread sales). Sweet spread growth is forecasted at 1.9% CAGR through 2027, with growth in nut and seed-based spreads forecasted at 2.3%.
| Category | 2017 | 2022 | CAGR* % 2017-2022 | 2023 | 2027 | CAGR* % 2022-2027 |
|---|---|---|---|---|---|---|
| Sweet spreads | 252.2 | 298.6 | 3.4 | 312.2 | 327.9 | 1.9 |
| Honey | 38.7 | 48.7 | 4.7 | 51.6 | 59.5 | 4.1 |
| Chocolate spreads | 70.7 | 82.3 | 3.1 | 86.4 | 85.8 | 0.8 |
| Jams and preserves | 68.2 | 78.1 | 2.7 | 82.0 | 82.3 | 1.0 |
| Nut and seed based spreads | 74.6 | 89.5 | 3.7 | 92.1 | 100.4 | 2.3 |
|
Source: Euromonitor International, 2023, all rights reserved *CAGR: Compound Annual Growth Rate |
||||||
Germany market sizes
Germany was the largest market for sweet spreads in Western Europe in 2022, at US$2.2 billion dollars in retail sales. The German sweet spreads market grew by 7.2% CAGR from 2017 to 2022. Chocolate spreads were the fastest-growing category, with 11.5% CAGR from 2017 to 2022, and they are now the largest category as a result. Nonetheless, sweet spreads sales are fairly evenly divided between honey, chocolate spreads and jams and preserves, with nut and seed-based spreads being a marginal part of the market. Growth in sweet spreads is forecasted at 2.7% CAGR from 2022 to 2027, driven primarily by growth in honey, which is expected to be the second largest spread category in Germany. Chocolate spreads are expected to lose ground, with only 0.9% forecasted CAGR through 2027.
| Category | 2017 | 2022 | CAGR* % 2017-2022 | 2023 | 2027 | CAGR* % 2022-2027 |
|---|---|---|---|---|---|---|
| Sweet spreads | 1,576.1 | 2,230.0 | 7.2 | 2,295.6 | 2,541.7 | 2.7 |
| Honey | 523.2 | 708.3 | 6.2 | 737.1 | 847.5 | 3.7 |
| Chocolate spreads | 437.5 | 755.0 | 11.5 | 758.3 | 789.7 | 0.9 |
| Jams and preserves | 592.7 | 738.4 | 4.5 | 770.1 | 866.7 | 3.3 |
| Nut and seed based spreads | 22.7 | 28.3 | 4.5 | 30.2 | 37.7 | 5.9 |
|
Source: Euromonitor International, 2023, all rights reserved *CAGR: Compound Annual Growth Rate |
||||||
Italy market sizes
Retail sales of sweet spreads in Italy reached US$1.4 billion in 2022. Retail sales grew at 3.7% CAGR from 2017 to 2022. Chocolate spreads were both the most important and fastest-growing market category, with 4.7% CAGR. Growth in sweet spreads is forecasted at 4.1% through 2027, with 5.1% CAGR for chocolate spreads over the same period. Nut and seed-based spreads sales in Italy are small relative to the market, but more important than in France or Germany.
| Category | 2017 | 2022 | CAGR* % 2017-2022 | 2023 | 2027 | CAGR* % 2022-2027 |
|---|---|---|---|---|---|---|
| Sweet spreads | 1,138.1 | 1,362.4 | 3.7 | 1,438.4 | 1,665.3 | 4.1 |
| Honey | 256.6 | 280.7 | 1.8 | 286.9 | 305.1 | 1.7 |
| Chocolate spreads | 436.3 | 550.0 | 4.7 | 588.8 | 706.2 | 5.1 |
| Jams and preserves | 397.0 | 474.7 | 3.6 | 501.7 | 581.6 | 4.1 |
| Nut and seed based spreads | 48.1 | 57.0 | 3.4 | 61.0 | 72.3 | 4.9 |
|
Source: Euromonitor International, 2023, all rights reserved *CAGR: Compound Annual Growth Rate |
||||||
Competitive landscape
United Kingdom competitive landscape
The sweet spreads landscape in the United Kingdom is fairly competitive, both in terms of company and brand share. Certain companies, such as Ferrero, have a flagship product in one market category, while others, such as Hain Celestial, have a flagship product in each market category. Private labels have a high market share, representing 36.4% of the market in 2022.
| Company | 2017 | 2018 | 2019 | 2020 | 2021 | 2022 | CAGR* % 2017-2022 |
|---|---|---|---|---|---|---|---|
| Total | 100 | 100 | 100 | 100 | 100 | 100 | 6.8 |
| Ferrero & related parties | 12.0 | 12.2 | 11.5 | 11.7 | 12.0 | 12.1 | 7.0 |
| Valeo Foods Ltd | 11.3 | 11.8 | 12.0 | 12.4 | 11.0 | 11.2 | 6.7 |
| The Hain Celestial Group Inc | 13.1 | 12.7 | 12.4 | 11.4 | 11.4 | 10.8 | 2.9 |
| Ecotone | 4.3 | 4.9 | 5.2 | 5.6 | 5.6 | 5.7 | N/C |
| Andros SAS | 5.3 | 5.4 | 5.4 | 5.5 | 5.5 | 5.3 | 6.7 |
| SHS Group | 1.4 | 1.7 | 2.1 | 2.4 | 2.4 | 2.9 | N/C |
| Wilkin & Sons Ltd | 2.4 | 2.4 | 2.4 | 2.2 | 2.2 | 2.0 | 3.5 |
| St Dalfour Frères | 1.4 | 1.3 | 1.2 | 1.1 | 1.1 | 1.2 | 3.3 |
| Hilltop Honey Ltd | 0.3 | 0.4 | 0.5 | 0.7 | 0.7 | 0.7 | 26.9 |
| Pip & Nut Ltd | 0.5 | 0.9 | 1.0 | 1.0 | 1.0 | 0.6 | 12.8 |
| Private label | 37.4 | 37.7 | 38.1 | 36.3 | 36.0 | 36.4 | 6.2 |
| Others | 10.6 | 8.6 | 8.2 | 9.7 | 11.1 | 11.1 | 10.6 |
|
Source: Euromonitor International Limited, 2023, all rights reserved *CAGR: Compound Annual Growth Rate N/C: Not calculable |
|||||||
| Brand | 2017 | 2018 | 2019 | 2020 | 2021 | 2022 | CAGR* % 2017-2022 |
|---|---|---|---|---|---|---|---|
| Total | 100 | 100 | 100 | 100 | 100 | 100 | 6.8 |
| Nutella (Ferrero) | 12.0 | 12.2 | 11.5 | 11.7 | 12.0 | 12.1 | 7.0 |
| Rowse (Valeo Foods) | 11.3 | 11.8 | 12.0 | 12.4 | 11.0 | 11.2 | 6.7 |
| Whole Earth (Ecotone[1]) | 4.3 | 4.9 | 5.2 | 5.6 | 5.6 | 5.7 | N/C |
| Bonne Maman (Andros SAS) | 5.3 | 5.4 | 5.4 | 5.5 | 5.5 | 5.3 | 6.7 |
| Sun Pat (Hain Celestial) | 4.0 | 4.0 | 4.0 | 3.7 | 3.7 | 3.7 | 5.2 |
| Hartley's (Hain Celestial) | 4.5 | 4.3 | 4.2 | 3.9 | 3.9 | 3.4 | 1.2 |
| Meridian (SHS Group[1]) | 1.4 | 1.7 | 2.1 | 2.4 | 2.4 | 2.9 | N/C |
| Robertson's (Hain Celestial) | 2.9 | 2.8 | 2.8 | 2.5 | 2.4 | 2.5 | 3.9 |
| Tiptree (Wilkin & Sons Ltd) | 2.4 | 2.4 | 2.4 | 2.2 | 2.2 | 2.0 | 3.5 |
| St Dalfour (St Dalfour Frères) | 1.4 | 1.3 | 1.2 | 1.1 | 1.1 | 1.2 | 3.3 |
| Private label | 37.4 | 37.7 | 38.1 | 36.3 | 36.0 | 36.4 | 6.2 |
| Others | 13.1 | 11.5 | 11.1 | 12.7 | 14.2 | 13.6 | 10.6 |
|
Source: Euromonitor International Limited, 2023, all rights reserved *CAGR: Compound Annual Growth Rate 1: Whole Earth was manufactured by Kallo Foods prior to 2021. Meridian was manufactured by 3V Natural Foods prior to 2018. CAGR growth was not calculated due to this change. N/C: Not calculable |
|||||||
The nut and seed-based spreads market in the United Kingdom is more concentrated than the overall sweet spreads market. The top 3 brands had a collective market share of 54.9% in 2022. Private labels are still quite present, with 28.4% market share in 2022. This represents a decline from 2017, however, when private labels represented 38.0% of the market. Retail sales of private labels grew by 4.1% CAGR from 2017 to 2022, as opposed to 10.4% for the overall nut and seed-based spreads market.
| Company | 2017 | 2018 | 2019 | 2020 | 2021 | 2022 | CAGR* % 2017-2022 |
|---|---|---|---|---|---|---|---|
| Total | 100 | 100 | 100 | 100 | 100 | 100 | 10.4 |
| Ecotone/Kallo Foods Ltd | 22.6 | 24.2 | 24.3 | 25.3 | 24.5 | 25.6 | N/C |
| The Hain Celestial Group Inc | 21.0 | 19.7 | 18.7 | 16.5 | 16.3 | 16.5 | 5.2 |
| SHS Group/3V Natural Foods | 7.2 | 8.2 | 9.8 | 10.6 | 10.5 | 12.8 | N/C |
| Pip & Nut Ltd | 2.5 | 4.3 | 4.9 | 4.6 | 4.5 | 2.8 | 12.8 |
| Hormel Foods Corp | 3.0 | 2.8 | 2.6 | 2.3 | 2.2 | 1.9 | 1.2 |
| Private Label | 38.0 | 35.5 | 33.5 | 29.7 | 28.4 | 28.4 | 4.1 |
| Others | 5.7 | 5.2 | 6.0 | 11.0 | 13.6 | 12.0 | 28.0 |
|
Source: Euromonitor International Limited, 2023, all rights reserved *CAGR: Compound Annual Growth Rate N/C: Not calculable |
|||||||
| Brand | 2017 | 2018 | 2019 | 2020 | 2021 | 2022 | CAGR* % 2017-2022 |
|---|---|---|---|---|---|---|---|
| Total | 100 | 100 | 100 | 100 | 100 | 100 | 10.4 |
| Whole Earth[1] | 22.6 | 24.2 | 24.3 | 25.3 | 24.5 | 25.6 | N/C |
| Sun Pat | 21.0 | 19.7 | 18.7 | 16.5 | 16.3 | 16.5 | 5.2 |
| Meridian[1] | 7.2 | 8.2 | 9.8 | 10.6 | 10.5 | 12.8 | N/C |
| Pip & Nut | 2.5 | 4.3 | 4.9 | 4.6 | 4.5 | 2.8 | 12.8 |
| Skippy | 3.0 | 2.8 | 2.6 | 2.3 | 2.2 | 1.9 | 1.2 |
| Private label | 38.0 | 35.5 | 33.5 | 29.7 | 28.4 | 28.4 | 4.1 |
| Others | 5.7 | 5.2 | 6.0 | 11.0 | 13.6 | 12.0 | 28.0 |
|
Source: Euromonitor International Limited, 2023, all rights reserved *CAGR: Compound Annual Growth Rate 1: Whole Earth was manufactured by Kallo Foods prior to 2021. Meridian was manufactured by 3V Natural Foods prior to 2018. CAGR growth was not calculated due to this change. N/C: Not calculable |
|||||||
France competitive landscape
The French sweet spreads market is very concentrated, with the top three companies having a combined 51.9% market share in 2022. Private labels represented 20.8% of the market in 2022, down from 22.2% in 2017.
| Company | 2017 | 2018 | 2019 | 2020 | 2021 | 2022 | CAGR* % 2017-2022 |
|---|---|---|---|---|---|---|---|
| Total | 100 | 100 | 100 | 100 | 100 | 100 | 2.7 |
| Ferrero & related parties | 23.8 | 23.1 | 22.7 | 22.6 | 23.2 | 23.4 | 2.3 |
| Andros SAS | 15.6 | 15.3 | 15.2 | 14.5 | 16.2 | 16.3 | 3.7 |
| Bernard Michaud SA | 13.4 | 13.0 | 12.6 | 13.0 | 12.2 | 12.2 | 0.9 |
| Rigoni di Asiago Srl | 1.2 | 1.7 | 2.3 | 2.9 | 3.2 | 3.4 | 25.5 |
| Lucien Georgelin SA | 2.5 | 2.6 | 3.1 | 3.2 | 3.2 | 3.1 | 7.6 |
| Naturalim France Miel | 1.5 | 1.6 | 1.8 | 1.8 | 1.7 | 1.7 | 6.0 |
| Bel, Groupe | 1.5 | 1.5 | 1.5 | 1.5 | 1.5 | 1.5 | 2.3 |
| Clément Faugier SA | 1.3 | 1.3 | 1.3 | 1.2 | 1.3 | 1.2 | 2.4 |
| Confiturerie & Confiserie D'Andresy SA | 1.1 | 1.1 | 1.2 | 1.1 | 1.1 | 1.1 | 3.5 |
| Apidis SA | 1.1 | 1.1 | 1.2 | 1.2 | 1.1 | 1.1 | 3.6 |
| Private Label | 22.2 | 21.7 | 21.6 | 21.4 | 20.7 | 20.8 | 1.5 |
| Others | 14.8 | 16.0 | 15.5 | 15.6 | 14.6 | 14.2 | −2.1 |
|
Source: Euromonitor International Limited, 2023, all rights reserved *CAGR: Compound Annual Growth Rate |
|||||||
| Brand | 2017 | 2018 | 2019 | 2020 | 2021 | 2022 | CAGR* % 2017-2022 |
|---|---|---|---|---|---|---|---|
| Total | 100 | 100 | 100 | 100 | 100 | 100 | 2.7 |
| Nutella (Ferrero & related parties) | 23.8 | 23.1 | 22.7 | 22.6 | 23.2 | 23.4 | 2.3 |
| Bonne Maman (Andros SAS) | 12.2 | 12.2 | 12.2 | 11.7 | 13.5 | 13.6 | 5.1 |
| Lune de Miel (Bernard Michaud SA) | 9.6 | 9.2 | 8.9 | 9.3 | 8.6 | 8.6 | 0.5 |
| Lucien Georgelin (Lucien Georgelin SA) | 2.5 | 2.6 | 3.1 | 3.2 | 3.2 | 3.1 | 7.6 |
| Andros (Andros SAS) | 3.4 | 3.1 | 3.0 | 2.7 | 2.7 | 2.7 | −1.7 |
| Nocciolata (Rigoni di Asiago Srl) | 0.6 | 0.9 | 1.4 | 2.0 | 2.4 | 2.5 | 39.3 |
| Miel l'Apiculteur (Bernard Michaud SA) | 2.7 | 2.6 | 2.6 | 2.6 | 2.5 | 2.5 | 1.2 |
| Miel (Naturalim France Miel) | 1.5 | 1.6 | 1.8 | 1.8 | 1.7 | 1.7 | 6.0 |
| Confipote (Bel, Groupe) | 1.5 | 1.5 | 1.5 | 1.5 | 1.5 | 1.5 | 2.3 |
| Crème de marrons d'Ardèche (Clément Faugier SA) | 1.3 | 1.3 | 1.3 | 1.2 | 1.3 | 1.2 | 2.4 |
| Nutella (Ferrero & related parties) | 22.2 | 21.7 | 21.6 | 21.4 | 20.7 | 20.8 | 1.5 |
| Others | 18.7 | 13.0 | 12.1 | 11.5 | 9.9 | 9.5 | −2.1 |
|
Source: Euromonitor International Limited, 2023, all rights reserved *CAGR: Compound Annual Growth Rate |
|||||||
The nut and seed-based spreads market is extremely concentrated: the top two companies had a combined 76.0% market share in 2022. The leading nut and seed-based spread brand in France is Crème de marrons de l'Ardèche, a sweet chestnut spread. The second leading brand is Jardin Bio Etic, a peanut butter brand whose sales increased by 11.3% CAGR from 2017 to 2022. Private labels are not particularly popular, with only 10.0% market share in 2022, but this market share is still higher than in 2017, when it was 6.0%.
| Company | 2017 | 2018 | 2019 | 2020 | 2021 | 2022 | CAGR* % 2017-2022 |
|---|---|---|---|---|---|---|---|
| Total | 100 | 100 | 100 | 100 | 100 | 100 | 6.8 |
| Clément Faugier SA | 55.6 | 55.4 | 53.9 | 52.6 | 47.8 | 45.1 | 2.4 |
| Groupe Léa Nature | 25.1 | 25.3 | 28.6 | 29.0 | 32.1 | 30.9 | 11.3 |
| Menguy's | 4.6 | 4.9 | 5.0 | 4.8 | 4.8 | 5.0 | 8.7 |
| Hormel Foods Corp | 1.6 | 1.7 | 1.8 | 1.8 | 3.1 | 4.0 | 28.0 |
| Rapunzel Naturkost GmbH | 0.6 | 0.6 | 0.6 | 0.6 | 0.6 | 0.6 | 9.5 |
| Private Label | 6.0 | 6.2 | 6.1 | 7.0 | 7.4 | 10.0 | 18.1 |
| Others | 6.4 | 5.9 | 4.0 | 4.1 | 4.2 | 4.3 | −1.6 |
|
Source: Euromonitor International Limited, 2023, all rights reserved *CAGR: Compound Annual Growth Rate |
|||||||
| Brand | 2017 | 2018 | 2019 | 2020 | 2021 | 2022 | CAGR* % 2017-2022 |
|---|---|---|---|---|---|---|---|
| Total | 100 | 100 | 100 | 100 | 100 | 100 | 6.8 |
| Crème de marrons de l'Ardèche (Clément Faugier SA) | 55.6 | 55.4 | 53.9 | 52.6 | 47.8 | 45.1 | 2.4 |
| Jardin Bio Etic (Groupe Léa Nature) | 25.1 | 25.3 | 28.6 | 29.0 | 32.1 | 30.9 | 11.3 |
| Menguy's | 4.6 | 4.9 | 5.0 | 4.8 | 4.8 | 5.0 | 8.7 |
| Skippy (Hormel Foods Corp) | 1.6 | 1.7 | 1.8 | 1.8 | 3.1 |
4.0 |
28.0 |
| Rapunzel (Rapunzel Naturkost) | 0.6 | 0.6 | 0.6 | 0.6 | 0.6 | 0.6 | 9.5 |
| Private label | 6.0 | 6.2 | 6.1 | 7.0 | 7.4 | 10.0 | 18.1 |
| Others | 6.4 | 5.9 | 4.0 | 4.1 | 4.2 | 4.3 | −1.6 |
|
Source: Euromonitor International Limited, 2023, all rights reserved *CAGR: Compound Annual Growth Rate |
|||||||
Netherlands competitive landscape
The sweet spreads landscape in the Netherlands is competitive: the top two companies have a combined market share of 20.9%, and private labels had a 33.6% market share in 2022. The market has concentrated slightly, with total growth outpacing growth for private labels and companies outside the top ten experiencing shrinking retail sales.
As is the case for the United Kingdom, each company in the Netherlands has its flagship brand, with company market shares corresponding to brand market shares.
| Company | 2017 | 2018 | 2019 | 2020 | 2021 | 2022 | CAGR* % 2017-2022 |
|---|---|---|---|---|---|---|---|
| Total | 100 | 100 | 100 | 100 | 100 | 100 | 3.4 |
| Unilever Group | 10.6 | 10.2 | 10.5 | 10.6 | 10.7 | 10.5 | 3.2 |
| Ferrero & related parties | 9.7 | 9.5 | 9.5 | 9.6 | 9.7 | 10.4 | 4.9 |
| Hero Group GmbH | 8.0 | 7.7 | 7.6 | 7.7 | 7.8 | 7.5 | 2.2 |
| Fürsten-Reform Dr Med Hans Plümer Nachf GmbH & Co | 6.5 | 6.5 | 6.6 | 6.7 | 6.7 | 7.5 | 6.3 |
| Peeters Produkten BV | 6.2 | 5.9 | 5.8 | 5.8 | 5.8 | 5.4 | 0.6 |
| Andros SAS | 4.0 | 4.0 | 3.9 | 4.0 | 4.0 | 4.2 | 4.7 |
| Mister Kitchen BV | 1.6 | 2.6 | 2.6 | 2.6 | 3.2 | N/C | |
| Melvita BV | 1.5 | 1.4 | 1.5 | 1.5 | 1.6 | 1.6 | 4.0 |
| Fair Trade Original BV | 0.9 | 1.0 | 1.0 | 1.0 | 1.0 | 1.1 | 6.8 |
| Kraft Heinz Co | 0.8 | 0.8 | 0.8 | 0.8 | 0.7 | 0.8 | 2.8 |
| Private Label | 34.4 | 33.8 | 33.9 | 33.9 | 34.3 | 33.6 | 3.0 |
| Others | 17.4 | 17.6 | 16.3 | 15.8 | 15.1 | 14.2 | −2.5 |
|
Source: Euromonitor International Limited, 2023, all rights reserved *CAGR: Compound Annual Growth Rate N/C: Not calculable |
|||||||
| Brand | 2017 | 2018 | 2019 | 2020 | 2021 | 2022 | CAGR* % 2017-2022 |
|---|---|---|---|---|---|---|---|
| Total | 100 | 100 | 100 | 100 | 100 | 100 | 3.4 |
| Calvé (Unilever Group) | 10.4 | 10.2 | 10.5 | 10.6 | 10.7 | 10.5 | 3.8 |
| Nutella (Ferrero & related parties) | 9.7 | 9.5 | 9.5 | 9.6 | 9.7 | 10.4 | 4.9 |
| Langnese (Fürsten-Reform Dr Med Hans Plümer Nachf) | 6.5 | 6.5 | 6.6 | 6.7 | 6.7 | 7.5 | 6.3 |
| Betuwe (Hero Group GmbH) | 7.5 | 7.3 | 7.2 | 7.2 | 7.4 | 7.1 | 2.2 |
| Penotti (Peeters Produkten BV) | 6.2 | 5.9 | 5.8 | 5.8 | 5.8 | 5.4 | 0.6 |
| Bonne Maman (Andros SAS) | 4.0 | 4.0 | 3.9 | 4.0 | 4.0 | 4.2 | 4.7 |
| Mister Kitchen's (Mister Kitchen) | 1.6 | 2.6 | 2.6 | 2.6 | 3.2 | N/C | |
| Melvita (Melvita BV) | 1.5 | 1.4 | 1.5 | 1.5 | 1.6 | 1.6 | 4.0 |
| Fair Trade Original (Fair Trade Original BV) | 0.9 | 1.0 | 1.0 | 1.0 | 1.0 | 1.1 | 6.8 |
| Chivers (Boyne Valley Foods Ltd) | 0.7 | 0.6 | 0.6 | 0.6 | 0.6 | 0.7 | 4.3 |
| Private label | 34.4 | 33.8 | 33.9 | 33.9 | 34.3 | 33.6 | 3.0 |
| Others | 18.2 | 18.2 | 16.9 | 16.5 | 15.6 | 14.7 | −2.5 |
|
Source: Euromonitor International Limited, 2023, all rights reserved *CAGR: Compound Annual Growth Rate N/C: Not calculable |
|||||||
The leading company in the Netherlands for nut and seed-based spreads is Unilever's Calvé, which accounted for 35.2% of the market in 2022. Its market share is stable, with CAGR at 3.8% from 2017 to 2022, slightly higher than overall nut and seed-based spread retail growth of 3.7% over the same period. The only other brand with a large market share is Mister Kitchen's, which accounted for 10.6% of the market in 2022. Private labels represented 39.3% of the Netherlands market in 2022.
| Company | 2017 | 2018 | 2019 | 2020 | 2021 | 2022 | CAGR* % 2017-2022 |
|---|---|---|---|---|---|---|---|
| Total | 100 | 100 | 100 | 100 | 100 | 100 | 3.7 |
| Unilever Group | 35.1 | 33.8 | 34.1 | 34.0 | 34.6 | 35.2 | 3.8 |
| Mister Kitchen BV | 5.3 | 8.3 | 8.2 | 8.3 | 10.6 | N/C | |
| Swartberg BV | 2.2 | 2.1 | 2.0 | 2.0 | 1.9 | 1.8 | −0.2 |
| Hormel Foods Corp | 1.4 | 1.4 | 1.3 | 1.2 | 1.2 | 1.4 | 4.2 |
| Fair Trade Original BV | 1.0 | 1.0 | 1.0 | 1.0 | 1.0 | 1.0 | 4.0 |
| Krekeltje BV | 1.2 | 1.2 | 1.1 | 1.1 | 1.0 | 0.9 | −1.4 |
| Pip & Nut Ltd | 0.1 | 0.4 | 0.5 | 0.5 | 0.6 | 0.6 | 45.9 |
| Van Oordt The Portion Co BV | 0.5 | 0.5 | 0.5 | 0.4 | 0.4 | 0.3 | −6.6 |
| Private Label | 40.2 | 39.1 | 39.9 | 40.2 | 41.4 | 39.3 | 3.2 |
| Others | 18.2 | 15.2 | 11.3 | 11.3 | 9.6 | 8.8 | −10.3 |
|
Source: Euromonitor International Limited, 2023, all rights reserved *CAGR: Compound Annual Growth Rate N/C: Not calculable |
|||||||
| Brand | 2017 | 2018 | 2019 | 2020 | 2021 | 2022 | CAGR* % 2017-2022 |
|---|---|---|---|---|---|---|---|
| Total | 100 | 100 | 100 | 100 | 100 | 100 | 3.7 |
| Calvé (Unilever Group) | 35.1 | 33.8 | 34.1 | 34.0 | 34.6 | 35.2 | 3.8 |
| Mister Kitchen's (Mister Kitchen) | 5.3 | 8.3 | 8.2 | 8.3 | 10.6 | N/C | |
| PCD (Swartberg BV) | 2.2 | 2.1 | 2.0 | 2.0 | 1.9 | 1.8 | −0.2 |
| Skippy (Hormel Foods Corp) | 1.4 | 1.4 | 1.3 | 1.2 | 1.2 | 1.4 | 4.2 |
| Fair Trade Original (Fair Trade Original BV) | 1.0 | 1.0 | 1.0 | 1.0 | 1.0 | 1.0 | 4.0 |
| Krekeltje (Krekeltje BV) | 1.2 | 1.2 | 1.1 | 1.1 | 1.0 | 0.9 | −1.4 |
| Pip & Nut (Pip & Nut Ltd) | 0.1 | 0.4 | 0.5 | 0.5 | 0.6 | 0.6 | 45.9 |
| Van Oordt (Van Oordt The Portion Co BV) | 0.5 | 0.5 | 0.5 | 0.4 | 0.4 | 0.3 | −6.6 |
| Private label | 40.2 | 39.1 | 39.9 | 40.2 | 41.4 | 39.3 | 3.2 |
| Others | 18.2 | 15.2 | 11.3 | 11.3 | 9.6 | 8.8 | −10.3 |
|
Source: Euromonitor International Limited, 2023, all rights reserved *CAGR: Compound Annual Growth Rate N/C: Not calculable |
|||||||
Germany competitive landscape
The German sweet spreads retail market is top-heavy. Ferrero's Nutella accounted for nearly a quarter of the market in 2022 (24.9%). Top honey brands such as Breitsamer & Ulrich, Langnese and Bihophar have similar market shares. Private labels are somewhat popular, at 29.2% of the market in 2022, but their popularity has declined since 2017, when they represented 31.1% of the market.
| Company | 2017 | 2018 | 2019 | 2020 | 2021 | 2022 | CAGR* % 2017-2022 |
|---|---|---|---|---|---|---|---|
| Total | 100 | 100 | 100 | 100 | 100 | 100 | 7.2 |
| Ferrero & related parties | 20.1 | 29.0 | 28.5 | 27.7 | 26.0 | 24.9 | 11.9 |
| Hero Group GmbH | 11.7 | 10.5 | 10.6 | 10.4 | 10.4 | 10.2 | 4.2 |
| Fürsten-Reform Dr Med Hans Plümer Nachf GmbH & Co | 8.3 | 7.4 | 7.4 | 7.1 | 6.7 | 7.1 | 4.0 |
| Zentis GmbH & Co kilograms | 7.4 | 6.5 | 6.4 | 6.4 | 6.5 | 6.3 | 3.9 |
| Breitsamer & Ulrich GmbH & Co | 6.2 | 5.6 | 5.4 | 5.5 | 5.5 | 5.9 | 5.9 |
| Mövenpick Holding AG | 2.6 | 2.4 | 2.3 | 2.3 | 2.2 | 2.2 | 3.4 |
| Mondelez International Inc | 0.9 | 1.3 | 1.2 | N/C | |||
| Privatmarmeladerie Friedrich Göbber GmbH | 0.7 | 1.0 | 1.1 | 1.1 | 1.2 | 1.1 | 18.7 |
| Andros SAS | 0.7 | 0.7 | 0.7 | 0.7 | 0.7 | 0.7 | 6.5 |
| Adolf Darbo AG | 0.6 | 0.5 | 0.5 | 0.6 | 0.6 | 0.6 | 8.7 |
| Private label | 31.1 | 27.4 | 27.1 | 27.9 | 28.4 | 29.2 | 5.8 |
| Others | 10.6 | 9.0 | 10.0 | 9.4 | 10.5 | 10.6 | 7.6 |
|
Source: Euromonitor International Limited, 2023, all rights reserved *CAGR: Compound Annual Growth Rate N/C: Not calculable |
|||||||
| Brand | 2017 | 2018 | 2019 | 2020 | 2021 | 2022 | CAGR* % 2017-2022 |
|---|---|---|---|---|---|---|---|
| Total | 100 | 100 | 100 | 100 | 100 | 100 | 7.2 |
| Nutella (Ferrero & related parties) | 20.1 | 29.0 | 28.5 | 27.7 | 26.0 | 24.9 | 11.9 |
| Schwartau (Hero Group GmbH) | 8.8 | 7.9 | 7.9 | 7.6 | 7.6 | 7.4 | 3.6 |
| Zentis (Zentis GmbH & Co kilograms) | 7.4 | 6.5 | 6.4 | 6.4 | 6.5 | 6.3 | 3.9 |
| Breitsamer & Ulrich (Breitsamer & Ulrich GmbH & Co kilograms) | 6.2 | 5.6 | 5.4 | 5.5 | 5.5 | 5.9 | 5.9 |
| Langnese (Fürsten-Reform Dr Med Hans Plümer Nachf GmbH) | 4.9 | 4.3 | 4.4 | 4.2 | 4.0 | 4.2 | 4.1 |
| Bihophar (Fürsten-Reform Dr Med Hans Plümer Nachf GmbH & Co) | 2.8 | 2.5 | 2.4 | 2.3 | 2.2 | 2.4 | 3.7 |
| Mövenpick (Mövenpick Holding) | 2.6 | 2.4 | 2.3 | 2.3 | 2.2 | 2.2 | 3.4 |
| Milka (Mondelez International Inc) | 0.9 | 1.3 | 1.2 | N/C | |||
| Glück (Privatmarmeladerie Friedrich Göbber GmbH) | 0.7 | 1.0 | 1.1 | 1.1 | 1.2 | 1.1 | 18.7 |
| Bonne Maman (Andros SAS) | 0.7 | 0.7 | 0.7 | 0.7 | 0.7 | 0.7 | 6.5 |
| Private label | 31.1 | 27.4 | 27.1 | 27.9 | 28.4 | 29.2 | 5.8 |
| Others | 14.7 | 12.7 | 13.8 | 13.4 | 14.4 | 14.5 | 7.2 |
|
Source: Euromonitor International Limited, 2023, all rights reserved *CAGR: Compound Annual Growth Rate N/C: Not calculable |
|||||||
The nut and seed-based spreads market in Germany is highly concentrated. The top brand, Barney's Best (manufactured by Dockhorn & Co), had a 44.0% market share in 2022. The top three brands accounted for 67.8% of the market in 2022. Private labels represented just over a quarter of the market (27.0%).
| Company | 2017 | 2018 | 2019 | 2020 | 2021 | 2022 | CAGR* % 2017-2022 |
|---|---|---|---|---|---|---|---|
| Total | 100 | 100 | 100 | 100 | 100 | 100 | 4.5 |
| Dockhorn & Co GmbH | 49.1 | 49.1 | 48.5 | 45.0 | 44.1 | 44.0 | 2.2 |
| Intersnack Group GmbH | 16.3 | 16.4 | 18.3 | 16.0 | 14.8 | 14.8 | 2.4 |
| Zentis GmbH & Co kilograms | 6.1 | 9.0 | 9.0 | N/C | |||
| Private Label | 26.3 | 26.2 | 26.3 | 26.0 | 26.8 | 27.0 | 5.0 |
| Others | 8.3 | 8.3 | 6.9 | 7.0 | 5.4 | 5.3 | −4.6 |
|
Source: Euromonitor International Limited, 2023, all rights reserved *CAGR: Compound Annual Growth Rate N/C: Not calculable |
|||||||
| Brand | 2017 | 2018 | 2019 | 2020 | 2021 | 2022 | CAGR* % 2017-2022 |
|---|---|---|---|---|---|---|---|
| Total | 100 | 100 | 100 | 100 | 100 | 100 | 4.5 |
| Barney's Best (Dockhorn & Co) | 49.1 | 49.1 | 48.5 | 45.0 | 44.1 | 44.0 | 2.2 |
| Ültje (Intersnack Group GmbH) | 16.3 | 16.4 | 18.3 | 16.0 | 14.8 | 14.8 | 2.4 |
| Zentis (Zentis GmbH & Co kilograms) | 6.1 | 9.0 | 9.0 | N/C | |||
| Private label | 26.3 | 26.2 | 26.3 | 26.0 | 26.8 | 27.0 | 5.0 |
| Others | 8.3 | 8.3 | 6.9 | 7.0 | 5.4 | 5.3 | −4.6 |
|
Source: Euromonitor International Limited, 2023, all rights reserved *CAGR: Compound Annual Growth Rate N/C: Not calculable |
|||||||
Italy competitive landscape
Outside of Nutella, which has a dominant market share for chocolate spreads, Italy's sweet spreads market is fairly competitive. No other company had more than 9.7% market share in 2022, and no brand other than Nutella had more than 6.2% market share. Private labels accounted for just over a quarter of all sales in 2022 (25.4%).
| Company | 2017 | 2018 | 2019 | 2020 | 2021 | 2022 | CAGR* % 2017-2022 |
|---|---|---|---|---|---|---|---|
| Total | 100 | 100 | 100 | 100 | 100 | 100 | 3.7 |
| Ferrero & related parties | 29.9 | 29.3 | 28.1 | 28.0 | 27.2 | 25.6 | 0.5 |
| Rigoni di Asiago Srl | 10.1 | 10.0 | 10.3 | 10.2 | 10.2 | 9.7 | 2.9 |
| Zuegg SpA | 5.5 | 5.5 | 5.4 | 5.5 | 5.5 | 5.6 | 4.3 |
| Barilla Holding SpA | 3.0 | 3.1 | 3.2 | 4.9 | N/C | ||
| Valsoia SpA | 3.9 | 3.8 | 3.8 | 3.8 | 3.8 | 3.7 | 2.7 |
| Hero Group GmbH | 2.1 | 2.2 | 2.1 | 2.1 | 2.1 | 2.3 | 5.9 |
| Elah Dufour Soc Alimentari Riunite Srl | 2.3 | 2.3 | 2.2 | 2.2 | 2.2 | 2.2 | 2.7 |
| Apicoltura Casentinese Srl | 1.7 | 1.8 | 1.7 | 1.7 | 1.7 | 1.8 | 4.6 |
| Alce Nero, Gruppo | 1.4 | 1.5 | 1.5 | 1.6 | 1.6 | 1.7 | 8.0 |
| Empresas Carozzi SA | 2.2 | 2.2 | 2.1 | 2.1 | 2.0 | 1.7 | −2.3 |
| Private Label | 26.0 | 26.1 | 25.4 | 25.5 | 25.1 | 25.4 | 3.2 |
| Others | 14.9 | 15.3 | 14.4 | 14.2 | 15.4 | 15.4 | 5.5 |
|
Source: Euromonitor International Limited, 2023, all rights reserved *CAGR: Compound Annual Growth Rate N/C: Not calculable |
|||||||
| Brand | 2017 | 2018 | 2019 | 2020 | 2021 | 2022 | CAGR* % 2017-2022 |
|---|---|---|---|---|---|---|---|
| Total | 100 | 100 | 100 | 100 | 100 | 100 | 3.7 |
| Nutella (Ferrero & related parties) | 29.9 | 29.3 | 28.1 | 28.0 | 27.2 | 25.6 | 0.5 |
| Fiordifrutta (Rigoni di Asiago Srl) | 6.2 | 6.4 | 6.3 | 6.3 | 6.3 | 6.2 | 3.6 |
| Zuegg (Zuegg SpA) | 5.4 | 5.4 | 5.3 | 5.3 | 5.4 | 5.5 | 4.3 |
| Pan di Stelle (Barilla Holding SpA) | 3.0 | 3.1 | 3.2 | 4.9 | N/C | ||
| Santa Rosa (Valsoia SpA) | 3.9 | 3.8 | 3.8 | 3.8 | 3.8 | 3.7 | 2.7 |
| Nocciolata (Rigoni di Asiago Srl) | 2.6 | 2.6 | 2.6 | 2.5 | 2.5 | 2.6 | 3.2 |
| Hero (Hero Group GmbH) | 2.1 | 2.2 | 2.1 | 2.1 | 2.1 | 2.3 | 5.9 |
| Novi Crema di Cioccolato (Elah Dufour Soc Alimentari Riunite Srl) | 2.3 | 2.3 | 2.2 | 2.2 | 2.2 | 2.2 | 2.7 |
| Alce Nero (Alce Nero, Gruppo) | 1.4 | 1.5 | 1.5 | 1.6 | 1.6 | 1.7 | 8.0 |
| Ambrosoli (Empresas Carozzi SA) | 2.2 | 2.2 | 2.1 | 2.1 | 2.0 | 1.7 | −2.3 |
| Private label | 26.0 | 26.1 | 25.4 | 25.5 | 25.1 | 25.4 | 3.2 |
| Others | 18.0 | 18.2 | 17.6 | 17.5 | 18.6 | 18.2 | 5.4 |
|
Source: Euromonitor International Limited, 2023, all rights reserved *CAGR: Compound Annual Growth Rate N/C: Not calculable |
|||||||
The nut and seed-based spreads market in Italy is hard to analyze. In Euromonitor, brand data is only tracked for two companies, both of which have 0.3% market share. It is likely that the nut and seed-based spreads market is therefore highly segmented.
| Company | 2017 | 2018 | 2019 | 2020 | 2021 | 2022 | CAGR* % 2017-2022 |
|---|---|---|---|---|---|---|---|
| Total | 100 | 100 | 100 | 100 | 100 | 100 | 3.4 |
| De Angelis Srl | 0.3 | 0.3 | 0.3 | 0.3 | 0.3 | 0.3 | 9.0 |
| Ecor NaturaSì SpA | 0.7 | 0.8 | 0.8 | 0.8 | 0.3 | 0.3 | −12.1 |
| Others | 99.0 | 98.9 | 98.9 | 98.9 | 99.3 | 99.3 | 3.5 |
|
Source: Euromonitor International Limited, 2023, all rights reserved *CAGR: Compound Annual Growth Rate |
|||||||
| Brand | 2017 | 2018 | 2019 | 2020 | 2021 | 2022 | CAGR* % 2017-2022 |
|---|---|---|---|---|---|---|---|
| Total | 100 | 100 | 100 | 100 | 100 | 100 | 3.4 |
| Deanocciola Creme di Semi Oleosi (De Angelis Srl) | 0.3 | 0.3 | 0.3 | 0.3 | 0.3 | 0.3 | 9.0 |
| Baule Volante (Ecor NaturaSì) | 0.7 | 0.8 | 0.8 | 0.8 | 0.3 | 0.3 | −12.1 |
| Others | 99.0 | 98.9 | 98.9 | 98.9 | 99.3 | 99.3 | 3.5 |
|
Source: Euromonitor International Limited, 2023, all rights reserved *CAGR: Compound Annual Growth Rate |
|||||||
New product launches
According to data from the Mintel Global New Products Database, 8,826 new sweet spread products were launched in our five focal markets between 2018 and 2022. France featured the most new products, with 3,730 launches, followed by Germany, with 2,002. Jams (confitures) and fruit spreads featured the most product launches, with 3,149 launches, followed by honey, with 2,337 launches. There were 1,310 nut spread product launches in our five focal countries between 2018 and 2022.
Between 2018 and 2022, 3,246 organic sweet spreads were launched in our five focal countries, representing 36.8% of total new launches. Environmentally friendly or recyclable packages were very popular, with 2,106 and 2,008 new launches, respectively. There is likely quite a bit of overlap between these two claims, however. 1,388 newly launched products from 2018 to 2022 were labeled as vegan.
Most newly-launched products featured low or moderate prices. 6,670 of the newly launched products (75.8%) were cheaper than US$8.33. A majority of the launches represented new products, either from an entirely new product or from a new variety or range extension. This represented 6,170 launches, or 69.9% of the total.
New launches were highly divided between the different companies. The two leading companies were Lidl and Aldi, both of which primarily market private-label products, but their combined new launches represented 349 new launches.
| Product attributes | Yearly launch count | ||||
|---|---|---|---|---|---|
| 2018 | 2019 | 2020 | 2021 | 2022 | |
| Yearly product launches | 1,568 | 1,491 | 1,823 | 2,001 | 1,943 |
| Launches by country | |||||
| France | 663 | 529 | 698 | 934 | 906 |
| Germany | 358 | 382 | 425 | 405 | 432 |
| United Kingdom | 221 | 244 | 262 | 261 | 239 |
| Italy | 205 | 206 | 259 | 239 | 227 |
| Netherlands | 121 | 130 | 179 | 162 | 139 |
| Top five categories | |||||
| Confiture & Fruit Spreads | 614 | 548 | 573 | 715 | 699 |
| Honey | 394 | 366 | 536 | 530 | 511 |
| Chocolate Spreads | 253 | 240 | 288 | 306 | 291 |
| Nut Spreads | 180 | 228 | 296 | 304 | 302 |
| Syrups | 72 | 72 | 70 | 73 | 95 |
| Top five claims | |||||
| Organic | 472 | 527 | 674 | 749 | 824 |
| Environmentally Friendly Package | 268 | 323 | 409 | 562 | 544 |
| Ethical - Recycling | 257 | 308 | 379 | 550 | 514 |
| Vegan/No Animal Ingredients | 202 | 282 | 280 | 310 | 314 |
| Low/No/Reduced Allergen | 227 | 263 | 279 | 246 | 203 |
| Launches by price group (US dollars) | |||||
| 0.34 - 4.33 | 660 | 698 | 678 | 674 | 816 |
| 4.34 - 8.33 | 537 | 493 | 678 | 754 | 682 |
| 8.34 - 12.33 | 212 | 163 | 282 | 351 | 284 |
| 12.34 - 16.33 | 84 | 77 | 103 | 117 | 107 |
| 16.34 - 24.00 | 50 | 28 | 47 | 70 | 34 |
| Launches by launch type | |||||
| New Variety/Range Extension | 621 | 592 | 611 | 674 | 793 |
| New Product | 547 | 481 | 698 | 675 | 478 |
| New Packaging | 327 | 346 | 400 | 471 | 541 |
| Relaunch | 64 | 65 | 108 | 173 | 122 |
| New Formulation | 9 | 7 | 6 | 8 | 9 |
| Top five flavours (including blend) | |||||
| Unflavoured/Plain | 430 | 386 | 545 | 523 | 516 |
| Hazelnut | 115 | 101 | 157 | 169 | 150 |
| Strawberry | 81 | 70 | 77 | 106 | 108 |
| Peanut Butter | 68 | 65 | 93 | 108 | 96 |
| Apricot | 35 | 36 | 41 | 68 | 67 |
| Top five companies | |||||
| Lidl | 56 | 53 | 21 | 54 | 53 |
| Aldi | 27 | 19 | 21 | 27 | 18 |
| Ferrero | 27 | 16 | 16 | 19 | 20 |
| Schwartauer Werke | 17 | 17 | 18 | 24 | 20 |
| Rigoni di Asiago | 8 | 12 | 19 | 19 | 19 |
| Source: Mintel Global New Products Database, 2023, all rights reserved | |||||
| Category | Country | ||||
|---|---|---|---|---|---|
| France | Germany | United Kingdom | Italy | Netherlands | |
| Confiture and Fruit Spreads | 1,356 | 814 | 375 | 446 | 158 |
| Honey | 1,187 | 452 | 311 | 241 | 146 |
| Chocolate Spreads | 514 | 298 | 138 | 240 | 188 |
| Nut Spreads | 408 | 295 | 274 | 165 | 168 |
| Syrups | 101 | 103 | 98 | 28 | 52 |
| Caramel and Cream Spreads | 164 | 40 | 31 | 16 | 19 |
| Total sample | 3,730 | 2,002 | 1,227 | 1,136 | 731 |
| Source: Mintel Global New Products Database, 2023, all rights reserved | |||||
France accounted for a good portion of new launches for jam and fruits spreads and for honey. It was the leading market for nut spreads, with 408 new launches, but proportionally, the most new launches were in the Netherlands and the United Kingdom, where nut spreads represented 23.0% and 22.3% of new launches, respectively.
Examples of new product launches
Hazelnut and Chocolate Spread
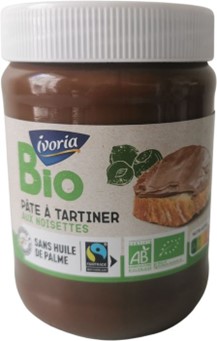
Source: Mintel Global New Product Database, 2023, all rights reserved.
| Company | Intermarché |
|---|---|
| Manufacturer | Natra Malle |
| Brand | Selection Ivoria Bio |
| Sub-category | Chocolate spreads |
| Market | France |
| Store name | Intermarché |
| Store type | Supermarket |
| Date published | September 2023 |
| Launch type | New packaging |
| Price in US dollars | 5.15 |
Selection Ivoria Bio Pâte à Tartiner aux Noisettes (Hazelnut and Chocolate Spread) has been repackaged, and retails in a newly designed 600 gram pack. - Organic hazelnut spread- Free from palm oil- Scores an E on the Nutri-Score- Logos and certifications: Fairtrade, AB - Agriculture Biologique (Organic Agriculture) label, EU Organic, Producteurs & Commerçants - Intermarché
Chocolate Peanut Butter Powder
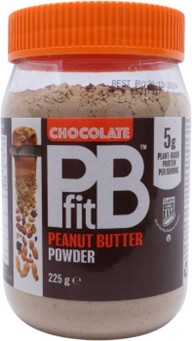
Source: Mintel Global New Product Database, 2023, all rights reserved.
| Company | BetterBody Foods |
|---|---|
| Manufacturer | CERTlabel |
| Brand | PBfit |
| Sub-category | Chocolate spreads |
| Market | United Kingdom |
| Store name | Ocado |
| Store type | Internet / mail order |
| Date published | September 2023 |
| Launch type | New packaging |
| Price in US dollars | 7.43 |
PBfit Chocolate Peanut Butter Powder has been repackaged, and retail in a 225 gram pack. - 5 grams plant-based protein per serving - Made with American peanuts- Logos and certifications: Kosher
White Almond Cream with 100% Sweet Almonds
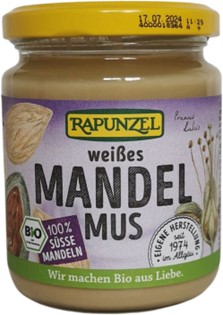
Source: Mintel Global New Product Database, 2023, all rights reserved.
| Manufacturer | Rapunzel Naturkost |
|---|---|
| Brand | Rapunzel |
| Sub-category | Nut spreads |
| Market | Germany |
| Import status | Not imported |
| Store name | Vorwerk Podemus |
| Store type | Natural / health food store |
| Date published | September 2023 |
| Launch type | New packaging |
| Price in US dollars | 10.69 |
Rapunzel Weisses Mandel Mus 100% Süsse Mandeln (White Almond Cream with 100% Sweet Almonds) has been repackaged, and retails in a 250 gram pack. - Contains Prunus dulcis - From own production in Allgäu - Made with California almonds. Rich in magnesium, calcium and vitamin E- Free from additives- Vegan - Logos and certifications: EU Organic, Bio-Siegel (Bio Seal)
Hazelnut, Cocoa and Soy Spreadable Cream
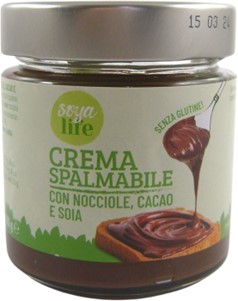
Source: Mintel Global New Product Database, 2023, all rights reserved.
| Manufacturer | Atlante |
|---|---|
| Brand | Soya Life |
| Sub-category | Chocolate spreads |
| Market | Italy |
| Store name | Todis |
| Store type | Supermarket |
| Date published | July 2023 |
| Launch type | New packaging |
| Price in US dollars | 2.17 |
Soya Life Crema Spalmabile con Nocciole, Cacao e Soia (Hazelnut, Cocoa and Soy Spreadable Cream) has been repackaged and retails in a 180 gram pack. - Gluten-free
100% Crunchy Peanut Butter
Source: Mintel Global New Product Database, 2023, all rights reserved.
| Company | Marks & Spencer |
|---|---|
| Brand | M&S Food |
| Sub-category | Nut spreads |
| Market | United Kingdom |
| Location of manufacture | Netherlands |
| Import status | Imported product |
| Store name | Marks & Spencer |
| Store type | Department store |
| Date published | June 2023 |
| Launch type | New packaging |
| Price in US dollars | 6.29 |
M&S Food 100% Crunchy Peanut Butter has been repackaged, and now retails in a newly updated bigger 1 kilogram pack providing better value - High in fibre and monounsaturated fats - Source of protein - Made with hi-oleic peanuts - No palm oil - Suitable for vegans - Recyclable pack (pot and lid) - Made using peanuts from Argentina - Logos and certifications: Eat Well (Marks & Spencer)
100% Pure Nut Mix with Peanuts, Cashews and Almonds

Source: Mintel Global New Product Database, 2023, all rights reserved.
| Company | Jumbo Supermarkten |
|---|---|
| Brand | Jumbo |
| Sub-category | Nut spreads |
| Market | Netherlands |
| Store name | Jumbo |
| Store type | Supermarket |
| Date published | May 2023 |
| Launch type | New variety / range extension |
| Price in US dollars | 4.10 |
Jumbo Noten Mix 100% Puur Pinda, Cashew, Amandel (100% Pure Nut Mix with Peanuts, Cashews and Almonds) is now available, and retails in a 350 gram pack.
For more information
The Canadian Trade Commissioner Service:
International Trade Commissioners can provide Canadian industry with on-the-ground expertise regarding market potential, current conditions and local business contacts, and are an excellent point of contact for export advice.
More agri-food market intelligence:
International agri-food market intelligence
Discover global agriculture and food opportunities, the complete library of Global Analysis reports, market trends and forecasts, and information on Canada's free trade agreements.
Agri-food market intelligence service
Canadian agri-food and seafood businesses can take advantage of a customized service of reports and analysis, and join our email subscription service to have the latest reports delivered directly to their inbox.
More on Canada's agriculture and agri-food sectors:
Canada's agriculture sectors
Information on the agriculture industry by sector. Data on international markets. Initiatives to support awareness of the industry in Canada. How the department engages with the industry.
For additional information on Anuga in Cologne, Germany, please contact:
Ben Berry, Deputy Director
Trade Show Strategy and Delivery
Agriculture and agri-food Canada
ben.berry@agr.gc.ca
Resources
- Euromonitor International, 2023
- Global Trade Tracker, 2023
- Mintel Global New Products Database, 2023
Customized Report Service – Sweet spreads in the European Union and United Kingdom
Global Analysis Report
Prepared by: Alexandre Holm Perrault, Market Analyst
© His Majesty the King in Right of Canada, represented by the Minister of Agriculture and Agri-Food (2024).
Photo credits
All photographs reproduced in this publication are used by permission of the rights holders.
All images, unless otherwise noted, are copyright His Majesty the King in Right of Canada.
To join our distribution list or to suggest additional report topics or markets, please contact:
Agriculture and Agri-Food Canada, Global Analysis1341 Baseline Rd, Tower 5, 3rd floor
Ottawa ON K1A 0C5
Canada
Email: aafc.mas-sam.aac@agr.gc.ca
The Government of Canada has prepared this report based on primary and secondary sources of information. Although every effort has been made to ensure that the information is accurate, Agriculture and Agri-Food Canada (AAFC) assumes no liability for any actions taken based on the information contained herein.
Reproduction or redistribution of this document, in whole or in part, must include acknowledgement of agriculture and agri-food Canada as the owner of the copyright in the document, through a reference citing AAFC, the title of the document and the year. Where the reproduction or redistribution includes data from this document, it must also include an acknowledgement of the specific data source(s), as noted in this document.
Agriculture and Agri-Food Canada provides this document and other report services to agriculture and food industry clients free of charge.