

Note: This report includes forecasting data that is based on baseline historical data.
Executive summary
South Korea average consumer expenditure was relatively low at US$186.2 compared with Canada at US$639.1 in 2022.
As of 2022, the South Korean beer market was the 10th largest in the world, with beer sales of US$11.0 billion. The South Korean beer market was valued at US$11.0 billion in 2022. In 2022, the off-trade beer market accounted for US$5.4 billion in sales (49.0% of the beer market), while the on-trade market accounted for just US$5.6 billion (51.0% of the beer market).
Canada was not a major player in the South Korean beer market, with just US$427,496 in exports in 2018. Even so, Canada has seen its beer exports to South Korea fall by 36.4% from 2018 to 2022, totalling just US$69,748 in 2022.
South Korea was the world's ninth largest spirits market in 2022, with US$112.6 billion in sales. The South Korean market grew at a compound annual growth rate (CAGR) of 3.3% from 2018 to 2022.
In 2022, the South Korean spirit market was largely dominated by the on-trade. Total on-trade sales were US$10.1 billion (80.6% of the spirit market), while off-trade sales were US$2.5 billion (19.4%).
South Korean imports of foreign spirits totalled US$354.2 million in 2022, and grew at a CAGR of 13.3% from 2018 to 2022.
In 2022, the South Korean wine market was valued at US$3.5 billion, up from US$2.6 billion in 2018. wine has seen strong growth from 2018 to 2022,
In 2022, South Korean wine imports surged to US$581.3 million, having grown at a CAGR of 24.2% from 2018 to 2022.
Alcoholic beverage megatrends
South Korea average annual consumer expenditure was relatively low at US$186.2 compared with Canada at US$639.1 in 2022. But it is expected to increase to US$235.1 in 2027 at a CAGR of 4.3% from 2023 to 2027.
| Country | 2018 | 2022 | CAGR* % 2018-2022 | 2023 | 2027 | CAGR* % 2023-2027 |
|---|---|---|---|---|---|---|
| South Korea | 146.0 | 186.2 | 6.3 | 198.4 | 235.1 | 4.3 |
| Canada | 554.4 | 639.1 | 3.6 | 653.4 | 738.1 | 3.1 |
|
Source: Euromonitor International, 2023 *CAGR: Compound Annual Growth Rate |
||||||
South Korean beer market
As of 2022, the South Korean beer market was the 10th largest in the world, with beer sales of US$11.0 billion. From 2018 to 2022, beer sales in South Korea contracted at a CAGR of −0.2%. From 2023 to 2027, beer sales in South Korea are expected to see big growth at a CAGR of 9.0%, with sales expected to reach US$18.9 billion by 2027. This growth rate is expected to be above the global average of 8.9%. The South Korean beer market has also seen a significant shift away from on-trade locations in favor of the off-trade due to the pandemic. Concurrently, there is also a significant shift away from imported beers in favour of beer that is domestically produced.
Another notable trend for 2022 was the rise of craft beer. While large manufacturers focused on "popular" taste profiles, craft beer producers attracted consumers' attention with innovative offers by using a variety of raw materials, such as hemp seed (Euromonitor 2023).
| Countries | 2018 | 2022 | CAGR* % 2018-2022 | 2023 | 2027 | CAGR* % 2023-2027 |
|---|---|---|---|---|---|---|
| World | 596,576.0 | 711,574.1 | 4.5 | 806,151.3 | 1,131,850.1 | 8.9 |
| China | 90,607.1 | 103,117.3 | 3.3 | 118,326.2 | 163,009.2 | 8.3 |
| United States | 104,270.4 | 114,154.6 | 2.3 | 123,421.7 | 140,281.3 | 3.3 |
| Brazil | 29,266.0 | 56,171.4 | 17.7 | 65,824.3 | 108,207.2 | 13.2 |
| Mexico | 23,403.2 | 32,408.0 | 8.5 | 36,348.5 | 49,333.6 | 7.9 |
| United Kingdom | 26,683.0 | 30,350.8 | 3.3 | 33,320.9 | 38,789.6 | 3.9 |
| Germany | 31,657.6 | 31,792.9 | 0.1 | 34,164.2 | 36,998.1 | 2.0 |
| Russia | 14,742.4 | 19,568.2 | 7.3 | 21,363.3 | 27,344.5 | 6.4 |
| Japan | 29,887.8 | 24,316.9 | −5.0 | 26,337.7 | 25,756.1 | −0.6 |
| Spain | 15,540.1 | 16,685.5 | 1.8 | 18,372.8 | 22,578.9 | 5.3 |
| South Korea (10th) | 11,095.7 | 11,028.5 | −0.2 | 13,343.3 | 18,864.8 | 9.0 |
| Canada (11th) | 13,709.2 | 13,282.8 | −0.8 | 13,925.3 | 15,528.5 | 2.8 |
|
Source: Euromonitor International, 2023 *CAGR: Compound annual growth rate |
||||||
The South Korean beer market was valued at US$11.0 billion in 2022. The South Korean beer market was dominated by lager, which saw sales of US$9.8 billion in 2022 (88.5% of the beer market). Mid priced lager was the largest subcategory, with US$7.8 billion in sales in 2022 (80.0% of the lager market, and 70.8% of the beer market). Dark beer saw a rapid CAGR of 15.2% from 2018-2022, and growth from 2023-2027 is expected to slow to a CAGR of 6.2%.
In 2022, non-alcoholic beer saw a significant spike in popularity, with sales growing by 41.6%, and expected to grow at a CAGR of 2.3% from 2023-2027. The market for non-alcohol beer, however, remains a small portion of the beer market, valued at US$43.0 million in 2022. It is expected to reach US$51.4 million by 2027. Increased demand for non-alcoholic beer has been driven in part by increasing health concerns and additionally the increasing ability of non-alcohol beer to replicate the taste of its alcoholic counterparts. Moreover, South Korean regulations limit the ability of consumers to purchase alcohol online, making non-alcohol beer a potential solution for consumers who do not want to visit supermarkets.
Mid-priced lager is expected to grow at a CAGR of 10.1% in 2027. In 2027, mid priced lager is expected to make up 70.8% of the South Korean beer market in 2027. Imported premium lager grew at a CAGR of −14.1% from 2018 to 2022 and is expected to see growth of 6.0% from 2023 to 2027, while domestic premium lager grew at a CAGR of 4.1% and is expected to grow at a CAGR of 7.6%, as the South Korean alcohol market shifts in favor of domestic suppliers.
| Category | 2018 | 2022 | CAGR* % 2018-2022 | 2023 | 2027 | CAGR* % 2023-2027 |
|---|---|---|---|---|---|---|
| Beer | 11,095.7 | 11,028.5 | −0.2 | 13,343.3 | 18,864.8 | 9.0 |
| Dark beer | 582.4 | 1,027.4 | 15.2 | 1,150.7 | 1,464.7 | 6.2 |
| Lager | 10,315.0 | 9,759.2 | −1.4 | 11,915.6 | 17,038.9 | 9.4 |
| Premium lager | 2,997.6 | 1,716.2 | −13.0 | 1,915.9 | 2,429.6 | 6.1 |
| Domestic premium lager | 128.9 | 151.2 | 4.1 | 175.6 | 235.3 | 7.6 |
| Imported premium lager | 2,868.7 | 1,565.0 | −14.1 | 1,740.2 | 2,194.3 | 6.0 |
| Mid-priced lager | 7,147.2 | 7,812.2 | 2.2 | 9,754.9 | 14,347.3 | 10.1 |
| Economy lager | 170.3 | 230.9 | 7.9 | 244.8 | 262.1 | 1.7 |
| Non-alcoholic beer | 10.7 | 43.0 | 41.6 | 47.0 | 51.4 | 2.3 |
| Stout | 187.5 | 198.9 | 1.5 | 230.0 | 309.8 | 7.7 |
|
Source: Euromonitor International, 2023 *CAGR: Compound annual growth rate |
||||||
Off-trade and on-trade reviewFootnote 1
In 2022, the off-trade beer market accounted for US$5.4 billion in sales (49.0% of the beer market), while the on-trade market accounted for just US$5.6 billion (51.0% of the beer market). This is a dramatic shift from 2018, when on-trade beer sales accounted for 60.4% of the beer market. From 2018-2022, on-trade sales dropped by a CAGR of −4.1%, while off-trade sales grew by a CAGR of 5.0%, driven by a rising trend in South Korea of drinking at home, rather than social drinking.
From 2023-2027, on-trade sales of beer are expected to grow at a CAGR of 12.7%, while off-trade sales grow at a CAGR of 3.3%. In 2027, on-trade sales are expected to recover to US$12.4 billion, above their 2022 levels of US$5.6 billion.
| Category | Off-trade / on trade | 2018 | 2022 | CAGR* % 2018-2022 | 2023 | 2027 | CAGR* % 2023-2027 |
|---|---|---|---|---|---|---|---|
| Beer | Off-trade | 4,436.4 | 5,402.6 | 5.0 | 5,673.8 | 6,471.4 | 3.3 |
| On-trade | 6,659.2 | 5,625.9 | −4.1 | 7,669.5 | 12,393.4 | 12.7 | |
| Dark beer | Off-trade | 212.5 | 612.7 | 30.3 | 649.6 | 761.8 | 4.1 |
| On-trade | 369.9 | 414.7 | 2.9 | 501.1 | 702.9 | 8.8 | |
| Lager | Off-trade | 4,125.0 | 4,645.0 | 3.0 | 4,869.8 | 5,535.4 | 3.3 |
| On-trade | 6,190.1 | 5,114.3 | −4.7 | 7,045.8 | 11,503.5 | 13.0 | |
| Premium lager | Off-trade | 1,336.4 | 918.1 | −9.0 | 962.8 | 1,088.5 | 3.1 |
| On-trade | 1,661.2 | 798.1 | −16.7 | 953.0 | 1,341.1 | 8.9 | |
| Domestic premium lager | Off-trade | 44.3 | 60.6 | 8.1 | 63.6 | 71.5 | 3.0 |
| On-trade | 84.6 | 90.6 | 1.7 | 112.0 | 163.8 | 10.0 | |
| Imported premium lager | Off-trade | 1,292.1 | 857.5 | −9.7 | 899.2 | 1,017.0 | 3.1 |
| On-trade | 1,576.6 | 707.5 | −18.2 | 841.0 | 1,177.3 | 8.8 | |
| Mid-priced lager | Off-trade | 2,618.3 | 3,496.0 | 7.5 | 3,662.2 | 4,184.8 | 3.4 |
| On-trade | 4,528.9 | 4,316.2 | −1.2 | 6,092.7 | 10,162.5 | 13.6 | |
| Economy lager | Off-trade | 170.3 | 230.9 | 7.9 | 244.8 | 262.1 | 1.7 |
| On-trade | N/A | N/A | |||||
| Non-alcoholic beer | Off-trade | 10.7 | 43.0 | 41.6 | 47.0 | 51.4 | 2.3 |
| On-trade | N/A | N/A | |||||
| Stout | Off-trade | 88.2 | 101.9 | 3.7 | 107.4 | 122.8 | 3.4 |
| On-trade | 99.3 | 97.0 | −0.6 | 122.6 | 187.0 | 11.1 | |
|
Source: Euromonitor International, 2023 *CAGR: Compound annual Growth Rate N/A: Not available |
|||||||
Top three companies were Anheuser-Busch InBev NV (39.7% market share), Hite Jinro Co Ltd (23.7% market share) and Lotte Group (3.2% market share).
| Company | 2018 | 2019 | 2020 | 2021 | 2022 |
|---|---|---|---|---|---|
| Anheuser-Busch InBev NV | 52.0 | 50.9 | 48.0 | 39.7 | 39.7 |
| Hite Jinro Co Ltd | 12.9 | 18.8 | 24.5 | 22.7 | 23.7 |
| Lotte Group | 5.2 | 4.7 | 3.8 | 3.2 | 3.2 |
| Heineken NV | 2.2 | 2.4 | 3.3 | 3.5 | 2.8 |
| Jeju Beer Co | 0.6 | 0.8 | 2.7 | 2.9 | 2.4 |
| Tsingtao Brewery Co Ltd | 3.2 | 3.6 | 2.6 | 2.8 | 2.4 |
| Carlsberg A/S | 2.3 | 2.9 | 2.5 | 2.5 | 2.3 |
| Asahi Group Holdings Ltd | 4.9 | 3.6 | 1.2 | 1.1 | 1.3 |
| Diageo Plc | 0.9 | 0.9 | 0.8 | 0.8 | 0.8 |
| Kirin Holdings Co Ltd | 1.2 | 0.7 | 0.3 | 0.2 | 0.4 |
| Sapporo Holdings Ltd | 1.0 | 0.6 | 0.2 | 0.2 | 0.3 |
| Molson Coors Brewing Co | 0.3 | 0.3 | 0.3 | 0.3 | 0.3 |
| Suntory Holdings Ltd | 0.2 | 0.1 | 0.1 | 0.1 | 0.1 |
| Others | 13.3 | 9.6 | 9.6 | 17.8 | 18.3 |
| Source: Euromonitor International, 2023 | |||||
From 2018-2022, the South Korean off-trade beer market has shifted dramatically in favor of convenience stores. Convenience stores have risen from selling 37.9% of beer by volume in 2018 to 44.8% in 2022, adding 6.9%. Meanwhile, hypermarkets have seen their market share fall by 6.9%, falling from 25.2% in 2018 to 18.3% in 2022. Warehouse clubs emerged on the scene, market share from 5.7% in 2018 to 6.7% in 2022.
Additionally, e-commerce has now started to make small inroads into the South Korean off-trade beer market. Until the beginning of the pandemic, South Korean law prohibited the online sale of alcohol, meaning that e-commerce could only take place with online sales of non-alcohol beer. However, laws were updated due to the pandemic, and alcohol can be sold online as part of meal delivery, provided alcoholic items make up less than half the price of the meal. Nevertheless, the South Korean beer e-commerce market remains an extremely small portion of overall sales.
| Outlet type | 2018 | 2019 | 2020 | 2021 | 2022 |
|---|---|---|---|---|---|
| Grocery Retailers | 98.5 | 98.7 | 98.9 | 98.8 | 98.7 |
| Convenience Retail | 37.9 | 42.5 | 44.1 | 44.9 | 44.9 |
| Convenience Stores | 37.9 | 42.4 | 44.1 | 44.8 | 44.8 |
| Forecourt Retailers | 0.1 | 0.1 | 0.1 | 0.1 | 0.1 |
| Supermarkets | 10.6 | 11.4 | 10.9 | 10.6 | 10.6 |
| Hypermarkets | 25.2 | 20.1 | 19.0 | 18.3 | 18.3 |
| Warehouse Clubs | 5.7 | 6.1 | 6.5 | 6.7 | 6.7 |
| Food/drink/tobacco specialists | 0.1 | 0.1 | 0.1 | 0.1 | 0.1 |
| Small Local Grocers | 19.0 | 18.5 | 18.4 | 18.2 | 18.2 |
| Non-Grocery Retailers | 1.5 | 1.3 | 1.0 | 0.9 | 0.9 |
| General Merchandise Stores | 1.5 | 1.3 | 1.0 | 0.9 | 0.9 |
| E-Commerce | 0.0 | 0.1 | 0.1 | 0.3 | 0.4 |
| Source: Euromonitor International, 2023 | |||||
Foreign beer in South Korea
Decline of imported beer
South Korean imports of beer have fallen significantly over the last several years, a negative growth of CAGR of −10.9% from 2018 to 2022. Domestic breweries have picked up the slack, seeing significant gains over the historic period. Meanwhile, South Korean imports of Canadian beer have also fallen dramatically.
From 2018 to 2022, South Korean imports of beer contracted at a CAGR of −10.9%. The retail value of beer imports fell from US$309.7 million in 2018 to US$195.1 million in 2022. The fall in beer imports has coincided with a shift in the South Korean market in favor of domestic beers, which have seen fast growth during these years.
Canada was not a major player in the South Korean beer market, with just US$427,496 in exports in 2018. Even so, Canada has seen its beer exports to South Korea fall by 36.4% from 2018-2022, totalling just US$69,748 in 2022. In 2022 the market was led by the Netherlands, with US$33.5 million in sales, followed by China with US$36.4 million in sales, and Belgium with US$8.5 million in sales. European beers continue to be popular among South Korean consumers, who generally perceive European beer positively.
Generation Z consumers stated that they drink very little, while only 1.6% of this demographic said that they consumed alcoholic drinks daily. This was a significantly lower rate compared to older generations, with more than 10% of baby boomers stating that they were daily drinkers (Euromonitor 2023).
| Country | 2018 | 2019 | 2020 | 2021 | 2022 | CAGR* % 2018-2022 | Share % 2022 |
|---|---|---|---|---|---|---|---|
| World | 309,686,357 | 280,890,429 | 226,859,232 | 223,100,195 | 195,101,094 | −10.9 | 100.0 |
| China | 40,911,952 | 43,455,420 | 32,340,984 | 36,748,849 | 36,441,971 | −2.9 | 18.7 |
| Netherlands | 21,407,859 | 30,386,994 | 40,704,098 | 43,431,808 | 33,539,139 | 11.9 | 17.2 |
| Germany | 24,589,911 | 18,130,983 | 17,745,171 | 15,600,535 | 16,216,628 | −9.9 | 8.3 |
| Poland | 10,157,046 | 19,486,402 | 18,563,211 | 20,105,634 | 15,987,809 | 12.0 | 8.2 |
| Ireland | 18,453,632 | 17,181,176 | 16,664,660 | 16,428,068 | 15,131,166 | −4.8 | 7.8 |
| Japan | 78,299,924 | 39,756,041 | 5,668,090 | 6,875,301 | 14,483,764 | −34.4 | 7.4 |
| United States | 34,572,966 | 33,941,983 | 34,890,162 | 18,453,432 | 12,842,799 | −21.9 | 6.6 |
| Czech Republic | 10,522,210 | 8,718,572 | 4,935,706 | 7,935,598 | 9,323,508 | −3.0 | 4.8 |
| Belgium | 36,177,416 | 38,619,598 | 26,710,192 | 27,621,670 | 8,481,550 | −30.4 | 4.3 |
| Denmark | 3,791,000 | 6,405,087 | 7,262,959 | 6,179,183 | 4,924,632 | 6.8 | 2.5 |
| Canada 29th | 427,496 | 379,194 | 272,613 | 66,681 | 69,748 | −36.4 | 0.04 |
|
Source: Global Trade Tracker, 2023 *CAGR: Compound annual growth rate |
|||||||
Top fermented beverage exporters to South Korea are Japan at the value of US$22.3 million, Denmark at the value of US$11.7 million and United States at the value of 3.6 million in 2022.
| Country | 2018 | 2019 | 2020 | 2021 | 2022 | CAGR* % 2018-2022 | Share % 2022 |
|---|---|---|---|---|---|---|---|
| World | 34,004,267 | 29,159,848 | 33,191,481 | 49,065,234 | 51,260,476 | 10.8 | 100.0 |
| Japan | 20,168,396 | 14,696,016 | 10,742,191 | 15,960,447 | 22,340,162 | 2.6 | 43.6 |
| Denmark | 3,498,601 | 5,705,597 | 10,379,284 | 14,795,169 | 11,660,056 | 35.1 | 22.7 |
| United States | 2,663,074 | 1,746,300 | 1,580,121 | 1,841,551 | 3,566,686 | 7.6 | 7.0 |
| Spain | 1,307,848 | 116,675 | 1,232,995 | 2,870,858 | 2,384,103 | 16.2 | 4.7 |
| Austria | 1,171,908 | 1,090,704 | 2,264,907 | 2,885,673 | 2,180,711 | 16.8 | 4.3 |
| Australia | 2,461,261 | 1,911,580 | 1,107,375 | 1,375,450 | 1,998,270 | −5.1 | 3.9 |
| Netherlands | 34,673 | 4,127 | 599,960 | 1,957,558 | 1,638,815 | 162.2 | 3.2 |
| Germany | 989,297 | 937,455 | 1,339,609 | 2,470,075 | 1,236,288 | 5.7 | 2.4 |
| Belgium | 506,872 | 489,387 | 719,207 | 661,613 | 1,086,493 | 21.0 | 2.1 |
| Singapore | 123 | 1,337,186 | 1,479,191 | 1,719,489 | 679,712 | 1.3% (2019-2022) | 1.3 |
| Canada 32 | 10,059 | 5,748 | 379 | 111 | 125 | −66.6 | 0.00 |
|
Source: Global Trade Tracker, 2023 *CAGR: Compound annual growth rate |
|||||||
Product launch analysis for beer
Over the last few years, new packaging of beer in South Korea has become relatively more common. Many South Korean players in the market have made an effort to offer smaller package sizes in an attempt to win over younger consumers, while the launch of low or non-alcohol beer products is becoming more common.
From 2018 to 2022, there are 103 new products, 80 new packaging, 74 new variety / range extension, 4 relaunch. The total is 261.
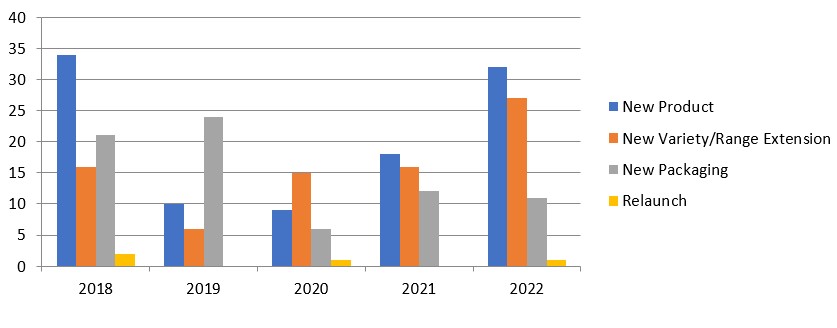
Description of above image
| Launch type | 2018 | 2019 | 2020 | 2021 | 2022 | Total |
|---|---|---|---|---|---|---|
| New product | 34 | 10 | 9 | 18 | 32 | 103 |
| New packaging | 16 | 6 | 15 | 16 | 27 | 80 |
| New variety / range extension | 21 | 24 | 6 | 12 | 11 | 74 |
| Relaunch | 2 | 0 | 1 | 0 | 1 | 4 |
| New formulation | 0 | 0 | 0 | 0 | 0 | 0 |
| Total | 73 | 40 | 31 | 46 | 71 | 261 |
Source: Mintel, 2023
From 2018 to 2022, there are 155 products that have 500.00 millilitres, 40 products that have 355.00 millilitres, 30 products that have 330.00 millilitres. 11 products that have 473.00 millilitres and 5 products that have 568.00 millilitres.
| Unit pack size (millilitres / grams) | 2018 | 2019 | 2020 | 2021 | 2022 | Total sample |
|---|---|---|---|---|---|---|
| 500.00 millilitres | 32 | 16 | 23 | 38 | 46 | 155 |
| 355.00 millilitres | 17 | 13 | 4 | 4 | 2 | 40 |
| 330.00 millilitres | 14 | 4 | 1 | 0 | 11 | 30 |
| 473.00 millilitres | 2 | 5 | 1 | 1 | 2 | 11 |
| 568.00 millilitres | 0 | 0 | 0 | 0 | 5 | 5 |
| 360.00 millilitres | 4 | 0 | 0 | 0 | 0 | 4 |
| 250.00 millilitres | 0 | 1 | 0 | 0 | 1 | 2 |
| 270.00 millilitres | 0 | 0 | 0 | 0 | 2 | 2 |
| 150.00 millilitres | 0 | 0 | 0 | 0 | 1 | 1 |
| 1286.00 millilitres | 0 | 0 | 0 | 1 | 0 | 1 |
| Total Sample | 73 | 40 | 31 | 46 | 71 | 261 |
| Source: Mintel, 2023 | ||||||
Between 2018 and 2022, there are 156 products pricing at US$1.12 to US$4.11, 54 products pricing at US$4.12 to US$7.11 and 30 products pricing at US$7.12 to US$10.11.
| Price in US dollars (Group) | 2018 | 2019 | 2020 | 2021 | 2022 | Total sample |
|---|---|---|---|---|---|---|
| 1.12 - 4.11 | 34 | 22 | 21 | 36 | 43 | 156 |
| 4.12 - 7.11 | 30 | 6 | 3 | 2 | 13 | 54 |
| 7.12 - 10.11 | 6 | 7 | 4 | 2 | 11 | 30 |
| 10.12 - 13.11 | 0 | 3 | 2 | 3 | 4 | 12 |
| 13.12 - 17.00 | 3 | 2 | 0 | 3 | 0 | 8 |
| Total Sample | 73 | 40 | 31 | 46 | 71 | 261 |
|
Source: Mintel, 2023 |
||||||
There are 116 products at 500 millilitres that price at US$1.12 to US$4.11, 16 products at 500 millilitres that price US$4.12 to US$7.11, 8 products 355 millilitres that price US$1.12 to US$4.11 and 19 products at 355 millilitres that price at US$4.12 to US$7.11.
| Price in US dollars (Group) | 500 millilitres | 355 millilitres | 330 millilitres | 473 millilitres | 568 millilitres | 360 millilitres | 250 millilitres | 270 millilitres | 150 millilitres | 1,286 millilitres | Total Sample |
|---|---|---|---|---|---|---|---|---|---|---|---|
| 1.12 - 4.11 | 116 | 8 | 13 | 7 | 5 | 0 | 1 | 2 | 0 | 0 | 156 |
| 4.12 - 7.11 | 16 | 19 | 13 | 0 | 0 | 4 | 0 | 0 | 0 | 0 | 54 |
| 7.12 - 10.11 | 10 | 11 | 3 | 2 | 0 | 0 | 1 | 0 | 1 | 1 | 30 |
| 10.12 - 13.11 | 9 | 0 | 0 | 1 | 0 | 0 | 0 | 0 | 0 | 0 | 12 |
| 13.12 - 17.00 | 4 | 2 | 1 | 1 | 0 | 0 | 0 | 0 | 0 | 0 | 8 |
| Total Sample | 155 | 40 | 30 | 11 | 5 | 4 | 2 | 2 | 1 | 1 | 261 |
| Source: Mintel, 2023 | |||||||||||
From 2018 to 2022, there were 43 premium, 20 seasonal, 16 limited edition, 15 Cobranded and 15 Ethical - Environmentally Friendly Package.
| Claim | 2018 | 2019 | 2020 | 2021 | 2022 | Total sample |
|---|---|---|---|---|---|---|
| Premium | 15 | 9 | 9 | 4 | 6 | 43 |
| Seasonal | 7 | 8 | 2 | 1 | 2 | 20 |
| Limited Edition | 5 | 4 | 3 | 1 | 3 | 16 |
| Cobranded | 2 | 0 | 2 | 6 | 5 | 15 |
| Ethical - Environmentally Friendly Package | 8 | 1 | 0 | 1 | 5 | 15 |
| Ethical - Recycling | 8 | 1 | 0 | 1 | 5 | 15 |
| Social Media | 6 | 1 | 1 | 4 | 0 | 12 |
| Diet/Light | 0 | 1 | 0 | 3 | 1 | 5 |
| Event Merchandising | 3 | 0 | 0 | 0 | 1 | 4 |
| Ethical - Environmentally Friendly Product | 0 | 1 | 0 | 1 | 1 | 3 |
| Total Sample | 73 | 40 | 31 | 46 | 71 | 261 |
|
Source: Mintel 2023 |
||||||
Example of products
Lager Beer
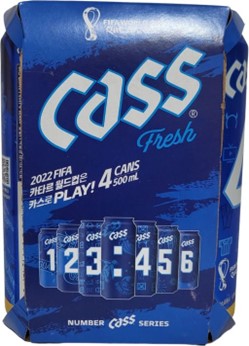
| Company | Oriental Brewery |
|---|---|
| Manufacturer | Oriental Brewery |
| Brand | Cass Fresh |
| Category | Alcoholic beverages |
| Sub-category | Beer |
| Market | South Korea |
| Store name | GS25 |
| Store type | Convenience Store |
| Date published | December 2022 |
| Product source | Shopper |
| Launch type | New packaging |
| Price in local currency | KRW11,000.00 |
| Price in US dollars | 8.21 |
| Price in Euros | 7.96 |
Cass Fresh Lager Beer has been repackaged for the 2022 World Cup, and retails in a pack containing four 500 millilitre cans. - Official 2022 FIFA World Cup sponsor - Logos and certifications: QR code
Mojito Beer
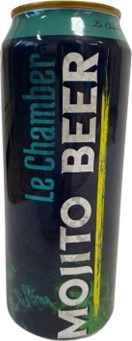
| Company | Dongduchoen Brewery |
|---|---|
| Manufacturer | Dongduchoen Brewery |
| Brand | The Hyundai Le Chamber × Dongduchoen Brewery Co. |
| Category | Alcoholic beverages |
| Sub-category | Beer |
| Market | South Korea |
| Store name | Hyundai Department Store |
| Store type | Department store |
| Date published | November 2022 |
| Launch type | New product |
| Price in local currency | KRW6,300.00 |
| Price in US dollars | 4.49 |
| Price in Euros | 4.50 |
The Hyundai Le Chamber × Dongduchoen Brewery Co. Mojito Beer is now available, and retails in a 500 millilitre pack. - Cocktail-style beer, produced as a collaboration between Le Chamber cocktail bar and Dongducheon Brewery Co. - Le Chamber is the only South Korean cocktail bar, selected as 2017 World Best Bar
AAA+ Beer
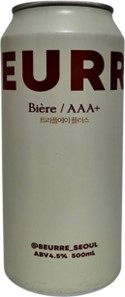
| Company | Brewguru |
|---|---|
| Manufacturer | Brewguru |
| Brand | Beurre |
| Category | Alcoholic beverages |
| Sub-category | Beer |
| Market | South Korea |
| Store name | GS25 |
| Store type | Convenience store |
| Date published | October 2022 |
| Launch type | New product |
| Price in local currency | KRW6,500.00 |
| Price in US dollars | 4.55 |
| Price in Euros | 4.61 |
Beurre AAA+ Beer is now available, and retails in a 500 millilitre pack.
South Korean spirits market
South Korea was the world's ninth largest spirits market in 2022, with US$112.6 billion in sales. The South Korean market grew at a CAGR of 3.3% from 2018 to 2022, and it is expected to grow at a CAGR of 4.3% from 2023 to 2027. South Korean sales of spirits are expected to reach US$15.7 billion by 2027.
| Country | 2018 | 2022 | CAGR* % 2018-2022 | 2023 | 2027 | CAGR* % 2023-2027 |
|---|---|---|---|---|---|---|
| World | 503,471.4 | 608,256.3 | 4.8 | 668,572.3 | 867,337.0 | 6.7 |
| China | 160,234.8 | 184,302.9 | 3.6 | 197,405.6 | 237,241.2 | 4.7 |
| United States | 80,903.8 | 119,095.4 | 10.1 | 127,751.9 | 152,223.1 | 4.5 |
| India | 30,004.2 | 33,230.1 | 2.6 | 36,161.2 | 51,954.2 | 9.5 |
| United Kingdom | 17,123.4 | 20,152.5 | 4.2 | 22,177.3 | 25,546.1 | 3.6 |
| Russia | 13,246.5 | 17,460.0 | 7.1 | 19,039.5 | 23,226.3 | 5.1 |
| Japan | 22,679.7 | 20,846.9 | −2.1 | 22,364.1 | 23,038.0 | 0.7 |
| Germany | 17,265.2 | 16,474.9 | −1.2 | 17,698.9 | 19,491.2 | 2.4 |
| France | 17,647.4 | 16,609.7 | −1.5 | 17,809.2 | 19,192.1 | 1.9 |
| South Korea (9th) | 11,071.6 | 12,605.1 | 3.3 | 13,292.6 | 15,726.6 | 4.3 |
| Spain | 9,030.4 | 9,551.5 | 1.4 | 10,622.9 | 13,362.1 | 5.9 |
| Canada (11th) | 7,989.8 | 9,161.1 | 3.5 | 9,855.2 | 12,447.2 | 6.0 |
|
Source: Euromonitor International, 2023 *CAGR: Compound annual growth rate |
||||||
Blended scotch was the largest category of foreign whiskey, with US$1,407.6 million in sales in 2022, up from its 2018 value of US$1,319.3 million. Blended scotch whiskey is expected to increase from 2023-2027, growing at a CAGR of 5.5% over the period and reaching US$1,900.2 million in sales in 2027. Bourbon recorded the biggest growth at a CAGR of 24.9% from 2018 to 2022 followed by single malt scotch whiskey at a CAGR of 20.3%. Other whiskies grew at a CAGR of 7.2% from 2018-2022. It is worth noting that gin recorded a growth of 19.5% from 2018 to 2022 and brandy registered a growth of 18.9% from 2018 to 2022.
The South Korean spirit market is shifting in favor of products with a lower alcohol content, as health concerns become increasingly prevalent. A new trend is the mixing of tonic or soda water with shochu/soju, reducing both shochu's alcohol content and its bitterness. Meanwhile, locally produced spirits are trending towards lower alcohol contents, as producers try to appeal to female consumers.Footnote 2
| Category | 2018 | 2022 | CAGR* % 2018-2022 | Share % 2022 | 2023 | 2027 | CAGR* % 2023-2027 | Share % 2027 |
|---|---|---|---|---|---|---|---|---|
| Spirits | 11,071.6 | 12,605.1 | 3.3 | 100.0 | 13,292.6 | 15,726.6 | 4.3 | 100.0 |
| Brandy and Cognac | 34.3 | 47.7 | 8.6 | 0.4 | 55.1 | 72.4 | 7.1 | 0.5 |
| Brandy | 1.2 | 2.4 | 18.9 | 0.0 | 2.9 | 4.7 | 12.8 | 0.0 |
| Cognac | 33.1 | 45.3 | 8.2 | 0.4 | 52.3 | 67.7 | 6.7 | 0.4 |
| Liqueurs | 102.8 | 109.6 | 1.6 | 0.9 | 129.6 | 187.7 | 9.7 | 1.2 |
| Bitters | 51.6 | 53.6 | 1.0 | 0.4 | 63.2 | 93.5 | 10.3 | 0.6 |
| Other Liqueurs | 51.2 | 56.0 | 2.3 | 0.4 | 66.4 | 94.2 | 9.1 | 0.6 |
| Rum | 59.9 | 83.5 | 8.7 | 0.7 | 99.1 | 146.2 | 10.2 | 0.9 |
| Dark Rum | 45.1 | 63.7 | 9.0 | 0.5 | 75.4 | 112.0 | 10.4 | 0.7 |
| White Rum | 14.8 | 19.8 | 7.5 | 0.2 | 23.7 | 34.1 | 9.5 | 0.2 |
| Tequila (and Mezcal) | 190.6 | 220.3 | 3.7 | 1.7 | 264.0 | 380.2 | 9.5 | 2.4 |
| Whiskies | 2,923.6 | 3,828.1 | 7.0 | 30.4 | 4,296.3 | 5,414.2 | 6.0 | 34.4 |
| Bourbon/Other US Whiskey | 92.9 | 226.2 | 24.9 | 1.8 | 269.9 | 397.1 | 10.1 | 2.5 |
| Blended Scotch Whisky | 1,319.3 | 1,407.6 | 1.6 | 11.2 | 1,533.1 | 1,900.2 | 5.5 | 12.1 |
| Other Blended Scotch Whisky | 1,319.3 | 1,407.6 | 1.6 | 11.2 | 1,533.1 | 1,900.2 | 5.5 | 12.1 |
| Single Malt Scotch Whisky | 255.5 | 535.2 | 20.3 | 4.2 | 644.4 | 994.9 | 11.5 | 6.3 |
| Other Whiskies | 1,255.9 | 1,659.1 | 7.2 | 13.2 | 1,848.9 | 2,122.0 | 3.5 | 13.5 |
| White Spirits | 244.4 | 242.2 | −0.2 | 1.9 | 291.2 | 422.4 | 9.7 | 2.7 |
| Gin | 44.3 | 90.2 | 19.5 | 0.7 | 109.5 | 160.8 | 10.1 | 1.0 |
| Vodka | 200.1 | 151.9 | −6.7 | 1.2 | 181.7 | 261.6 | 9.5 | 1.7 |
| Other Spirits | 7,516.1 | 8,073.8 | 1.8 | 64.1 | 8,157.3 | 9,103.4 | 2.8 | 57.9 |
|
Source: Euromonitor International, 2023 *CAGR: Compound annual growth |
||||||||
Off-trade and on-trade review
In 2022, the South Korean spirit market was largely dominated by the on-trade. Total on-trade sales were US$10.1 billion (80.6% of the spirit market), while off-trade sales were US$2.5 billion (19.4%). The South Korean alcohol market saw a shift from the on-trade to the off-trade during the pandemic, however the benefits to the spirit off-trade have been relatively limited. In 2022, on-trade sales of spirits increased by US$1.0 billion from 2018, while off-trade sales grew by US$1.5 billion from 2018. Social drinking continues to be key to South Koreans' taste for harder drinks. Demand for spirits from the on-trade and off-trade has both increased. From 2023 to 2027, the on-trade is expected to see faster sales growth. On-trade sales of spirits in 2027 are expected to be US$12.8 billion, above their 2022 levels of US$10.1 billion. Off-trade sales are expected to reach US$2.9 billion by 2027.
Overall, both the on-trade and off-trade of whiskey are expected to see relatively fast growth from 2023 to 2027, with on-trade sales of whiskey growing at a CAGR of 5.8%, and the off-trade growing at 7.2%. On trade sales of whiskey grew at 6.7% from 2018 to 2022 while off-trade grew at 9.7% from 2018 to 2022.
The sale of white spirits through the on-trade is expected to grow at a CAGR of 10.1% from 2023-2027, while on trade sales of tequila are expected to grow at a CAGR of 9.7%. However, the off-trade market for tequila represented a growth from US$1.3 million to US$5.6 million at a CAGR of 44.1% from 2018 to 2022.
| Category | Off-trade / on trade | 2018 | 2022 | CAGR* % 2018-2022 | 2023 | 2027 | CAGR* % 2023-2027 |
|---|---|---|---|---|---|---|---|
| Spirits | Off-trade | 1,973.4 | 2,467.0 | 5.7 | 2,607.2 | 2,934.2 | 3.0 |
| On-trade | 9,098.2 | 10,138.1 | 2.7 | 10,685.4 | 12,792.5 | 4.6 | |
| Other spirits | Off-trade | 1,690.0 | 2,056.8 | 5.0 | 2,149.1 | 2,336.0 | 2.1 |
| On-trade | 5,826.1 | 6,017.0 | 0.8 | 6,008.3 | 6,767.4 | 3.0 | |
| Whiskies | Off-trade | 254.4 | 369.0 | 9.7 | 415.1 | 548.2 | 7.2 |
| On-trade | 2,669.2 | 3,459.0 | 6.7 | 3,881.2 | 4,866.0 | 5.8 | |
| White spirits | Off-trade | 18.2 | 17.3 | −1.3 | 17.8 | 20.2 | 3.2 |
| On-trade | 226.2 | 224.9 | −0.1 | 273.3 | 402.2 | 10.1 | |
| Tequila | Off-trade | 1.3 | 5.6 | 44.1 | 5.9 | 6.9 | 4.0 |
| On-trade | 189.2 | 214.7 | 3.2 | 258.1 | 373.3 | 9.7 | |
| Liqueurs | Off-trade | 4.4 | 5.7 | 6.7 | 6.0 | 7.4 | 5.4 |
| On-trade | 98.4 | 103.9 | 1.4 | 123.5 | 180.3 | 9.9 | |
| Rum | Off-trade | 1.0 | 2.0 | 18.9 | 2.0 | 2.3 | 3.6 |
| On-trade | 58.9 | 81.5 | 8.5 | 97.0 | 143.9 | 10.4 | |
| Brandy and cognac | Off-trade | 4.1 | 10.7 | 27.1 | 11.3 | 13.1 | 3.8 |
| On-trade | 30.1 | 37.0 | 5.3 | 43.9 | 59.4 | 7.9 | |
| Source: Euromonitor International, 2023
*CAGR: Compound annual Growth Rate |
|||||||
Hypermarket occupied over half of the grocery retailing, representing 53.0%. Small grocery retailer recorded 33.2% of the total grocery retailing. E-commerce only represented a limited portion of the total off-trade retail: 0.5% in 2022 from 0.2% in 2020.
| Outlet type | 2018 | 2019 | 2020 | 2021 | 2022 |
|---|---|---|---|---|---|
| Grocery retailers | 99.1 | 99.1 | 99.1 | 98.9 | 98.7 |
| Food/drink/tobacco specialists | 0.2 | 0.2 | 0.3 | 0.3 | 0.3 |
| Hypermarkets | 55.1 | 51.8 | 52.6 | 51.0 | 53.0 |
| Small grocery retailers | 28.6 | 32.7 | 33.5 | 35.3 | 33.2 |
| Convenience stores | 17.6 | 20.3 | 20.9 | 22.6 | 22.7 |
| Forecourt retailers | 0.0 | 0.0 | 0.0 | 0.0 | 0.0 |
| Independent small grocers | 11.0 | 12.4 | 12.6 | 12.7 | 10.5 |
| Supermarkets | 15.2 | 14.4 | 12.7 | 12.3 | 12.1 |
| Non-Grocery Retailers | 0.9 | 0.9 | 0.9 | 0.9 | 0.8 |
| Retail E-Commerce | 0.2 | 0.5 | 0.5 | ||
| Source: Euromonitor International, 2023 | |||||
Companies
In 2022, Hite Jinro saw the market share of its brand Jinro in Spirits expand from 48.8% in 2018 to 63.1% in 2022. LVMH Moët Hennessy Louis Vuitton SA saw the market share of its brand Hennessy in Brandy and Cognac expand from 60.8% in 2018 to 68.7% in 2022.
| Category | Brand | Company name | 2018 | 2019 | 2020 | 2021 | 2022 |
|---|---|---|---|---|---|---|---|
| Spirits | Jinro | Hite Jinro Co Ltd | 48.8 | 57.3 | 62.4 | 63.4 | 63.1 |
| Choumchorum | Lotte Group | 16.4 | 15.8 | 12.7 | 11.4 | 10.8 | |
| Joeunday | Muhak Co Ltd | 12.0 | 8.0 | 6.4 | 5.8 | 5.4 | |
| Daesun Soju | Daesun Distilling Co Ltd | 3.6 | 4.3 | 4.3 | 4.3 | 4.3 | |
| Whiskies | Golden Blue | Golden Blue Co Ltd | 24.3 | 29.5 | 32.4 | 31.3 | 29.8 |
| Windsor | Diageo Plc | 23.4 | 23.6 | 16.6 | 15.4 | 15.1 | |
| Imperial | Pernod Ricard Groupe | 6.9 | 4.3 | 5.6 | 7.9 | 6.6 | |
| Johnnie Walker | Diageo Plc | 3.0 | 3.4 | 5.8 | 7.3 | 5.0 | |
| Tequila (and Mezcal) | José Cuervo | Becle SAB de CV | 48.7 | 52.0 | 40.1 | 47.9 | 30.0 |
| Sauza | Suntory Holdings Ltd | 1.9 | 1.9 | 1.5 | 2.3 | 1.6 | |
| Pepe Lopez | Brown-Forman Corp | 2.4 | 2.5 | 1.9 | 2.3 | 1.4 | |
| Sauza Tequila | Suntory Holdings Ltd | 2.5 | 2.5 | 1.9 | 2.1 | 1.3 | |
| Liqueurs | Jägermeister | Mast-Jägermeister SE | 25.8 | 28.4 | 31.8 | 31.1 | 32.5 |
| Agwa | Babco Europe Ltd | 16.2 | 15.4 | 14.5 | 15.0 | 16.0 | |
| Kahlúa | Pernod Ricard Groupe | 17.4 | 16.5 | 15.3 | 15.5 | 14.8 | |
| Bols | Lucas Bols BV | 14.0 | 15.1 | 14.1 | 12.9 | 11.7 | |
| Rum | Bacardi | Bacardi & Co Ltd | 46.1 | 43.7 | 43.7 | 45.9 | 47.3 |
| Malibu | Pernod Ricard Groupe | 6.8 | 6.4 | 5.7 | 7.0 | 7.5 | |
| Captain Morgan | Diageo Plc | 4.2 | 3.4 | 4.8 | 3.0 | 3.2 | |
| Barton | Sazerac Co Inc | 0.8 | 0.8 | 0.7 | 0.8 | 0.9 | |
| White spirits | Absolut | Pernod Ricard Groupe | 41.2 | 41.6 | 40.6 | 41.9 | 38.0 |
| Bombay Sapphire | Bacardi & Co Ltd | 6.6 | 7.7 | 11.5 | 11.3 | 16.2 | |
| Smirnoff | Diageo Plc | 11.5 | 11.0 | 10.9 | 11.3 | 10.3 | |
| Gilbey's | Diageo Plc | 8.1 | 9.0 | 12.9 | 10.6 | 8.6 | |
| Brandy and Cognac | Hennessy | LVMH Moët Hennessy Louis Vuitton SA | 60.8 | 59.9 | 73.7 | 68.8 | 68.7 |
| Rémy Martin | Rémy Cointreau Group | 18.1 | 8.6 | 10.6 | 12.2 | 13.6 | |
| Camus | Camus la Grande Marque SA | 2.7 | 2.3 | 2.8 | 3.3 | 3.7 | |
| Courvoisier | Suntory Holdings Ltd | 2.3 | 2.2 | 2.7 | 3.1 | 3.5 | |
| Source: Euromonitor International, 2023 | |||||||
Foreign spirits in South Korea
South Korean imports of foreign spirits totalled US$354.2 million in 2022, and grew at a CAGR of 13.3% from 2018-2022, despite a significant drop in imports in 2020. Whiskies dominated the category, with US$266.8 million in imports in 2022 (75.3% of spirit imports).
| Category | 2018 | 2019 | 2020 | 2021 | 2022 | CAGR* % 2018-2022 |
|---|---|---|---|---|---|---|
| Spirits total (HS: 2208) | 215,287,969 | 215,506,556 | 185,891,587 | 238,800,525 | 354,196,094 | 13.3 |
| Whiskies (HS: 220830) | 154,882,944 | 153,932,963 | 132,463,048 | 175,343,935 | 266,842,069 | 14.6 |
| Ethyl alcohol of an alcoholic strength of < 80% volume (HS: 220890) | 21,343,088 | 22,856,622 | 20,887,081 | 23,662,743 | 33,085,684 | 11.6 |
| Liqueurs and cordials (HS: 220870) | 19,362,811 | 18,719,709 | 15,783,827 | 18,100,326 | 26,238,402 | 7.9 |
| Spirits obtained by distilling grape wine or grape marc (HS: 220820) | 6,186,528 | 5,999,835 | 6,259,759 | 8,752,633 | 12,344,358 | 18.9 |
| Vodka (HS: 220860) | 8,885,139 | 8,796,709 | 5,557,595 | 6,984,075 | 7,446,762 | −4.3 |
| Gin and geneva (HS: 220850) | 2,351,095 | 2,614,934 | 2,893,389 | 3,518,998 | 5,314,365 | 22.6 |
| Rum and other spirits obtained by distilling fermented sugar-cane products (HS: 220840) | 2,276,364 | 2,585,784 | 2,046,888 | 2,437,815 | 2,924,454 | 6.5 |
|
Source: Global Trade Tracker, 2023 *CAGR: Compound annual growth rate |
||||||
From 2018 to 2022, Canadian spirit exports have declined, however they have also become increasingly diversified. Until recently, Canadian exports of spirits to South Korea had been almost whiskey, liqueur and vodka. The value of Canadian whiskey exports to South Korea fell from US$2.0 million in 2018 to US$442,146 in 2022.
However, Canada has seen growth in liqueur totalled US$133,950 in 2018 to US$286,862, the only positive growth (21.0% from 2018 to 2022) among all subcategories.
| Category | 2018 | 2019 | 2020 | 2021 | 2022 | CAGR* % 2018-2022 |
|---|---|---|---|---|---|---|
| Spirits total (HS: 2208) | 2,283,444 | 1,206,704 | 883,599 | 786,616 | 796,696 | −23.1 |
| Whiskies (HS: 220830) | 2,008,850 | 912,078 | 287,047 | 352,162 | 442,146 | −31.5 |
| Liqueurs and cordials (HS: 220870) | 133,950 | 170,209 | 430,535 | 236,871 | 286,862 | 21.0 |
| Vodka (HS: 220860) | 139,676 | 124,277 | 163,561 | 116,604 | 67,297 | −16.7 |
| Rum and other spirits obtained by distilling fermented sugar-cane products (HS: 220840) | 126 | 48 | 2,210 | 80,642 | 62 | −16.3 |
|
Source: Global Trade Tracker, 2023 *CAGR: Compound annual growth rate |
||||||
South Korean wine market
In 2022, the South Korean wine market was valued at US$3.5 billion, up from US$2.6 billion in 2018. wine has seen strong growth from 2018 to 2022, growing at a CAGR of 8.0% when global wine consumption was also gradually increasing at 1.6% from 2018 to 2022. Moreover, the South Korea market is expected to grow at a very strong CAGR of 8.3% from 2023-2027, outpacing any of the world's top wine markets. South Korean wine consumption is expected to reach US$5.5 billion by 2027.
Many South Korean consumers who have taken up drinking at home have turned to wine, viewing it as indulgent and affordable. At a time when the South Korean alcohol market is shifting in favour of domestic producers, wine has been a bright spot for exporters to South Korea.
| Countries | 2018 | 2022 | CAGR* % 2018-2022 | 2023 | 2027 | CAGR* % 2023-2027 |
|---|---|---|---|---|---|---|
| World | 316,759.5 | 338,101.9 | 1.6 | 370,738.7 | 480,093.4 | 6.7 |
| United States | 44,336.9 | 56,384.8 | 6.2 | 61,591.5 | 75,785.2 | 5.3 |
| China | 67,483.3 | 51,685.3 | −6.5 | 51,540.3 | 53,451.2 | 0.9 |
| France | 27,450.9 | 25,773.3 | −1.6 | 28,119.3 | 31,280.5 | 2.7 |
| United Kingdom | 18,675.9 | 19,859.8 | 1.5 | 21,684.9 | 24,810.9 | 3.4 |
| Italy | 15,600.2 | 17,168.2 | 2.4 | 18,866.2 | 22,483.0 | 4.5 |
| Germany | 13,593.9 | 13,844.7 | 0.5 | 15,608.5 | 17,323.4 | 2.6 |
| Canada (7th) | 10,490.1 | 12,881.4 | 5.3 | 13,701.2 | 16,763.4 | 5.2 |
| Australia | 8,483.0 | 8,788.2 | 0.9 | 9,867.0 | 14,549.4 | 10.2 |
| Japan | 15,022.3 | 13,165.7 | −3.2 | 13,784.0 | 13,860.7 | 0.1 |
| Russia | 6,355.0 | 7,501.7 | 4.2 | 8,275.6 | 10,894.8 | 7.1 |
| Spain | 5,462.6 | 6,395.8 | 4.0 | 6,888.6 | 8,422.1 | 5.2 |
| South Korea (18th) | 2,572.3 | 3,498.9 | 8.0 | 4,034.1 | 5,543.0 | 8.3 |
|
Source: Euromonitor International, 2023 *CAGR: Compound annual growth rate |
||||||
In 2022, the still red wine was the largest wine category in South Korea, with US$1.5 billion in sales (42.8% of the wine market). Still red wine is popular due to perceived health benefitsFootnote 3, and is expected to see strong growth from 2023-2027, growing at a CAGR of 8.9%. Still rosé wine and sparkling wines other than champagne are expected to see fast growth as well. Growth in wine's popularity is being bolstered by increasing access to cheaper wines through the off-trade. Wine's popularity among female consumers is said by Euromonitor to be growing particularly fast, driven by the appeal of affordable wine. Overall, the outlook for the South Korean wine market is promising, with strong growth expected across a broad range of categories.
| Category | 2018 | 2022 | CAGR* % 2018-2022 | 2023 | 2027 | CAGR* % 2023-2027 |
|---|---|---|---|---|---|---|
| Wine | 2,572.3 | 3,498.9 | 8.0 | 4,034.1 | 5,543.0 | 8.3 |
| Still light grape wine[1] | 1,079.4 | 1,834.9 | 14.2 | 2,072.3 | 2,839.5 | 8.2 |
| Still Red Wine | 908.0 | 1,498.1 | 13.3 | 1,708.0 | 2,403.3 | 8.9 |
| Still Rosé Wine | 27.2 | 35.4 | 6.8 | 38.8 | 53.2 | 8.2 |
| Still White Wine | 144.1 | 301.4 | 20.3 | 325.5 | 383.0 | 4.2 |
| Non-grape wine[2] | 1,273.6 | 1,348.2 | 1.4 | 1,595.5 | 2,141.4 | 7.6 |
| Bokbunjaju | 58.7 | 68.2 | 3.8 | 80.3 | 107.4 | 7.5 |
| Cheongju | 204.5 | 229.1 | 2.9 | 267.9 | 353.2 | 7.2 |
| Sake | 317.6 | 277.5 | −3.3 | 344.6 | 491.8 | 9.3 |
| Takju | 583.2 | 639.6 | 2.3 | 747.4 | 986.3 | 7.2 |
| Yakju | 109.6 | 133.7 | 5.1 | 155.3 | 202.8 | 6.9 |
| Sparkling wine | 219.3 | 315.9 | 9.6 | 366.3 | 562.1 | 11.3 |
| Champagne | 91.3 | 105.6 | 3.7 | 118.7 | 156.2 | 7.1 |
| Other sparkling wine | 128.0 | 210.2 | 13.2 | 247.6 | 405.9 | 13.2 |
|
Source: Euromonitor International, 2023 *CAGR: Compound annual growth rate 1: Still light grape wine is the total sum of still red, white and rosé wine. Light wine is so called because of its alcohol content, which usually falls into the 8%-14% alcohol by volume bracket and thus excludes fortified wine. Semi-sparkling wines are included here (these are sparkling wines that contain no more than 2.5 atmospheres of carbon dioxide). 2: This category of wines can be made from a variety of other products, including cereals/rice, as well as from a wide variety of fruit flavours (for example, plum, apple, rhubarb). Its alcohol content is usually between 15% and 25% alcohol by volume. |
||||||
Off-trade and on-trade review
The South Korean off-trade has seen a significant shift in favour of cheaper wines from 2018-2022, with the share of wines costing under Can$15.42 increasing across all categories.
| Category | Pricing | 2018 | 2019 | 2020 | 2021 | 2022 |
|---|---|---|---|---|---|---|
| Other sparkling Wine | Under $15.42 (KRW14,999) | 42.0 | 52.0 | 55.8 | 57.2 | 59.1 |
| From $15.42 to $20.56 (KRW15,000 to 19,999) | 25.3 | 22.1 | 20.0 | 18.7 | 17.6 | |
| From $20.57 to $25.70 (KRW20,000 to 24,999) | 20.8 | 15.2 | 13.6 | 12.7 | 11.9 | |
| From $25.71 to $35.98 (KRW25,000.01 to 34,999) | 7.4 | 6.8 | 6.3 | 5.8 | 5.5 | |
| From $35.99 to $41.12 (KRW35,000 to 40,000) | 2.2 | 1.8 | 2.0 | 1.9 | 1.7 | |
| Above $82.24 (KRW80,000) | 2.2 | 2.1 | 2.4 | 3.6 | 4.2 | |
| Total | 100.0 | 100.0 | 100.0 | 100.0 | 100.0 | |
| Still red wine | Under $15.42 (KRW14,999) | 20.8 | 25.7 | 29.7 | 31.8 | 33.1 |
| From $15.42 to $20.56 (KRW15,000 to 19,999) | 24.0 | 21.2 | 19.6 | 18.8 | 18.4 | |
| From $20.56 to $30.84 (KRW20,000 to 29,999) | 24.8 | 22.6 | 20.5 | 19.5 | 19.1 | |
| From $30.85 to $41.12 (KRW30,000 to 39,999) | 17.5 | 17.3 | 16.9 | 16.7 | 16.3 | |
| From $41.13 to $61.68 (KRW40,000 to 59,999) | 12.6 | 12.8 | 12.8 | 12.8 | 12.6 | |
| From $61.69 to $82.23 (KRW60,000 to 79,999) | 0.2 | 0.2 | 0.2 | 0.2 | 0.2 | |
| Above $82.24 (KRW80,000) | 0.2 | 0.2 | 0.2 | 0.2 | 0.3 | |
| Total | 100.0 | 100.0 | 100.0 | 100.0 | 100.0 | |
| Still rosé wine | Under $15.42 (KRW14,999) | 13.1 | 13.6 | 14.2 | 14.6 | 15.2 |
| From $15.42 to $20.56 (KRW15,000 to 19,999) | 14.9 | 14.7 | 14.5 | 14.3 | 14.0 | |
| From $20.57 to $25.70 (KRW20,000 to 24,999) | 28.1 | 28.0 | 27.8 | 27.4 | 26.9 | |
| From $25.71 to $51.40 (KRW25,000 to 49,999) | 36.6 | 36.3 | 36.0 | 35.6 | 34.9 | |
| Above $51.41 (50,000) | 7.2 | 7.3 | 7.4 | 8.1 | 8.9 | |
| Total | 100.0 | 100.0 | 100.0 | 100.0 | 100.0 | |
| Still white wine | Under $15.42 (KRW14,999) | 39.7 | 44.0 | 46.9 | 49.1 | 52.2 |
| From $15.42 to $20.56 (KRW15,000 to 19,999) | 31.5 | 29.0 | 27.9 | 26.7 | 25.0 | |
| From $20.57 to $25.70 (KRW20,000 to 24,999) | 18.2 | 16.4 | 15.0 | 14.3 | 13.4 | |
| From $25.71 to $35.98 (KRW25,000.01 to 34,999) | 8.5 | 8.5 | 8.0 | 7.6 | 7.1 | |
| From $35.99 to $41.12 (KRW35,000 to 39,999) | 1.4 | 1.4 | 1.5 | 1.4 | 1.3 | |
| Above $41.13 (KRW40,000) | 0.7 | 0.7 | 0.7 | 0.8 | 0.9 | |
| Total | 100.0 | 100.0 | 100.0 | 100.0 | 100.0 | |
| Source: Euromonitor International, 2023
Exchange rate: Bank of Canada, March 29, 2022 |
||||||
Both off-trade and on-trade increase the sales from 2018 to 2022 and recorded the growth of 11.8% and 4.8% respectively and continue to grow at a CAGR of 8.2% and 8.3% from 2023 to 2027.
| Category | Off-trade / on trade | 2018 | 2022 | CAGR* % 2018-2022 | 2023 | 2027 | CAGR* % 2023-2027 |
|---|---|---|---|---|---|---|---|
| Wine | Off-trade | 1,107.6 | 1,731.2 | 11.8 | 1,936.3 | 2,651.9 | 8.2 |
| On-trade | 1,464.7 | 1,767.7 | 4.8 | 2,097.8 | 2,891.2 | 8.3 | |
| Non-grape wine | Off-trade | 417.3 | 525.3 | 5.9 | 567.1 | 664.7 | 4.0 |
| On-trade | 856.3 | 822.9 | −1.0 | 1,028.5 | 1,476.7 | 9.5 | |
| Bokbunjaju | Off-trade | 22.7 | 28.7 | 6.0 | 30.9 | 36.3 | 4.1 |
| On-trade | 35.9 | 39.5 | 2.4 | 49.4 | 71.1 | 9.5 | |
| Cheongju | Off-trade | 88.7 | 109.4 | 5.4 | 118.1 | 138.4 | 4.0 |
| On-trade | 115.9 | 119.7 | 0.8 | 149.8 | 214.8 | 9.4 | |
| Sake | Off-trade | 5.8 | 12.9 | 22.1 | 14.2 | 16.4 | 3.7 |
| On-trade | 311.8 | 264.7 | −4.0 | 330.4 | 475.3 | 9.5 | |
| Takju | Off-trade | 248.0 | 304.4 | 5.3 | 328.4 | 385.0 | 4.1 |
| On-trade | 335.1 | 335.2 | 0.0 | 419.0 | 601.2 | 9.4 | |
| Yakju | Off-trade | 52.0 | 70.0 | 7.7 | 75.5 | 88.5 | 4.1 |
| On-trade | 57.6 | 63.7 | 2.5 | 79.8 | 114.3 | 9.4 | |
| Sparkling wine | Off-trade | 51.3 | 88.1 | 14.5 | 102.1 | 161.5 | 12.1 |
| On-trade | 168.0 | 227.8 | 7.9 | 264.2 | 400.6 | 11.0 | |
| Champagne | Off-trade | 15.5 | 23.5 | 11.0 | 26.3 | 30.8 | 4.0 |
| On-trade | 75.8 | 82.2 | 2.0 | 92.4 | 125.4 | 7.9 | |
| Other sparkling wine | Off-trade | 35.8 | 64.6 | 15.9 | 75.8 | 130.8 | 14.6 |
| On-trade | 92.2 | 145.6 | 12.1 | 171.9 | 275.1 | 12.5 | |
| Still light grape wine | Off-trade | 639.0 | 1,117.8 | 15.0 | 1,267.2 | 1,825.7 | 9.6 |
| On-trade | 440.4 | 717.1 | 13.0 | 805.1 | 1,013.9 | 5.9 | |
| Still red Wine | Off-trade | 577.9 | 954.9 | 13.4 | 1,087.0 | 1,604.4 | 10.2 |
| On-trade | 330.2 | 543.2 | 13.3 | 621.0 | 798.9 | 6.5 | |
| Still rosé wine | Off-trade | 1.1 | 1.8 | 13.1 | 1.9 | 2.5 | 7.1 |
| On-trade | 26.1 | 33.6 | 6.5 | 36.9 | 50.7 | 8.3 | |
| Still white wine | Off-trade | 60.0 | 161.1 | 28.0 | 178.3 | 218.8 | 5.3 |
| On-trade | 84.1 | 140.3 | 13.6 | 147.2 | 164.2 | 2.8 | |
|
Source: Euromonitor International, 2023 *CAGR: Compound annual Growth Rate |
|||||||
The South Korean wine off-trade is dominated by hypermarkets, which enjoyed 62.4% of sales by volume in 2022, while convenience stores have been gaining prominence. Both categories of outlets have been seeking to appeal to consumers by offering new private label wines for more affordable prices. Hypermarket Lotte Mart, for example, launched its own private label that sells for KRW3,900 (US$4.11). E-commerce also became more popular, from 1.0% in 2020 to 2.8% in 2022.
It is worth noting that the share of economy wine is increasing in line with demand for wine through convenience stores (Euromonitor 2023).
| Distribution channel | 2018 | 2019 | 2020 | 2021 | 2022 |
|---|---|---|---|---|---|
| Store-based retailing | 100.0 | 100.0 | 100.0 | 100.0 | 100.0 |
| Grocery retailers | 97.3 | 97.5 | 96.4 | 95.2 | 95.0 |
| Food/drink/tobacco specialists | 8.4 | 7.7 | 6.5 | 6.0 | 5.8 |
| Hypermarkets | 57.2 | 59.0 | 62.1 | 62.4 | 62.8 |
| Other Grocery Retailers | 14.8 | 11.1 | 8.8 | 6.5 | |
| Small grocery retailers | 14.4 | 12.1 | 9.4 | 8.1 | 8.0 |
| Convenience stores | 8.9 | 9.2 | 10.2 | 10.7 | 10.8 |
| Independent small groceries | 4.0 | 3.3 | 3.4 | 3.3 | 3.0 |
| Supermarkets | 8.5 | 9.5 | 8.2 | 8.0 | 7.5 |
| Non-grocery retailer | 2.7 | 2.5 | 2.5 | 2.5 | 2.2 |
| Retail E-Commerce | 1.0 | 2.4 | 2.8 | ||
| Source: Euromonitor International, 2023 | |||||
Imports
The rise of imported wine
Over the course of the pandemic, many South Korean consumers have embraced wine for at home drinking. wine is viewed by many as indulgent, however is also more affordable than many of the spirits that are popular for business or work-related drinking. The South Korean wine market is increasingly permeated by cheap wines, and South Korean imports of wine have been growing rapidly. The South Korean wine market is still not mature and has potential for future growth. 2022 saw spike in Canadian exports of wine to South Korea.
In 2022, South Korean wine imports surged to US$581.3 million, having grown at a CAGR of 24.2% from 2018 to 2022. Even as sales of wine in South Korea contracted slightly amidst the pandemic, the growth of wine imports accelerated. Domestic production of wine is limited by scarce farmland and a climate that is not suited to grape cultivation.Footnote 3
Canada is a relatively minor player in the South Korean wine import market, with US$1.2 million in wine exports to South Korea in 2022 (0.2% market share). However, Canadian wine saw a strong growth in 2021 and 2022. Overall, from 2018 to 2022 Canadian exports of wine to South Korea grew at a CAGR of 13.8%.
Of note, American wine has become increasingly present in the South Korean market, growing at a CAGR of 34.5% from 2018 to 2022. As of 2022, The United States is now South Korea's second largest supplier of wine, behind France.
| Category | 2018 | 2019 | 2020 | 2021 | 2022 | CAGR* % 2018-2022 |
|---|---|---|---|---|---|---|
| Wine total (HS: 2204) | 244,007,347 | 259,254,957 | 330,017,230 | 559,808,540 | 581,282,439 | 24.2 |
| Wine in containers of <= 2 litres (HS: 220421) | 192,720,489 | 203,859,740 | 275,303,448 | 469,254,381 | 466,998,559 | 24.8 |
| Sparkling wine (HS: 220410) | 44,321,128 | 48,887,580 | 46,432,016 | 77,822,838 | 98,444,723 | 22.1 |
| Wine in containers of > 10 litres (HS: 220429) | 5,367,734 | 4,187,351 | 5,222,299 | 8,840,092 | 11,074,393 | 19.9 |
| Wine in containers of > 2 litres but <= 10 litres (HS: 220422) | 1,597,698 | 2,320,251 | 3,059,397 | 3,889,296 | 4,763,755 | 31.4 |
|
Source: Global Trade Tracker, 2023 *CAGR: Compound annual growth rate |
||||||
| Country | 2018 | 2019 | 2020 | 2021 | 2022 | CAGR* % 2018-2022 |
|---|---|---|---|---|---|---|
| France | 49,909,682 | 49,855,057 | 61,192,136 | 126,000,442 | 130,301,882 | 27.1 |
| United States | 29,283,212 | 32,321,426 | 52,883,129 | 83,130,284 | 95,864,491 | 34.5 |
| Italy | 26,420,560 | 29,995,689 | 40,981,903 | 77,875,843 | 71,171,651 | 28.1 |
| Chile | 45,146,748 | 47,945,242 | 57,810,064 | 73,466,163 | 65,110,593 | 9.6 |
| Spain | 11,703,412 | 11,296,723 | 17,244,805 | 29,441,063 | 29,691,220 | 26.2 |
| Australia | 14,651,330 | 15,986,643 | 20,555,265 | 33,405,445 | 27,449,784 | 17.0 |
| New Zealand | 3,559,719 | 3,885,332 | 6,570,556 | 15,276,899 | 15,095,684 | 43.5 |
| Argentina | 4,940,048 | 5,090,316 | 7,213,619 | 11,367,364 | 10,925,483 | 22.0 |
| Portugal | 1,127,333 | 1,798,022 | 4,249,112 | 7,197,359 | 6,953,299 | 57.6 |
| Germany | 1,969,536 | 1,946,277 | 2,283,639 | 4,016,976 | 5,195,588 | 27.4 |
| South Africa | 1,475,135 | 904,420 | 919,396 | 1,609,853 | 1,800,558 | 5.1 |
| Canada (12th) | 721,273 | 792,469 | 725,103 | 1,176,447 | 1,211,353 | 13.8 |
|
Source: Global Trade Tracker, 2023 *CAGR: Compound annual growth rate |
||||||
Wine in containers of size 2 litres or smaller made up 98.5% of Canadian wine exports to South Korea in 2022.
| Category | 2018 | 2019 | 2020 | 2021 | 2022 | CAGR* % 2018-2022 |
|---|---|---|---|---|---|---|
| Wine total (HS: 2204) | 727,867 | 797,424 | 737,769 | 1,190,775 | 1,217,554 | 13.7 |
| Wine in containers of <= 2 litres (HS: 220421) | 721,273 | 792,469 | 725,103 | 1,176,447 | 1,211,353 | 13.8 |
| Sparkling wine (HS: 220410) | 5,153 | 3,520 | 9,438 | 10,976 | 7 | −80.8 |
| Wine in containers of > 10 litres: (HS: 220429) | 1,441 | 1,435 | 3,228 | 3,352 | 6,184 | 43.9 |
|
Source: Global trade tracker, 2023 *CAGR: Compound annual growth rate |
||||||
South Korea overview
South Korea is the tenth largest economy in the world and fourth largest in Asia, with a gross domestic product of US$1.8 trillion and a population of 51.8 million. South Korea's population is highly educated and productive, while the country enjoys low unemployment and solid economic growth. South Korea also has the lowest fertility rate in the world and a rapidly aging population. Single person households are becoming increasingly common throughout the country and are an increasing part of South Korean consumer demand.
| Metropolitan area | Population |
|---|---|
| Seoul | 9.5 million |
| Busan | 3.3 million |
| Incheon | 3.0 million |
| Daegu | 2.4 million |
| Daejeon | 1.5 million |
| Gwangju | 1.4 million |
| Source: Korean Statistical Information Service | |
| Age group in 2021 | Population ('000) in 2021 | Average gross income in US$ | ||
|---|---|---|---|---|
| 2021 | 2025 | CAGR* % 2021-2025 | ||
| Population | 51,821.7 | 29,835.6 | 35,154.8 | 4.2 |
| Population (0-19) | 8,500.7 | 15,628.8 (age 15-19) | 18,612.1 (age 15-19) | 4.5 |
| Population (20-24) | 3,213.1 | 25,111.4 | 29,778.7 | 4.4 |
| Population (25-29) | 3,676.4 | 28,868.6 | 34,084.6 | 4.2 |
| Population (30-34) | 3,339.6 | 31,199.8 | 36,672.5 | 4.1 |
| Population (35-39) | 3,713.1 | 32,008.8 | 37,488.4 | 4.0 |
| Population (40-44) | 3,972.5 | 32,893.4 | 38,448.6 | 4.0 |
| Population (45-49) | 4,240.7 | 32,995.6 | 38,560.8 | 4.0 |
| Population (50-54) | 4,439.6 | 32,446.0 | 37,979.0 | 4.0 |
| Population (55-59) | 4,135.5 | 31,537.1 | 37,034.2 | 4.1 |
| Population (60-64) | 4,060.6 | 30,679.1 | 36,185.4 | 4.2 |
| Population 65+ | 8,529.8 | 28,844.6 | 34,192.7 | 4.3 |
|
Source: Euromonitor International, 2022 *CAGR: Compound annual growth rate |
||||
Doing business in South Korea
When contact with a South Korean importer is established, it is advisable to visit the importer in person. There is no substitute for face-to-face meetings because Korean traders highly value face-to-face contacts when developing business relationships with new foreign suppliers. Cold calls usually don't work with South Korean businesspeople. One of the best ways for new-to-market Canadian suppliers to develop contacts with a large number of Korean buyers/importers is through participation at a trade show. Seoul Food & Hotel (www.seoulfoodnhotel.co.kr) which is the leading food trade show held annually in South Korea. Participating in these shows enhances initial contacts with importers, agents, wholesalers, distributors, retailers and others in the food and beverage industry.
Taxes
On January 1, 2020, South Korea abolished its previous 72 percent tax on beer. In its stead, Korea has a implemented a volume based KRW830.3 (US$0.72) per-litre tax.Footnote 4 This new tax is to the benefit of more expensive beers, with any beer priced over US$1.00 a litre (before tax) seeing its taxes decline.
Tariffs
Since January 1, 2019, most of Canada's exports have benefited from duty-free access into South Korea under the Canada-Korea Free Trade Agreement (CKFTA). South Korea will eliminate all tariffs on alcoholic beverages by 2024. Consult theCanada Tariff Finder to explore tariff information for the South Korean market under the CKFTA, and other foreign markets with which Canada has a free trade agreement.
Tariff preferences for key Canadian alcoholic beverage exports to South Korea:
- Beer - tariff of 30% was eliminated in 2021;
- Rye whisky - tariff was eliminated in 2015;
- Canadian wine - tariff was eliminated in 2017;
- Canadian vodka - tariff of 20% will be eliminated by 2024 (tariff is reduced to 10% for 2019).
| Date | Beer (HS: 2203) | Rye whisky (HS:220830.30) | Gin (HS: 220850) | Wine (HS: 220421) |
|---|---|---|---|---|
| Most Favoured Nation[1] | 30.0 | 30.0 | 30.0 | 30.0 |
| 2017 | 17.1 | 0.0 | 14.0 | 0.0 |
| 2018 | 12.9 | 0.0 | 12.0 | 0.0 |
| 2019 | 8.6 | 0.0 | 10.0 | 0.0 |
| 2020 | 4.3 | 0.0 | 8.0 | 0.0 |
| 2021 | 0.0 | 0.0 | 6.0 | 0.0 |
| 2022 | 0.0 | 0.0 | 4.0 | 0.0 |
| 2023 | 0.0 | 0.0 | 2.0 | 0.0 |
| 2024 | 0.0 | 0.0 | 0.0 | 0.0 |
|
Source: Canada Tariff Finder 1: The Most Favoured Nation (MFN) tariff rates of South Korea are generally applicable to imports from all countries. MFN is a status or level of treatment accorded by one state to another in international trade. |
||||
For more information
The Canadian Trade Commissioner Service:
International Trade Commissioners can provide Canadian industry with on-the-ground expertise regarding market potential, current conditions and local business contacts, and are an excellent point of contact for export advice.
More agri-food market intelligence:
International agri-food market intelligence
Discover global agriculture and food opportunities, the complete library of Global Analysis reports, market trends and forecasts, and information on Canada's free trade agreements.
Agri-food market intelligence service
Canadian agri-food and seafood businesses can take advantage of a customized service of reports and analysis, and join our email subscription service to have the latest reports delivered directly to their inbox.
More on Canada's agriculture and agri-food sectors:
Canada's agriculture sectors
Information on the agriculture industry by sector. Data on international markets. Initiatives to support awareness of the industry in Canada. How the department engages with the industry.
Resources
- Euromonitor International. Alcoholic Drinks in South Korea, June 2023
- Euromonitor International. Beer in South Korea, June 2023
- Euromonitor International. Spirits in South Korea, June 2023
- Euromonitor International. Wine in South Korea, June 2023
- Global Trade Tracker, 2023.
- Mintel Global New Products Database, 2023.
- United States Department of Agriculture, South Korea: Distilled Spirits Market Report, May 2020
- United States Department of Agriculture, South Korea: Wine Market Report, March 2021
- United States Department of Agriculture, South Korea Adopts Volume-based Liquor Tax for Beer, January 2020
Sector Trend Analysis – Beer, wine and spirits South Korea
Global Analysis Report
Prepared by: Hongli Wang, Market Analyst
© His Majesty the King in Right of Canada, represented by the Minister of Agriculture and Agri-Food (2024).
Photo credits
All photographs reproduced in this publication are used by permission of the rights holders.
All images, unless otherwise noted, are copyright His Majesty the King in Right of Canada.
To join our distribution list or to suggest additional report topics or markets, please contact:
Agriculture and Agri-Food Canada, Global Analysis1341 Baseline Rd, Tower 5, 3rd floor
Ottawa ON K1A 0C5
Canada
Email: aafc.mas-sam.aac@agr.gc.ca
The Government of Canada has prepared this report based on primary and secondary sources of information. Although every effort has been made to ensure that the information is accurate, Agriculture and Agri-Food Canada (AAFC) assumes no liability for any actions taken based on the information contained herein.
Reproduction or redistribution of this document, in whole or in part, must include acknowledgement of agriculture and agri-food Canada as the owner of the copyright in the document, through a reference citing AAFC, the title of the document and the year. Where the reproduction or redistribution includes data from this document, it must also include an acknowledgement of the specific data source(s), as noted in this document.
Agriculture and Agri-Food Canada provides this document and other report services to agriculture and food industry clients free of charge.