

Note: This report includes forecasting data that is based on baseline historical data.
Executive summary
Baked goods retail sales in the United States (U.S.) increased at a compound annual growth rate (CAGR) of 5.9% over 2018 to 2022, reaching US$82.9 billion in 2022. It is expected to grow at a CAGR of 3.1% over 2023 to 2027, reaching US$97.7 billion in 2026. Bread was the best performing category over 2018 to 2022, with retail value sales increasing by CAGR of 6.3%. reaching US$30.0 billion.
2022 witnessed a strong comeback for baked goods as occasions, seasonal and religious celebrations returned to prepandemic patterns. This was evident as travel peaked with many families reuniting for celebrations such as birthdays, weddings and graduations, thus driving up demand for baked goods.
Artisanal baked good companies (bakeries) make up the largest manufacturer of baked goods, or almost half the market, ffollowed by private labels and 'others'. Top three baked goods companies were Grupo Bimbo, followed by Flowers Food and Hostess Brands. Over 2018 to 2022, Gruma SAB sales grew the fastest by a CAGR of 10.4%, followed by Flower Foods (8.1%) and Hostess Brands (8.0%).
Grupo Bimbo brands dominate with Sara Lee, Entenmann's, Thomas, and Orowheat in the top 15. Hostess (Hostess Brands), Little Debbie (McKee Foods) and Sara Lee (Grupo Bimbo) are the three largest baked goods brands in the U.S.
Grocery retailers represent 93.9% of baked goods distribution in the U.S., while the remainder are distributed through non-grocery specialists, mixed retailers, and non-store retailing.
According to Mintel, top sub-categories of new bakery products included sweet biscuits/cookies, baking ingredients and mixes, bread and bread products, and cakes, pastries & sweet goods.
Retail environment and trends
Baked goods retail sales in the U.S. increased at a CAGR of 5.9% over 2018 to 2022, reaching US$82.9 billion in 2022. It is expected to grow at a CAGR of 3.1% over 2023 to 2027, reaching US$97.7 billion in 2026. Bread was the best performing category over 2018 to 2022, with retail value sales increasing by CAGR of 6.3%. reaching US$30.0 billion.
2022 witnessed a strong comeback for baked goods as occasions, seasonal and religious celebrations returned to pre-pandemic patterns. This was evident as travel peaked with many families reuniting for celebrations such as birthdays, weddings and graduations, thus driving up demand for baked goods. Fresh baked goods such as cakes, pastries and pies benefited more from this trend compared with frozen baked goods. Although health concerns remain in some categories, such as bread, people still want to indulge occasionally, thus leading to a stronger demand in categories such as cakes and pastries.
According to Euromonitor, Inflation in the U.S. reached historic levels in 2022, peaking at 9% during the middle of the year, prompted many manufacturers to revisit their pricing strategy, cut costs, yet deliver high-quality products with significant price increases witnessed across baked goods categories in 2022.
Category | 2018 | 2022 | CAGR* % 2018-2022 | 2023 | 2027 | CAGR* % 2022-2027 |
|---|---|---|---|---|---|---|
Baked goods | 65,951.7 | 82,933.7 | 5.9 | 86,641.3 | 97,740.0 | 3.1 |
Bread | 23,541.2 | 30,018.4 | 6.3 | 31,194.3 | 34,367.6 | 2.5 |
Cakes | 20,385.3 | 25,816.6 | 6.1 | 27,129.9 | 31,163.1 | 3.5 |
Dessert mixes | 1,938.1 | 1,941.4 | 0.0 | 1,941.6 | 2,073.4 | 1.7 |
Frozen baked goods | 2,256.5 | 2,458.9 | 2.2 | 2,572.8 | 2,867.0 | 2.7 |
Pastries | 15,541.8 | 19,747.4 | 6.2 | 20,718.9 | 23,793.0 | 3.5 |
Source: Euromonitor International, 2023 *CAGR: Compound Annual Growth Rate | ||||||
Artisanal baked good companies make up the largest manufacturer of baked goods, or almost half the market, followed by private labels and 'others'. Top three baked goods companies were Grupo Bimbo (US$6.7 billion in 2022), followed by Flowers Food (US$3.1 billion in 2022) and Hostess Brands (US$1.9 billion in 2022). Over 2018 to 2022, Gruma SAB sales grew the fastest by a CAGR of 10.4%, followed by Flower Foods (8.1%) and Hostess Brands (8.0%).
Company | 2018 | 2019 | 2020 | 2021 | 2022 | CAGR* % 2018-2022 |
|---|---|---|---|---|---|---|
Grupo Bimbo SAB de CV | 5,038.0 | 5,070.5 | 5,643.2 | 6,101.2 | 6,683.1 | 7.3 |
Flowers Foods Inc | 2,265.4 | 2,304.9 | 2,655.8 | 2,859.8 | 3,097.6 | 8.1 |
Hostess Brands LLC | 1,402.2 | 1,430.6 | 1,579.2 | 1,736.3 | 1,906.3 | 8.0 |
McKee Foods Corp | 1,301.2 | 1,309.9 | 1,441.9 | 1,553.8 | 1,686.9 | 6.7 |
Kellogg Co | 1,440.5 | 1,420.6 | 1,439.8 | 1,468.5 | 1,495.4 | 0.9 |
Gruma SAB de CV | 866.0 | 897.6 | 1,052.4 | 1,157.6 | 1,286.3 | 10.4 |
Campbell Soup Co | 990.1 | 978.1 | 1,011.7 | 1,072.3 | 1,133.3 | 3.4 |
General Mills Inc | 632.0 | 634.8 | 672.9 | 671.4 | 675.4 | 1.7 |
ConAgra Brands Inc | 451.3 | 451.0 | 479.6 | 494.5 | 502.4 | 2.7 |
Lancaster Colony Corp | 390.6 | 393.5 | 420.4 | 433.6 | 450.9 | 3.7 |
Artisanal | 28,569.9 | 29,061.1 | 31,779.7 | 33,104.6 | 36,129.9 | 6.0 |
Others | 9,718.2 | 9,650.6 | 10,304.8 | 11,005.8 | 11,781.5 | 4.9 |
Private label | 11,896.2 | 12,174.9 | 13,405.0 | 13,800.0 | 15,005.6 | 6.0 |
Total | 65,951.7 | 66,775.0 | 72,943.4 | 76,540.8 | 82,933.7 | 5.9 |
Brownberry (Grupo Bimbo SAB de CV) | 441.5 | 436.8 | 429.9 | 449.6 | 456.4 | 0.7 |
Total all companies | 58,309.0 | 59,461.7 | 60,215.2 | 65,759.0 | 67,981.9 | 3.1 |
Source: Euromonitor International, 2023 *CAGR: Compound Annual Growth Rate | ||||||
In terms of brands, Grupo Bimbo brands dominate with Sara Lee, Entenmann's, Thomas, and Orowheat in the top 15. Hostess (Hostess Brands), Little Debbie (McKee Foods) and Sara Lee (Grupo Bimbo) are the three largest baked goods brands in the U.S.
Brand (company) | 2018 | 2019 | 2020 | 2021 | 2022 | CAGR* % 2018-2022 |
|---|---|---|---|---|---|---|
Hostess (Hostess Brands LLC) | 1,402.2 | 1,430.6 | 1,579.2 | 1,736.3 | 1,906.3 | 8.0 |
Little Debbie (McKee Foods Corp) | 1,220.4 | 1,227.0 | 1,347.1 | 1,451.3 | 1,575.5 | 6.6 |
Sara Lee (Grupo Bimbo SAB de CV) | 1,026.3 | 1,041.4 | 1,253.6 | 1,362.5 | 1,493.6 | 9.8 |
Nature's Own (Flowers Foods Inc) | 1,106.2 | 1,114.1 | 1,237.1 | 1,345.3 | 1,472.0 | 7.4 |
Thomas (Grupo Bimbo SAB de CV) | 1,026.1 | 1,028.6 | 1,145.9 | 1,251.7 | 1,392.4 | 7.9 |
Entenmann's (Grupo Bimbo SAB de CV) | 1,102.7 | 1,137.2 | 1,216.4 | 1,287.7 | 1,386.4 | 5.9 |
Mission (Gruma SAB de CV) | 866.0 | 897.6 | 1,052.4 | 1,157.6 | 1,286.3 | 10.4 |
Pepperidge Farm (Campbell Soup Co) | 990.1 | 978.1 | 1,011.7 | 1,072.3 | 1,133.3 | 3.4 |
Kellogg's Pop-Tarts (Kellogg Co) | 747.4 | 744.0 | 756.9 | 796.3 | 831.5 | 2.7 |
Oroweat (Grupo Bimbo SAB de CV) | 484.5 | 487.6 | 577.0 | 627.6 | 686.9 | 9.1 |
Artisanal | 28,569.9 | 29,061.1 | 31,779.7 | 33,104.6 | 36,129.9 | 6.0 |
Others | 13,366.0 | 13,645.3 | 15,082.8 | 15,594.8 | 16,937.4 | 6.1 |
Private label | 9,718.2 | 9,650.6 | 10,304.8 | 11,005.8 | 11,781.5 | 4.9 |
Total all brands | 65,951.7 | 66,775.0 | 72,943.4 | 76,540.8 | 82,933.7 | 5.9 |
Source: Euromonitor International, 2022 *CAGR: Compound Annual Growth Rate | ||||||
Retail subsector analysis
Bread
While all bread categories have shown post pandemic growth, growth rates vary by category. Flat bread saw the most growth with unpackaged flat bread growing the fastest, at a CAGR of 11.1% over 2018 to 2022, reaching US$1.9 billion in 2022. Sales of packaged and unpackaged leavened bread increased slightly by a CAGR of 6.8% and 5.3%. Bread will continue to grow over 2023 to 2027, although growth rates are set to slow in all categories.
According to Euromonitor, rising prices, high competitiveness and strong consumer demant in this category has led manufacturers to focus on product and packaging innovation. Despite high inflation, consumers' move towards premiumization has led several manufacturers to come up with unique products, such as Bimbo Integral cereal-based packaged leavened bread by Bimbo Bakeries USA Inc, and Mission Wholewheat Sprouted flat bread, by Gruma SAB, both launched in 2022. Bimbo Bakeries USA Inc also focuses on clean labels for its products. The rising cost of raw materials had some impact on the profitability of manufacturers, which saw margins shrink to some extent.
Today's consumers are also becoming increasingly conscious of climate change, and are choosing products that they think care for the environment. Thus manufacturers are adopting climate actions, for example, Bimbo Bakeries USA Inc claims that 90% of its packaging is recyclable and provides recommendations for consumers on know how to dispose of the packaging in the most environmentally-friendly way.
Category | 2018 | 2022 | CAGR* % 2018-2022 | 2023 | 2027 | CAGR* % 2022-2027 |
|---|---|---|---|---|---|---|
Bread | 23,541.2 | 30,018.4 | 6.3 | 31,194.3 | 34,367.6 | 2.5 |
Leavened bread | 17,827.5 | 21,945.1 | 5.3 | 22,640.0 | 24,374.8 | 1.9 |
Packaged leavened bread | 11,104.4 | 14,431.2 | 6.8 | 14,789.0 | 15,733.7 | 1.6 |
Unpackaged leavened bread | 6,723.1 | 7,513.9 | 2.8 | 7,851.0 | 8,641.1 | 2.4 |
Flat bread | 5,713.7 | 8,073.3 | 9.0 | 8,554.3 | 9,992.8 | 4.0 |
Packaged flat bread | 4,443.6 | 6,136.8 | 8.4 | 6,493.9 | 7,583.0 | 4.0 |
Unpackaged flat bread | 1,270.1 | 1,936.6 | 11.1 | 2,060.4 | 2,409.7 | 4.0 |
Source: Euromonitor International, 2022 *CAGR: Compound Annual Growth Rate | ||||||
Sara Lee and Natures Own were the largest bread companies in the U.S. with sales growing by a CAGR of 9.8% and 7.4% over 2018 to 2022 respectively, with sales increasing to US$1.5 billion respectively in 2022.
Brand (company) | 2018 | 2019 | 2020 | 2021 | 2022 | CAGR* % 2018-2022 |
|---|---|---|---|---|---|---|
Sara Lee (Grupo Bimbo SAB de CV) | 1,026.3 | 1,041.4 | 1,253.6 | 1,362.5 | 1,493.6 | 9.8 |
Nature's Own (Flowers Foods Inc) | 1,106.2 | 1,114.1 | 1,237.1 | 1,345.3 | 1,472.0 | 7.4 |
Thomas (Grupo Bimbo SAB de CV) | 1,026.1 | 1,028.6 | 1,145.9 | 1,251.7 | 1,392.4 | 7.9 |
Mission (Gruma SAB de CV) | 866.0 | 897.6 | 1,052.4 | 1,157.6 | 1,286.3 | 10.4 |
Pepperidge Farm (Campbell Soup Co) | 797.5 | 788.6 | 812.7 | 873.9 | 930.8 | 3.9 |
Oroweat (Grupo Bimbo SAB de CV) | 484.5 | 487.6 | 577.0 | 627.6 | 686.9 | 9.1 |
Brownberry (Grupo Bimbo SAB de CV) | 436.8 | 429.9 | 449.6 | 492.6 | 541.2 | 5.5 |
Arnold (Grupo Bimbo SAB de CV) | 304.9 | 299.3 | 314.5 | 333.7 | 367.2 | 4.8 |
Wonder (Flowers Foods Inc) | 134.7 | 145.4 | 176.5 | 194.6 | 215.0 | 12.4 |
Artisanal | 7,993.2 | 8,081.9 | 8,265.3 | 8,760.7 | 9,450.5 | 4.3 |
Private label | 3,478.6 | 3,329.8 | 3,405.9 | 3,490.0 | 3,597.6 | 0.8 |
Total | 5,886.3 | 6,127.4 | 6,815.9 | 7,782.6 | 8,584.9 | 9.9 |
Source: Euromonitor International, 2022 *CAGR: Compound Annual Growth Rate | ||||||
Cakes
Sales of both packaged cakes and unpacked cakes grew at a CAGR of 5.1% and 6.9% respectively over 2018 to 2022. Sales growth of Cake is expected to continue at a lower rate over 2022-27 and are expected to take time to recover to 2019's level of foodservice sales. Both chained and unchained bakeries across the U.S. took a serious financial hit during the pandemic, resulting in a reduced number of outlets specialising in sales of cakes and pastries. After the 2020 decline, strong growth in foodservice sales of cakes in 2021 and 2022 has contributed to a speedy recovery for cakes to pre-pandemic level sales in 2022 and are also set to see further growth over 2023 to 2027.
Category | 2018 | 2022 | CAGR* % 2018-2022 | 2023 | 2027 | CAGR* % 2023-2027 |
|---|---|---|---|---|---|---|
Cakes | 20,385.3 | 25,816.6 | 6.1 | 27,129.9 | 31,163.1 | 3.5 |
Unpackaged Cakes | 11,203.7 | 14,622.3 | 6.9 | 15,412.4 | 17,796.1 | 3.7 |
Packaged Cakes | 9,181.7 | 11,194.2 | 5.1 | 11,717.4 | 13,367.0 | 3.3 |
Source: Euromonitor International, 2022 *CAGR: Compound Annual Growth Rate | ||||||
Private label, followed by Hostess and Little Debbie are the largest cake brands in the U.S. Little Debbie experienced the largest growth at a CAGR of 8.7% over 2018 to 2022, followed by Hostess, which grew at a CAGR of 8.6% over 2018 to 2022.
Brand (company) | 2018 | 2019 | 2020 | 2021 | 2022 | CAGR* % 2018-2022 |
|---|---|---|---|---|---|---|
Hostess (Hostess Brands LLC) | 767.5 | 779.2 | 871.7 | 969.4 | 1,067.3 | 8.6 |
Little Debbie (McKee Foods Corp) | 732.0 | 737.8 | 847.2 | 929.0 | 1,023.8 | 8.7 |
Entenmann's (Grupo Bimbo SAB de CV) | 625.8 | 656.8 | 715.2 | 758.8 | 821.1 | 7.0 |
Tastykake (Flowers Foods Inc) | 277.6 | 279.0 | 305.0 | 316.9 | 330.9 | 4.5 |
Mrs Freshley's (Flowers Foods Inc) | 189.7 | 188.9 | 194.9 | 201.9 | 209.5 | 2.5 |
Drake's (McKee Foods Corp) | 66.7 | 68.7 | 80.4 | 87.5 | 95.8 | 9.5 |
Artisanal | 11,203.7 | 11,369.1 | 12,757.6 | 13,397.8 | 14,622.3 | 6.9 |
Private label | 2,402.2 | 2,344.2 | 2,437.0 | 2,660.7 | 2,808.4 | 4.0 |
Others | 4,120.1 | 4,145.9 | 4,565.9 | 4,388.4 | 4,837.5 | 4.1 |
Total | 20,385.3 | 20,569.6 | 22,774.8 | 23,710.3 | 25,816.6 | 6.1 |
Source: Euromonitor International, 2022 *CAGR: Compound Annual Growth Rate | ||||||
Desert mixes
Sales of dessert mixes were stagnant from 2018 to 2022, at US$1.9 billion in 2022. This trend is expected to continue over 2023 to 2027 with 1.7% sales growth.
Category | 2018 | 2022 | CAGR* % 2018-2022 | 2023 | 2027 | CAGR* % 2022-2027 |
|---|---|---|---|---|---|---|
Dessert Mixes | 1,938.1 | 1,941.4 | 0.0 | 1,941.6 | 2,073.4 | 1.7 |
Source: Euromonitor International, 2022 *CAGR: Compound Annual Growth Rate | ||||||
Jello, Betty Crocker, and Duncan Hines are the largest dessert mix brands in the U.S. with retail sales representing almost half the total market sales in 2022.
Brand (company) | 2018 | 2019 | 2020 | 2021 | 2022 | CAGR* % 2018-2022 |
|---|---|---|---|---|---|---|
Betty Crocker (General Mills Inc) | 303.3 | 311.9 | 345.6 | 336.8 | 340.7 | 2.9 |
Jell-O (Kraft Heinz Co) | 359.6 | 353.3 | 348.9 | 344.8 | 325.1 | −2.5 |
Duncan Hines (ConAgra Brands Inc) | 256.3 | 254.5 | 253.3 | 255.4 | 249.7 | −0.6 |
Pillsbury (General Mills Inc) | 70.1 | 67.4 | 65.6 | 66.4 | 62.4 | −2.9 |
Nestlé (Nestlé SA) | 61.0 | 61.2 | 60.6 | 60.8 | 60.1 | −0.4 |
Martha White (JM Smucker Co, The) | 30.1 | 27.7 | 24.8 | 24.0 | 22.8 | −6.7 |
Private label | 146.4 | 145.2 | 145.2 | 137.3 | 134.1 | −2.2 |
Others | 711.2 | 686.5 | 823.7 | 780.4 | 746.5 | 1.2 |
Total | 1,938.1 | 1,907.7 | 2,067.6 | 2,005.8 | 1,941.4 | 0.0 |
Source: Euromonitor International, 2022 *CAGR: Compound Annual Growth Rate | ||||||
Frozen baked goods
Sales of frozen baked goods increased slightly over 2018 to 2022 at a CAGR of 2.2%, reaching US$2.4 billion in 2022. This slow growth rate is expected to continue over 2023 to 2027.
Category | 2018 | 2022 | CAGR* % 2018-2022 | 2023 | 2027 | CAGR* % 2022-2027 |
|---|---|---|---|---|---|---|
Frozen Baked Goods | 2,256.5 | 2,458.9 | 2.2 | 2,572.8 | 2,867.0 | 2.7 |
Source: Euromonitor International, 2022 *CAGR: Compound Annual Growth Rate | ||||||
New York brand frozen baked goods experienced the largest increase in CAGR at 3.9%, reaching US$295.0 million in 2022.
Brand (company) | 2018 | 2019 | 2020 | 2021 | 2022 | CAGR* % 2018-2022 |
|---|---|---|---|---|---|---|
Kellogg's Eggo (Kellogg Co) | 488.8 | 482.7 | 487.9 | 478.1 | 472.8 | −0.8 |
New York (Lancaster Colony Corp) | 253.6 | 255.3 | 273.2 | 282.8 | 294.9 | 3.9 |
Pillsbury (General Mills Inc) | 258.6 | 255.6 | 261.7 | 268.3 | 272.3 | 1.3 |
Sister Schubert's (Lancaster Colony Corp) | 137.0 | 138.2 | 147.2 | 150.8 | 156.0 | 3.3 |
Pepperidge Farm (Campbell Soup Co) | 120.8 | 118.2 | 119.5 | 120.8 | 123.6 | 0.6 |
Schwan's (Schwan Food Co, The) | 19.6 | 19.5 | 20.2 | 20.4 | 20.9 | 1.7 |
Bagels Lenders (ConAgra Brands Inc) | 10.6 | 10.3 | 10.7 | 11.2 | 11.5 | 2.2 |
Private label | 303.7 | 306.1 | 318.1 | 337.5 | 352.4 | 3.8 |
Others | 663.8 | 677.7 | 747.5 | 751.9 | 754.4 | 3.2 |
Total | 2,256.5 | 2,263.7 | 2,386.0 | 2,421.8 | 2,458.9 | 2.2 |
Source: Euromonitor International, 2022 *CAGR - Compound Annual Growth Rate | ||||||
Pastries
Sales of ppackaged and unpackaged pastries increase at similar rates with sales of unpackaged pastries almost double the size of packaged pastries.
Category | 2018 | 2022 | CAGR* % 2018-2022 | 2023 | 2027 | CAGR* % 2022-2027 |
|---|---|---|---|---|---|---|
Pastries | 15,541.8 | 19,747.4 | 6.2 | 20,718.9 | 23,793.0 | 3.5 |
Packaged Pastries | 6,168.8 | 7,690.3 | 5.7 | 8,012.8 | 9,053.6 | 3.1 |
Unpackaged Pastries | 9,373.0 | 12,057.1 | 6.5 | 12,706.1 | 14,739.4 | 3.8 |
Sweet Pies and Tarts | 1,303.0 | 1,600.5 | 5.3 | 1,674.3 | 1,904.3 | 3.3 |
Frozen Cakes, Sweet Pies and Tarts | 985.8 | 1,350.5 | 8.2 | 1,409.5 | 6,733.3 | 2.4 |
Source: Euromonitor International, 2022 *CAGR: Compound Annual Growth Rate | ||||||
Artisanal brands made up over half the retail sales in the market, increasing by a CAGR of 6.5% over 2018 to 2022. Following artisanal brands, private label brands have the highest retail sales and experienced the largest sales increase at a CAGR of 9.7% over 2017-22.
Brand (company) | 2018 | 2019 | 2020 | 2021 | 2022 | CAGR* % 2018-2022 |
|---|---|---|---|---|---|---|
Kellogg's Pop-Tarts (Kellogg Co) | 747.4 | 744.0 | 756.9 | 796.3 | 831.5 | 2.7 |
Hostess (Hostess Brands LLC) | 574.6 | 591.1 | 642.4 | 699.7 | 766.6 | 7.5 |
Entenmann's (Grupo Bimbo SAB de CV) | 476.9 | 480.4 | 501.3 | 528.9 | 565.3 | 4.3 |
Little Debbie (McKee Foods Corp) | 488.3 | 489.2 | 499.8 | 522.3 | 551.6 | 3.1 |
Krispy Kreme (Krispy Kreme Doughnut Corp) | 181.9 | 184.4 | 194.0 | 202.2 | 212.9 | 4.0 |
Drake's (McKee Foods Corp) | 14.2 | 14.2 | 14.5 | 15.0 | 15.7 | 2.6 |
Artisanal | 9,373.0 | 9,610.2 | 10,756.8 | 10,946.1 | 12,057.1 | 6.5 |
Private label | 2,709.5 | 2,839.2 | 3,198.5 | 3,525.2 | 3,927.0 | 9.7 |
Others | 976.0 | 981.5 | 1,064.9 | 752.8 | 819.7 | −4.3 |
Total | 15,541.8 | 15,934.3 | 17,629.2 | 17,988.5 | 19,747.4 | 6.2 |
Source: Euromonitor International, 2022 *CAGR: Compound Annual Growth Rate | ||||||
Distribution channels
The vast majority of bakery products in the U.S. are distributed through store-based retailing. Grocery retailers represent 93.9% of distribution, out of which 45.4% represent supermarkets, while the remainder are distributed through non-grocery specialists, mixed retailers, and non-store retailing.
According to Euromonitor, with foodservice coming back to life in 2021, consumers are increasingly enjoying unpackaged baked goods. Foodservices' rapid growth is expected to pressure sales of packaged baked goods, especially in categories such as cakes and pastries, as well as dessert pies and tarts, as consumers seek out freshly produced products instead of packaged ones. Frozen baked goods faces more threat than other categories, as the preference for fresh products will continue to grow. For manufacturers of baked goods, this will mean continuous investment in product innovation, as well as in price promotions, to capture consumers' attention.
As consumers have grown used to purchasing groceries online, several retailers are investing heavily in order to make online shopping even more convenient for their customers. Albertson's, a prominent US grocer, has been collaborating with Google in order to leverage the latter's Artificial Intelligence (AI) to enhance customers' online shopping experience. Such advances in e-commerce technology, ease of ordering, as well as high fuel costs, will continue to bolster online sales.
Outlet type | 2018 | 2019 | 2020 | 2021 | 2022 | CAGR* % 2018-2022 | Share % 2022 |
|---|---|---|---|---|---|---|---|
Retail channels | 65,951.7 | 66,775.0 | 72,943.4 | 76,540.8 | 82,933.7 | 5.9 | 100 |
Retail offline | 63,975.4 | 64,265.5 | 68,446.2 | 71,675.9 | 77,893.0 | 5.0 | 93.9 |
Grocery retailers | 59,766.5 | 60,054.5 | 64,348.5 | 67,221.3 | 73,256.3 | 5.2 | 88.3 |
Convenience retail | 2,624.7 | 2,652.5 | 2,415.9 | 2,900.5 | 3,213.1 | 5.2 | 3.9 |
Convenience stores | 2,092.5 | 2,115.6 | 2,096.4 | 2,325.7 | 2,553.0 | 5.1 | 3.1 |
Forecourt retailers | 532.2 | 536.9 | 319.5 | 574.8 | 660.1 | 5.5 | 0.8 |
Supermarkets | 30,695.7 | 30,727.8 | 33,788.4 | 34,580.5 | 37,643.1 | 5.2 | 45.4 |
Hypermarkets | 9,645.2 | 9,684.0 | 10,522.4 | 10,931.3 | 11,917.0 | 5.4 | 14.4 |
Discounters | 5,187.2 | 5,261.6 | 5,680.4 | 5,971.4 | 6,505.7 | 5.8 | 7.8 |
Warehouse clubs | 2,670.0 | 2,661.3 | 3,032.8 | 3,205.9 | 3,505.7 | 7.0 | 4.2 |
Food/drink/tobacco specialists | 6,283.1 | 6,376.6 | 6,546.8 | 6,933.1 | 7,553.1 | 4.7 | 9.1 |
Small local grocers | 2,660.7 | 2,690.8 | 2,361.8 | 2,698.7 | 2,918.8 | 2.3 | 3.5 |
Non-grocery retailers | 3,942.5 | 3,941.7 | 3,949.8 | 4,268.6 | 4,429.9 | 3.0 | 5.3 |
General merchandise stores | 1,040.8 | 1,037.5 | 1,182.3 | 1,248.1 | 1,367.9 | 7.1 | 1.6 |
Health and beauty specialists | 2,901.7 | 2,904.2 | 2,767.5 | 3,020.4 | 3,062.0 | 1.4 | 3.7 |
Vending | 266.4 | 269.3 | 147.9 | 186.1 | 206.8 | −6.1 | 0.2 |
Retail e-commerce | 1,976.3 | 2,509.5 | 4,497.3 | 4,864.9 | 5,040.6 | 26.4 | 6.1 |
Source: Euromonitor International, 2022 *CAGR: Compound Annual Growth Rate | |||||||
New product launch analysis
According to Mintel, 10,876 bakery products were launched in the U.S. from 2018 to 2022. Top sub-categories of new bakery products included sweet biscuits/cookies, baking ingredients and mixes, bread and bread products, and cakes, pastries & sweet goods. Flexible was the most common package type, followed by flexible stand-up pouch. New variety/range extension was the largest new launch type, followed by new packaging, and new products.
Product attributes | Yearly launch counts | Total | ||||
|---|---|---|---|---|---|---|
2018 | 2019 | 2020 | 2021 | 2022 | ||
Yearly product launches | 2,078 | 2,146 | 2,181 | 2,413 | 2,058 | 10,876 |
Top five sub-categories | ||||||
Sweet biscuits/Cookies | 617 | 674 | 636 | 667 | 586 | 3,180 |
Baking ingredients and Mixes | 502 | 548 | 672 | 712 | 590 | 3,024 |
Bread and bread products | 357 | 423 | 406 | 375 | 319 | 1,880 |
Cakes, pastries and sweet goods | 423 | 347 | 284 | 428 | 388 | 1,870 |
Savoury biscuits/crackers | 179 | 154 | 183 | 231 | 175 | 922 |
Top five claims | ||||||
Kosher | 1,096 | 1,172 | 1,118 | 1,209 | 1,082 | 5,677 |
Social media | 494 | 522 | 482 | 560 | 545 | 2,603 |
No additives/preservatives | 483 | 564 | 490 | 580 | 474 | 2,591 |
Ethical - environmentally friendly package | 414 | 395 | 442 | 583 | 598 | 2,432 |
Low/No/Reduced allergen | 422 | 439 | 464 | 539 | 470 | 2,334 |
Imported status | ||||||
Imported | 423 | 507 | 485 | 664 | 552 | 2,631 |
Not imported | 335 | 332 | 361 | 296 | 298 | 1,622 |
Top packaged types | ||||||
Flexible | 1,436 | 1,552 | 1,436 | 1,536 | 1,391 | 7,351 |
Flexible stand-up pouch | 168 | 166 | 254 | 265 | 221 | 1,074 |
Carton | 111 | 102 | 131 | 87 | 33 | 464 |
Clam-pack | 105 | 64 | 72 | 111 | 106 | 458 |
Tub | 73 | 74 | 88 | 80 | 47 | 362 |
Top launch types | ||||||
New variety/Range extension | 861 | 1,026 | 993 | 1,110 | 926 | 4,916 |
New packaging | 660 | 588 | 604 | 586 | 611 | 3,049 |
New product | 378 | 348 | 469 | 571 | 365 | 2,131 |
Relaunch | 167 | 178 | 105 | 141 | 144 | 735 |
New formulation | 12 | 6 | 10 | 5 | 12 | 45 |
Top five flavours (including blend) | ||||||
Unflavoured/Plain | 549 | 569 | 600 | 590 | 503 | 2,811 |
Chocolate | 222 | 219 | 204 | 237 | 199 | 1,081 |
Vanilla/Vanilla bourbon/Vanilla madagascar | 56 | 56 | 36 | 73 | 48 | 269 |
Butter | 43 | 31 | 21 | 39 | 36 | 170 |
Blueberry | 34 | 25 | 29 | 36 | 29 | 153 |
Top five ingredients | ||||||
Salt (Food) | 1,501 | 1,514 | 1,454 | 1,664 | 1,447 | 7,580 |
Wheat flour (Food) | 1,524 | 1,533 | 1,469 | 1,614 | 1,430 | 7,570 |
White sugar (Food) | 1,341 | 1,429 | 1,407 | 1,580 | 1,368 | 7,125 |
Food acids | 1,447 | 1,397 | 1,377 | 1,526 | 1,374 | 7,121 |
Sodium hydrogen carbonate (Food) | 1,219 | 1,148 | 1,186 | 1,401 | 1,181 | 6,135 |
Top five companies | ||||||
Aldi | 22 | 82 | 108 | 94 | 76 | 382 |
Mondelez Global | 63 | 102 | 57 | 72 | 50 | 344 |
Kroger | 75 | 78 | 45 | 81 | 50 | 329 |
Target | 19 | 28 | 41 | 161 | 80 | 329 |
Walmart | 83 | 73 | 69 | 44 | 44 | 313 |
Source: Mintel GNPD, 2022 | ||||||
Examples of new product launches
Gluten Free Gingerbread Donuts
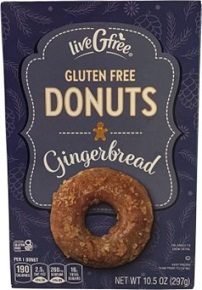
Source: Mintel Global New Products Database, 2023
Company | Aldi |
|---|---|
Brand | LiveGfree |
Category | Bakery |
Sub-category | Cakes, pastries and sweet goods |
Market | United States |
Store name | Aldi |
Store type | Supermarket |
Price in US dollars | 4.99 |
LiveGfree Gluten Free Gingerbread Donuts retail in a 10.5 ounce pack. - For Christmas 2022 - Can be thawed in a microwave - Sourced and made from premium quality, gluten-free ingredients - Free from dairy, nut, soy, wheat - Logos and certifications: Gluten Free Certified by GFCO.org, Kosher, How2Recycle with Check Locally
Avocado Toast Salt & Pepper Crunchy Baked Rice Crackers
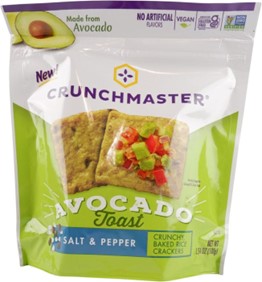
Source: Mintel Global New Products Database, 2023
Company | TH Foods |
|---|---|
Manufacturer | TH Foods |
Brand | Crunchmaster |
Category | Bakery |
Sub-category | Savoury biscuits / crackers |
Market | United States |
Store name | Kroger |
Store type | Supermarket |
Price in US dollars | 3.99 |
Crunchmaster Avocado Toast Salt & Pepper Crunchy Baked Rice Crackers retail in a 3.54 ounce pack. - Made from avocado - No artificial flavours - Vegan - Resealable pack - Great for topping and for dipping - 0 grams trans fat, 0 grams saturated fat, 0 milligrams cholesterol per serving - Proud sponsor of Celiac Disease Foundation - Beyond Celiac Together for a Cure - Logos and certifications: Kosher, Gluten Free, NON GMO Project Verified
Buttermilk & Vanilla Protein-Packed Thick and Fluffy Power Waffles
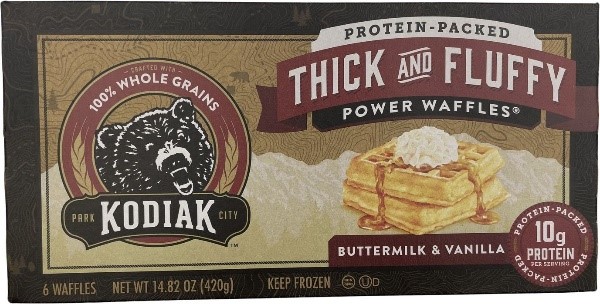
Source: Mintel Global New Products Database, 2023
Company | Kodiak Cakes |
|---|---|
Manufacturer | Kodiak Cakes |
Brand | Kodiak |
Category | Bakery |
Sub-category | Cakes, pastries and sweet goods |
Market | United States |
Location of manufacture | Canada |
Import status | Imported product |
Store name | Shoprite |
Store type | Supermarket |
Price in US dollars | 6.99 |
Kodiak Buttermilk & Vanilla Protein-Packed Thick and Fluffy Power Waffles retails in a 14.82 ounce pack containing 6 units. - Crafted with 100% whole grains - 10 grams protein per serving - Microwaveable - Recyclable pack - Every purchase supports Grizzly Bear and Wildlife Foundations - Logos and certifications: Non-GMO, Kosher, Instagram, Twitter, Facebook, YouTube, Pinterest
Pumpkin Muffins with Cream Cheese Filling
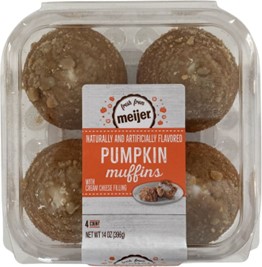
Source: Mintel Global New Products Database, 2023
Company | Meijer |
|---|---|
Brand | Fresh from Meijer |
Category | Bakery |
Sub-category | Cakes, pastries and sweet goods |
Market | United States |
Location of manufacture | Canada |
Import status | Imported product |
Store name | Meijer |
Store type | Supermarket |
Price in US dollars | 4.99 |
Fresh from Meijer Pumpkin Muffins with Cream Cheese Filling retail in a 14 ounce pack containing four muffins. - Naturally and artificially flavoured - Recyclable pack - Logos and certifications: Kosher, How2Recycle with Check Locally
For more information
The Canadian Trade Commissioner Service:
International Trade Commissioners can provide Canadian industry with on-the-ground expertise regarding market potential, current conditions and local business contacts, and are an excellent point of contact for export advice.
More agri-food market intelligence:
Agri-food market intelligence service
Canadian agri-food and seafood businesses can take advantage of a customized service of reports and analysis, and join our email subscription service to have the latest reports delivered directly to their inbox.
More on Canada's agriculture and agri-food sectors:
Canada's agriculture sectors
Information on the agriculture industry by sector. Data on international markets. Initiatives to support awareness of the industry in Canada. How the department engages with the industry.
For additional information on the American Food and Beverage Show, please contact:
Cecile Landgrebe
Trade Commissioner
Consulate General of Canada
Government of Canada
cecile.landgrebe@international.gc.ca
Resources
- Euromonitor International:
- Baked Goods in the U.S. (November 2022)
- Staple Foods in the U.S. (November 2022)
- Mintel Global New Products Database, 2023
Sector Trend Analysis – Bakery products in the United States
Global Analysis Report
Prepared by: Kris Clipsham, Market Analyst
© His Majesty the King in Right of Canada, represented by the Minister of Agriculture and Agri-Food (2024).
Photo credits
All photographs reproduced in this publication are used by permission of the rights holders.
All images, unless otherwise noted, are copyright His Majesty the King in Right of Canada.
To join our distribution list or to suggest additional report topics or markets, please contact:
Agriculture and Agri-Food Canada, Global Analysis
1341 Baseline Rd, Tower 5, 3rd floor
Ottawa ON K1A 0C5
Canada
Email: aafc.mas-sam.aac@agr.gc.ca
The Government of Canada has prepared this report based on primary and secondary sources of information. Although every effort has been made to ensure that the information is accurate, Agriculture and Agri-Food Canada (AAFC) assumes no liability for any actions taken based on the information contained herein.
Reproduction or redistribution of this document, in whole or in part, must include acknowledgement of agriculture and agri-food Canada as the owner of the copyright in the document, through a reference citing AAFC, the title of the document and the year. Where the reproduction or redistribution includes data from this document, it must also include an acknowledgement of the specific data source(s), as noted in this document.
Agriculture and Agri-Food Canada provides this document and other report services to agriculture and food industry clients free of charge.