

Note: This report includes forecasting data that is based on baseline historical data.
Executive summary
The Japanese pet food market exhibits dynamic trends and significant changes in consumer behaviour, reflecting a complex interplay of factors such as pet humanization, premiumization, sustainability, and evolving distribution channels.
In 2023, the global pet food market reached a retail value of US$134.0 billion.
Japan ranked as the ninth-largest market globally, with a value of US$4.2 billion, despite a compound annual growth rate (CAGR) decrease of 0.5% from 2019 to 2023. Canada and Japan shared a noteworthy trade relationship, with Canada being the tenth-largest exporter of dog and cat food globally, reaching US$713.2 million in 2023.
Pet humanization continues to drive market dynamics, with Japanese pet owners treating their animals as cherished family members. The premiumization of cat food persists, driven by an enduring trend of pet humanization and an unwavering commitment to providing high-quality food for feline companions. Japanese pet owners also exhibit a growing concern for the environment, influencing market players to adopt sustainable practices.
The pet population in Japan grew at a CAGR of 0.6% from 2019 to 2023, reaching 55.8 million pets. Cats and dogs constituted 28.1% of the pet population in 2023, with expected growth to 8.6 million and 6.2 million, respectively, by 2028.
Inaba Foods Co Ltd, Mars Inc, and Unicharm Corp dominate the cat food sector, representing 56.2% of the market share in 2022. Mars Inc, Colgate-Palmolive Co, and DoggyMan HA Co Ltd lead the dog food sector, accounting for 50.4% of the market share in 2022.
Pet food retail sales in Japan were primarily distributed through retail offline channels, comprising 70.9% market share. Retail e-commerce experienced the largest CAGR increase (6.6%) in market share representation from 2019 to 2023, reaching 23.1%.
Trade overview
Global imports
The major pet food importers are located in Western Europe and North America, except Japan. Canada was the fifth-largest importer of dog and cat food, reaching US$1.3 billion in 2023. Japan was the tenth-largest importer of pet food, reaching US$724.2 million in 2023.
| Country | 2019 | 2020 | 2021 | 2022 | 2023 | CAGR* % 2019-2023 | Share % in 2023 |
|---|---|---|---|---|---|---|---|
| World | 15,006.5 | 17,603.3 | 20,731.9 | 22,722.8 | 23,370.7 | 11.7 | 100.0 |
| Germany | 1,514.7 | 1,684.4 | 1,993.7 | 2,098.6 | 2,425.4 | 12.5 | 10.4 |
| United States | 1,027.9 | 1,231.8 | 1,533.2 | 2,161.1 | 1,711.3 | 13.6 | 7.3 |
| United Kingdom | 890.8 | 975.6 | 1,122.7 | 1,364.8 | 1,649.2 | 16.7 | 7.1 |
| Poland | 695.5 | 988.3 | 1,149.2 | 1,140.4 | 1,398.8 | 19.1 | 6.0 |
| Canada | 799.9 | 898.1 | 1,064.3 | 1,258.6 | 1,329.9 | 13.6 | 5.7 |
| France | 719.9 | 902.0 | 1,054.1 | 918.1 | 1,193.4 | 13.5 | 5.1 |
| Italy | 677.4 | 705.0 | 847.8 | 912.6 | 901.9 | 10.4 | 3.9 |
| Belgium | 513.0 | 658.9 | 730.6 | 829.6 | 880.2 | 14.5 | 3.8 |
| Netherlands | 610.7 | 699.2 | 782.4 | 785.1 | 861.9 | 9.0 | 3.7 |
| Japan | 646.1 | 673.7 | 701.7 | 752.9 | 724.2 | 2.9 | 3.1 |
|
Source: Global Trade Tracker, 2024 *CAGR: compound annual growth rate HS Code: 230910 |
|||||||
Japan imports
Japan has a diverse supply network of pet food providers. Thailand, China and South Korea were the largest suppliers of pet food to Japan in 2023, with values of US$307.8 million (42.5% market share), US$111.1 million (15.3% market share) and US$70.8 million (9.8% market share), respectively. Canada, as Japan's seventh-largest pet food supplier, experienced an increase in CAGR of 18.2% as pet food values grew from US$12.6 million in 2019 to US$24.6 million in 2023.
| Country | 2019 | 2020 | 2021 | 2022 | 2023 | CAGR* % 2019-2023 | Market share % 2023 |
|---|---|---|---|---|---|---|---|
| World | 646.1 | 673.7 | 701.7 | 752.9 | 724.2 | 2.9 | 100.0 |
| Thailand | 262.0 | 286.0 | 297.5 | 306.9 | 307.8 | 4.1 | 42.5 |
| China | 92.0 | 100.4 | 106.7 | 112.2 | 111.1 | 4.8 | 15.3 |
| South Korea | 23.2 | 24.9 | 31.1 | 72.0 | 70.8 | 32.3 | 9.8 |
| United States | 80.1 | 68.9 | 65.0 | 60.7 | 45.8 | −13.0 | 6.3 |
| Netherlands | 34.3 | 34.1 | 33.4 | 36.4 | 28.1 | −4.9 | 3.9 |
| Australia | 33.6 | 33.9 | 40.2 | 34.0 | 25.3 | −6.9 | 3.5 |
| Canada | 12.6 | 12.7 | 15.5 | 20.7 | 24.6 | 18.2 | 3.4 |
| France | 31.5 | 33.5 | 29.7 | 16.3 | 24.3 | −6.2 | 3.4 |
| United Kingdom | 15.2 | 13.8 | 17.8 | 15.8 | 19.5 | 6.4 | 2.7 |
| Italy | 5.5 | 9.7 | 8.9 | 13.3 | 16.6 | 32.0 | 2.3 |
|
Source: Global Trade Tracker, 2024 *CAGR: compound annual growth rate HS Code: 230910 |
|||||||
Canada's performance
In 2023, Canada ranked as the tenth-largest exporter of dog and cat food in the world, exporting US$713.2 million worth of dog and cat food to the world, a 3.1% share of the total global exports of dog and cat food.
Japan, ranked the fourth-largest importer from Canada, received 3.3% (US$23.2 million) of Canadian dog and cat food exports in 2023, with a 7.8% CAGR from 2019 to 2023.
| Country | 2019 | 2020 | 2021 | 2022 | 2023 | CAGR* % 2019-2023 | Market share % 2023 |
|---|---|---|---|---|---|---|---|
| World | 598.7 | 754.2 | 844.2 | 790.4 | 713.2 | 4.5 | 100.0 |
| United States | 248.5 | 293.4 | 333.7 | 378.0 | 408.9 | 13.3 | 57.3 |
| China | 84.5 | 172.5 | 182.0 | 89.9 | 37.3 | −18.5 | 5.2 |
| Netherlands | 12.6 | 12.6 | 20.3 | 20.9 | 23.7 | 17.1 | 3.3 |
| Japan | 17.2 | 16.7 | 21.5 | 18.1 | 23.2 | 7.8 | 3.3 |
| Spain | 13.8 | 14.2 | 19.3 | 25.4 | 21.7 | 12.0 | 3.0 |
| Korea | 16.5 | 17.9 | 29.2 | 28.0 | 21.3 | 6.6 | 3.0 |
| Taiwan | 14.6 | 14.5 | 14.9 | 24.2 | 21.0 | 9.6 | 2.9 |
| New Zealand | 15.9 | 16.1 | 17.2 | 15.9 | 18.0 | 3.1 | 2.5 |
| Italy | 8.2 | 8.8 | 10.8 | 13.1 | 13.7 | 13.6 | 1.9 |
| Poland | 9.2 | 8.7 | 12.0 | 11.7 | 12.6 | 8.0 | 1.8 |
|
Source: Global Trade Tracker, 2024 *CAGR: compound annual growth rate HS Code: 230910 |
|||||||
Ontario accounted for 50.5% of the value of pet food exports to Japan in 2023, according to Canadian export data. Alberta, British Columbia and Quebec made up most of the rest of the total.
| Province | Export value | Export volume | Share among provinces, % of value |
|---|---|---|---|
| Canada | 713,244,564 | 216,924,622 | 100.0 |
| Ontario | 360,469,700 | 106,758,844 | 50.5 |
| Alberta | 176,501,159 | 71,935,810 | 24.8 |
| British Columbia | 107,028,212 | 14,188,088 | 15.0 |
| Quebec | 62,221,895 | 20,993,730 | 8.7 |
| New Brunswick | 4,043,997 | 2,121,794 | 0.6 |
| Saskatchewan | 1,790,946 | 650,527 | 0.3 |
| Manitoba | 1,009,599 | 205,038 | 0.1 |
| Nova Scotia | 127,217 | 51,644 | 0.0 |
| Prince Edward Island | 51,691 | 19,074 | 0.0 |
| Newfoundland and Labrador | 148 | 73 | 0.0 |
|
Source: Global Trade Tracker, 2024 *CAGR: compound annual growth rate HS Code: 230910 |
|||
Pet food market overview
In 2023, the global pet food market was worth US$134.0 billion retail value. Japan was ranked the ninth-largest market in the world, reaching US$4.2 billion in 2023, representing a decrease by a CAGR of 0.5% (2019-2023). Pet food retail sales in Japan are expected to grow to US$5.3 billion in 2028 at a CAGR of 4.6%.
| Geography | 2019 | 2023 | CAGR* % 2019-2023 | 2024 | 2028 | CAGR* % 2024-2028 |
|---|---|---|---|---|---|---|
| World | 96,213.2 | 134,025.7 | 8.6 | 142,441.7 | 177,015.0 | 5.7 |
| United States | 35,348.1 | 53,232.3 | 10.8 | 55,820.1 | 65,032.7 | 4.1 |
| Brazil | 5,179.1 | 8,008.5 | 11.5 | 9,217.7 | 14,236.6 | 12.2 |
| China | 4,877.5 | 7,637.2 | 11.9 | 8,366.8 | 12,236.0 | 9.9 |
| United Kingdom | 4,737.1 | 5,451.8 | 3.6 | 5,837.9 | 6,742.9 | 4.3 |
| Russia | 2,752.3 | 4,621.8 | 13.8 | 4,919.3 | 5,856.8 | 4.9 |
| Germany | 3,965.3 | 4,508.0 | 3.3 | 4,678.5 | 5,493.7 | 4.0 |
| Canada | 3,156.7 | 4,401.3 | 8.7 | 4,737.9 | 6,184.1 | 7.0 |
| France | 3,968.5 | 4,400.2 | 2.6 | 4,518.0 | 5,252.0 | 3.6 |
| Japan | 4,326.5 | 4,240.9 | −0.5 | 4,426.5 | 5,297.8 | 4.6 |
| Italy | 2,906.4 | 3,357.3 | 3.7 | 3,491.1 | 4,238.0 | 4.8 |
|
Source: Euromonitor International, 2024 *CAGR: compound annual growth rate |
||||||
Pet humanization
Japanese pet owners are increasingly treating their pets as cherished family members, driving demand for pet treats with specific attributes such as quality and ingredient source. The COVID-19 pandemic has heightened concerns over food safety, prompting pet owners to seek not only delicious tastes but also enhanced product specifications. Concurrently, the pandemic has led to a growing focus on personal health among Japanese consumers. Aligned with the health and wellness trend, pet owners are now more conscientious about their pets' health and are actively searching for premium, high-quality pet food to ensure complete nutrition and a balanced diet. This trend, driven by pet humanization, is expected to persist despite inflation and economic uncertainty (Euromonitor International, 2023).
Premiumization
Despite inflation and increased financial strain on consumers, the enduring trend of pet humanization, coupled with stronger bonds with cats, will sustain the premiumization of cat food. Pet owners are unlikely to cut back on their spending for cat food; instead, they prioritize food quality over cost considerations for their cherished feline companions. Consequently, premium cat food products, including gourmet, functional, and natural options, continue to thrive, contributing to overall value growth in this market. Within the premiumization trend, health remains a paramount focus, gaining momentum in the cat food segment. Pet owners are increasingly health-conscious, not only for themselves but also for their pets. Products with specific health functions are particularly capturing the attention of pet owners, further driving the premiumization of cat food (Euromonitor International, 2023).
Sustainability
Japanese pet owners, while still in pursuit of high-quality pet food, are concurrently developing heightened concerns about the planet's future. Responding to this environmental consciousness, Mars Japan Ltd joined the "Go Ethical" initiative, repurposing products previously discarded due to renewal or packaging issues. Roster Bell Ltd innovatively introduced "Umi no Oyatsu," dog treats upcycled from fish scraps (Euromonitor International, 2023). To address plastic pollution, Purina in Japan revamped its Mon Petit Crispy Kiss cat snacks with a new paper outer pack, achieving a substantial 66% reduction in plastic use (Mintel, 2023).
Pet population and ownership
The pet population in Japan has increased at a CAGR of 0.6%, from 54.5 million pets in 2019 to 55.8 million pets in 2023. The pet population is forecast to decrease by a CAGR of 0.3%, to 55.0 million pets by 2028. In 2023, cats and dogs accounted for 28.1% of the pet population, while other pets accounted for 71.9%. The cat and dog populations will reach 8.6 million and 6.2 million, respectively, in 2028.
Japan's dog ownership experienced a 2.3% decrease in CAGR, from 6.0 million households in 2019 to 5.5 million households in 2023. The corresponding percentage of those households owning dogs decreased from 10.8% in 2019 to 9.6% in 2023. The number of households owning cats increased from 4.85 million in 2019 to 4.88 million in 2023, representing a decrease in the percentage of those same households owning cats from 8.8% to 8.6% in the same period.
The pandemic-induced shift to remote work and social isolation further boosted cat adoption. However, with Japan's declining population and low birth rate, the cat population has now reached maturity, impacting the cat food market. Looking ahead, a decline in the dog population is expected due to changing demographics, such as an aging population, increasing dual-income and single-person households, and limited urban living space. Cat ownership is favoured for its compatibility with busy lifestyles, with a preference for small-to-medium breeds in smaller living spaces. Ongoing demographic shifts discourage ownership of larger pets like dogs but support demand for other pets. Nevertheless, the significant decline in Japan's overall human population due to a declining birth rate will impact the growth of the overall pet population, including other pet (Euromonitor International, 2023).
| Category | 2019 | 2023 | CAGR* % 2019-2023 | 2024 | 2028 | CAGR* % 2024-2028 |
|---|---|---|---|---|---|---|
| Pet population | 54,472.1 | 55,776.6 | 0.6 | 55,583.5 | 55,009.6 | −0.3 |
| Cat | 8,764.0 | 8,761.6 | 0.0 | 8,709.3 | 8,617.5 | −0.3 |
| Dog (total) | 7,579.0 | 6,888.4 | −2.4 | 6,736.0 | 6,236.8 | −2.0 |
| Small dogs (up to 20 lbs or 9 kg) | 5,927.9 | 5,515.5 | −1.8 | 5,429.8 | 5,138.3 | −1.4 |
| Medium dogs (20 to 50 lbs or 9 to 23 kg) | 1,401.4 | 1,128.3 | −5.3 | 1,080.8 | 929.2 | −3.8 |
| Large dogs (over 50 lbs or over 23 kg) | 249.7 | 244.6 | −0.5 | 225.4 | 169.3 | −7.1 |
| Other pet (total) | 38,129.1 | 40,126.6 | 1.3 | 40,138.2 | 40,155.3 | 0.0 |
| Bird | 2,035.4 | 2,100.1 | 0.8 | 2,102.5 | 2,105.6 | 0.1 |
| Fish | 31,147.9 | 33,091.5 | 1.5 | 33,107.4 | 33,128.1 | 0.0 |
| Small mammal/reptile (total) | 4,945.7 | 4,935.0 | −0.1 | 4,928.4 | 4,921.6 | −0.1 |
| Small mammal | 3,148.0 | 3,222.8 | 0.6 | 3,224.8 | 3,231.1 | 0.1 |
| Reptile | 1,797.7 | 1,712.3 | −1.2 | 1,703.6 | 1,690.5 | −0.3 |
|
Source: Euromonitor International, 2024 *CAGR: compound annual growth rate |
||||||
| Category | 2019 | 2020 | 2021 | 2022 | 2023 | CAGR* % 2019-2023 |
|---|---|---|---|---|---|---|
| % Households owning a cat | 8.8 | 8.8 | 8.9 | 8.6 | 8.6 | −0.6 |
| Households owning a cat | 4,851.6 | 4,896.3 | 5,018.5 | 4,873.6 | 4,881.1 | 0.2 |
| % Households owning a dog | 10.8 | 10.3 | 9.8 | 9.7 | 9.6 | −2.9 |
| Households owning a dog | 5,992.5 | 5,728.2 | 5,490.1 | 5,472.2 | 5,459.3 | −2.3 |
|
Source: Euromonitor International, 2024 *CAGR: compound annual growth rate |
||||||
Market Segmentation
Cat food
Current value sales of cat food have grown by 1.8% (CAGR, 2018 to 2023) to US$2.2 billion. Cat treats and mixers had the best performance and most dynamic category in 2023, with a CAGR of 9.2% from 2018 to 2023.
Japanese consumers increasingly prioritize indulgent treats for their cats, emphasizing communication and shared time (Euromonitor International, 2023).
Japanese customers spent US$1.1 billion on dry cat food and US$627.1 million on wet cat food in 2023. They spent more money buying premium dry cat food (US$858.0 million in 2023) than mid-priced dry food (US$82.5 million) and economy dry food (US$133.7 million). They also spent more money buying premium wet cat food (US$357.8 million in 2023) than mid-priced wet food (US$226.9 million) and economy wet food (US$42.3 million).
Retail sales of cat food will continue to grow throughout 2023-2028 with an expected CAGR of 5.4%, achieving US$2.9 billion by 2028. Retail sales in premium non-therapeutic dry cat food will experience the highest CAGR of 7.0%, while economy wet cat food will experience the lowest CAGR of 0.1% in the forecast period.
Cat treats and mixers will continue to lead cat food categories, driven by pet owners enhancing their bond with cats. Innovation and expansion in this category are expected, catering to a broad audience. While demand for cat treats, especially wet purée formats, will grow, wet cat food is likely to decline due to the shift towards wet treats. The preference for a balanced diet with dry cat food and the rise of pouch packaging over cans, influenced by cost and aluminum price hikes, is impacting wet cat food volumes. Manufacturers, like AIXIA Corp, are adjusting product offerings to focus on mid-priced and premium ranges in pouch packaging, discontinuing wet canned products. These trends will persist, influencing the volume performance of wet cat food in the forecast period (Euromonitor International, 2023).
| Category | 2018 | 2019 | 2020 | 2021 | 2022 | 2023 |
|---|---|---|---|---|---|---|
| Cat Food (total) | 2,025.7 | 2,097.8 | 2,290.1 | 2,361.4 | 2,112.8 | 2,213.9 |
| Cat Treats and Mixers | 330.7 | 368.2 | 446.9 | 511.5 | 481.2 | 512.6 |
| Dry Cat Food | 1,012.9 | 1,046.4 | 1,113.1 | 1,130.3 | 1,016.2 | 1,074.2 |
| Economy Dry Cat Food | 158.1 | 158.0 | 163.7 | 153.5 | 132.7 | 133.7 |
| Mid-Priced Dry Cat Food | 105.5 | 101.2 | 105.1 | 95.5 | 81.9 | 82.5 |
| Premium Dry Cat Food | 749.3 | 787.2 | 844.3 | 881.3 | 801.5 | 858.0 |
| Premium Therapeutic Dry Cat Food | 153.3 | 163.6 | 172.4 | 172.6 | 153.4 | 161.3 |
| Premium Non-Therapeutic Dry Cat Food | 596.0 | 623.6 | 672.0 | 708.6 | 648.1 | 696.7 |
| Wet Cat Food | 682.1 | 683.2 | 730.2 | 719.7 | 615.5 | 627.1 |
| Economy Wet Cat Food | 64.4 | 59.7 | 60.3 | 54.7 | 43.7 | 42.3 |
| Mid-Priced Wet Cat Food | 277.6 | 268.9 | 287.2 | 255.3 | 223.6 | 226.9 |
| Premium Wet Cat Food | 340.1 | 354.6 | 382.7 | 409.6 | 348.2 | 357.8 |
| Premium Therapeutic Wet Cat Food | 12.5 | 13.6 | 14.8 | 15.2 | 13.2 | 13.7 |
| Premium Non-Therapeutic Wet Cat Food | 327.6 | 341.0 | 367.9 | 394.4 | 334.9 | 344.2 |
|
Source: Euromonitor International, 2024 *CAGR: compound annual growth rate |
||||||
| Category | Annual growth % 2022-2023 | CAGR* % 2018-2023 | Total growth % 2018-2023 |
|---|---|---|---|
| Cat Food (total) | 4.8 | 1.8 | 9.3 |
| Cat Treats and Mixers | 6.5 | 9.2 | 55.0 |
| Dry Cat Food | 5.7 | 1.2 | 6.1 |
| Economy Dry Cat Food | 0.8 | −3.3 | −15.4 |
| Mid-Priced Dry Cat Food | 0.7 | −4.8 | −21.8 |
| Premium Dry Cat Food | 7.0 | 2.7 | 14.5 |
| Premium Therapeutic Dry Cat Food | 5.1 | 1.0 | 5.2 |
| Premium Non-Therapeutic Dry Cat Food | 7.5 | 3.2 | 16.9 |
| Wet Cat Food | 1.9 | −1.7 | −8.1 |
| Economy Wet Cat Food | −3.2 | −8.1 | −34.3 |
| Mid-Priced Wet Cat Food | 1.5 | −4.0 | −18.3 |
| Premium Wet Cat Food | 2.8 | 1.0 | 5.2 |
| Premium Therapeutic Wet Cat Food | 3.8 | 1.9 | 9.6 |
| Premium Non-Therapeutic Wet Cat Food | 2.8 | 1.0 | 5.1 |
|
Source: Euromonitor International, 2024 *CAGR: compound annual growth rate |
|||
| Category | 2023 | 2024 | 2025 | 2026 | 2027 | 2028 |
|---|---|---|---|---|---|---|
| Cat Food | 2,213.9 | 2,334.7 | 2,505.0 | 2,661.2 | 2,799.1 | 2,878.7 |
| Cat Treats and Mixers | 512.6 | 550.5 | 600.1 | 646.7 | 689.0 | 717.0 |
| Dry Cat Food | 1,074.2 | 1,139.3 | 1,228.7 | 1,310.8 | 1,383.7 | 1,427.5 |
| Economy Dry Cat Food | 133.7 | 135.2 | 139.5 | 143.1 | 145.7 | 145.6 |
| Mid-Priced Dry Cat Food | 82.5 | 83.7 | 86.8 | 89.4 | 91.4 | 91.7 |
| Premium Dry Cat Food | 858.0 | 920.4 | 1,002.4 | 1,078.4 | 1,146.6 | 1,190.2 |
| Premium Therapeutic Dry Cat Food | 161.3 | 170.5 | 183.2 | 195.0 | 205.4 | 211.7 |
| Premium Non-Therapeutic Dry Cat Food | 696.7 | 749.9 | 819.2 | 883.4 | 941.1 | 978.5 |
| Wet Cat Food | 627.1 | 645.0 | 676.2 | 703.7 | 726.3 | 734.3 |
| Economy Wet Cat Food | 42.3 | 41.9 | 42.5 | 43.0 | 43.2 | 42.6 |
| Mid-Priced Wet Cat Food | 226.9 | 233.6 | 245.0 | 254.9 | 263.1 | 265.9 |
| Premium Wet Cat Food | 357.8 | 369.4 | 388.7 | 405.8 | 420.1 | 425.8 |
| Premium Therapeutic Wet Cat Food | 13.7 | 14.3 | 15.2 | 16.0 | 16.7 | 17.1 |
| Premium Non-Therapeutic Wet Cat Food | 344.2 | 355.2 | 373.5 | 389.8 | 403.4 | 408.7 |
|
Source: Euromonitor International, 2024 *CAGR: compound annual growth rate |
||||||
| Category | Annual growth % 2023-2024 | CAGR* % 2023-2028 | Total growth % 2023-2028 |
|---|---|---|---|
| Cat Food (total) | 5.5 | 5.4 | 30.0 |
| Cat Treats and Mixers | 7.4 | 6.9 | 39.9 |
| Dry Cat Food | 6.1 | 5.9 | 32.9 |
| Economy Dry Cat Food | 1.1 | 1.7 | 8.9 |
| Mid-Priced Dry Cat Food | 1.5 | 2.1 | 11.2 |
| Premium Dry Cat Food | 7.3 | 6.8 | 38.7 |
| Premium Therapeutic Dry Cat Food | 5.7 | 5.6 | 31.2 |
| Premium Non-Therapeutic Dry Cat Food | 7.6 | 7.0 | 40.4 |
| Wet Cat Food | 2.9 | 3.2 | 17.1 |
| Economy Wet Cat Food | −0.9 | 0.1 | 0.7 |
| Mid-Priced Wet Cat Food | 3.0 | 3.2 | 17.2 |
| Premium Wet Cat Food | 3.2 | 3.5 | 19.0 |
| Premium Therapeutic Wet Cat Food | 4.4 | 4.5 | 24.8 |
| Premium Non-Therapeutic Wet Cat Food | 3.2 | 3.5 | 18.7 |
|
Source: Euromonitor International, 2024 *CAGR: compound annual growth rate |
|||
Dog food
Despite a decline in overall demand for dog food during the review period due to a shrinking dog population, positive value sales persisted, driven by inflation and premiumization. In the forecast period, certain dog food categories, including treats and mixers, as well as premium therapeutic and non-therapeutic options, are expected to maintain positive current value performances, aligning with the pet humanization trend (Euromonitor International, 2023).
Retail sales of dog food reached US$1.9 billion in 2023, at a CAGR of −1.3% from 2018 to 2023. Premium therapeutic wet dog food had the best performance in 2023, with a CAGR of 2.2% from 2018 to 2023. Premium dry food led sales of dry dog food (US$780.0 million in 2023), with a −0.5% CAGR from 2018 to 2023. Premium wet food led sales of wet dog food (US$147.1 million in 2023), with a −1.3% CAGR from 2018 to 2023.
Retail sales of dog food will recover throughout 2023-2028 with an expected CAGR of 3.6%, achieving US$2.2 billion by 2028. Retail sales of dog treats and mixers will experience the highest CAGR, with 5.7%, while economy wet dog food will experience the lowest CAGR, with −5.2% in the forecast period. It is forecast that premium dry food will continue to lead sales in dry dog food (US$926.9 million in 2028) with a 3.5% CAGR from 2023 to 2028, while premium wet dog food (US$171.1 million in 2028) will continue to lead sales in wet dog food with a 3.1% CAGR from 2023 to 2028.
| Category | 2018 | 2019 | 2020 | 2021 | 2022 | 2023 |
|---|---|---|---|---|---|---|
| Dog Food (total) | 2,055.4 | 2,064.2 | 2,184.7 | 2,154.0 | 1,851.6 | 1,880.2 |
| Dog Treats and Mixers | 720.1 | 716.1 | 773.6 | 782.5 | 680.7 | 705.1 |
| Dry Dog Food | 1,101.4 | 1,111.0 | 1,161.4 | 1,136.4 | 976.7 | 984.2 |
| Economy Dry Dog Food | 151.4 | 141.4 | 137.9 | 124.0 | 103.3 | 98.7 |
| Mid-Priced Dry Dog Food | 152.1 | 145.5 | 145.6 | 133.5 | 110.8 | 105.5 |
| Premium Dry Dog Food | 797.9 | 824.2 | 877.9 | 878.8 | 762.6 | 780.0 |
| Premium Therapeutic Dry Dog Food | 242.0 | 260.0 | 278.4 | 281.9 | 246.8 | 255.1 |
| Premium Non-Therapeutic Dry Dog Food | 556.0 | 564.1 | 599.4 | 596.9 | 515.8 | 525.0 |
| Wet Dog Food | 233.9 | 237.2 | 249.7 | 235.1 | 194.1 | 190.9 |
| Economy Wet Dog Food | 35.2 | 34.2 | 34.5 | 27.5 | 20.4 | 18.2 |
| Mid-Priced Wet Dog Food | 41.9 | 41.3 | 42.5 | 37.1 | 28.1 | 25.5 |
| Premium Wet Dog Food | 156.8 | 161.7 | 172.8 | 170.6 | 145.6 | 147.1 |
| Premium Therapeutic Wet Dog Food | 19.7 | 21.5 | 23.4 | 24.0 | 21.2 | 22.0 |
| Premium Non-Therapeutic Wet Dog Food | 137.1 | 140.2 | 149.4 | 146.6 | 124.4 | 125.2 |
|
Source: Euromonitor International, 2024 *CAGR: compound annual growth rate |
||||||
| Category | Annual growth % 2022-2023 | CAGR* % 2018-2023 | Total growth % 2018-2023 |
|---|---|---|---|
| Dog Food (total) | 1.5 | −1.8 | −8.5 |
| Dog Treats and Mixers | 3.6 | −0.4 | −2.1 |
| Dry Dog Food | 0.8 | −2.2 | −10.6 |
| Economy Dry Dog Food | −4.5 | −8.2 | −34.8 |
| Mid-Priced Dry Dog Food | −4.8 | −7.1 | −30.6 |
| Premium Dry Dog Food | 2.3 | −0.5 | −2.2 |
| Premium Therapeutic Dry Dog Food | 3.4 | 1.1 | 5.4 |
| Premium Non-Therapeutic Dry Dog Food | 1.8 | −1.1 | −5.6 |
| Wet Dog Food | −1.6 | −4.0 | −18.4 |
| Economy Wet Dog Food | −10.8 | −12.4 | −48.3 |
| Mid-Priced Wet Dog Food | −9.3 | −9.5 | −39.1 |
| Premium Wet Dog Food | 1.0 | −1.3 | −6.2 |
| Premium Therapeutic Wet Dog Food | 3.8 | 2.2 | 11.7 |
| Premium Non-Therapeutic Wet Dog Food | 0.6 | −1.8 | −8.7 |
|
Source: Euromonitor International, 2024 *CAGR: compound annual growth rate |
|||
| Category | 2023 | 2024 | 2025 | 2026 | 2027 | 2028 |
|---|---|---|---|---|---|---|
| Dog Food (total) | 1,880.2 | 1,939.7 | 2,040.7 | 2,131.2 | 2,208.5 | 2,242.1 |
| Dog Treats and Mixers | 705.1 | 745.3 | 801.4 | 853.7 | 900.6 | 929.4 |
| Dry Dog Food | 984.2 | 1,002.8 | 1,042.4 | 1,076.1 | 1,102.8 | 1,107.8 |
| Economy Dry Dog Food | 98.7 | 95.1 | 93.4 | 91.0 | 88.0 | 83.3 |
| Mid-Priced Dry Dog Food | 105.5 | 102.4 | 101.9 | 101.2 | 100.2 | 97.5 |
| Premium Dry Dog Food | 780.0 | 805.4 | 847.1 | 883.9 | 914.7 | 926.9 |
| Premium Therapeutic Dry Dog Food | 255.1 | 265.9 | 282.2 | 296.8 | 309.5 | 315.8 |
| Premium Non-Therapeutic Dry Dog Food | 525.0 | 539.5 | 565.0 | 587.1 | 605.2 | 611.1 |
| Wet Dog Food | 190.9 | 191.6 | 196.8 | 201.4 | 205.1 | 205.0 |
| Economy Wet Dog Food | 18.2 | 16.9 | 16.1 | 15.4 | 14.7 | 13.9 |
| Mid-Priced Wet Dog Food | 25.5 | 23.7 | 22.8 | 21.9 | 21.0 | 19.9 |
| Premium Wet Dog Food | 147.1 | 151.0 | 158.0 | 164.2 | 169.3 | 171.1 |
| Premium Therapeutic Wet Dog Food | 22.0 | 23.2 | 24.9 | 26.5 | 27.9 | 28.7 |
| Premium Non-Therapeutic Wet Dog Food | 125.2 | 127.8 | 133.1 | 137.7 | 141.4 | 142.4 |
|
Source: Euromonitor International, 2024 *CAGR: compound annual growth rate |
||||||
| Category | Annual growth % 2023-2024 | CAGR* % 2023-2028 | Total growth % 2023-2028 |
|---|---|---|---|
| Dog Food (total) | 3.2 | 3.6 | 19.2 |
| Dog Treats and Mixers | 5.7 | 5.7 | 31.8 |
| Dry Dog Food | 1.9 | 2.4 | 12.6 |
| Economy Dry Dog Food | −3.6 | −3.3 | −15.6 |
| Mid-Priced Dry Dog Food | −2.9 | −1.6 | −7.6 |
| Premium Dry Dog Food | 3.3 | 3.5 | 18.8 |
| Premium Therapeutic Dry Dog Food | 4.2 | 4.4 | 23.8 |
| Premium Non-Therapeutic Dry Dog Food | 2.8 | 3.1 | 16.4 |
| Wet Dog Food | 0.4 | 1.4 | 7.4 |
| Economy Wet Dog Food | −7.1 | −5.2 | −23.6 |
| Mid-Priced Wet Dog Food | −7.1 | −4.8 | −22.0 |
| Premium Wet Dog Food | 2.7 | 3.1 | 16.3 |
| Premium Therapeutic Wet Dog Food | 5.5 | 5.5 | 30.5 |
| Premium Non-Therapeutic Wet Dog Food | 2.1 | 2.6 | 13.7 |
|
Source: Euromonitor International, 2024 *CAGR: compound annual growth rate |
|||
Other pet food
Retail sales of other pet food decreased at a CAGR of 2.1%, from US$163.3 million in 2018 to US$146.8 million in 2023 and are expected to recover at a CAGR of 3.8%, reaching US$176.9 million by 2028.
Small mammal/reptile food was the largest category of other pet food in absolute value terms, with retail sales of US$68.2 million (46.5% market share) in 2023, declining 0.9% in CAGR from retail sales of US$71.8 million in 2018. Retail sales of small mammal/reptile food are expected to increase in CAGR by 4.2% to US$83.9 million by 2028.
During the 2018-2023 period, retail sales of fish food experienced the largest decrease, with a CAGR of 3.3% from US$61.4 million in 2018. Retail sales of fish food are forecast to recover by a CAGR of 3.2% to US$60.5 million by 2028.
Retail sales of bird food decreased at a CAGR of 2.5%, from US$30.5 million in 2018 to US$26.9 million in 2023, and are expected to recover at a CAGR of 3.9% reaching US$32.5 million by 2028.
| Category | 2018 | 2019 | 2020 | 2021 | 2022 | 2023 |
|---|---|---|---|---|---|---|
| Other Pet Food | 163.3 | 164.4 | 171.8 | 173.3 | 146.8 | 146.8 |
| Bird Food | 30.5 | 31.0 | 32.3 | 31.9 | 26.9 | 26.9 |
| Fish Food | 61.4 | 60.5 | 63.4 | 63.1 | 52.4 | 51.8 |
| Small Mammal/Reptile Food | 71.4 | 72.8 | 76.1 | 78.3 | 67.4 | 68.2 |
|
Source: Euromonitor International, 2024 *CAGR: compound annual growth rate |
||||||
| Category | Annual growth % 2022-2023 | CAGR* % 2018-2023 | Total growth % 2018-2023 |
|---|---|---|---|
| Other Pet Food | 0.0 | −2.1 | −10.1 |
| Bird Food | 0.0 | −2.5 | −11.8 |
| Fish Food | −1.1 | −3.3 | −15.6 |
| Small Mammal/Reptile Food | 1.2 | −0.9 | −4.5 |
|
Source: Euromonitor International, 2024 *CAGR: compound annual growth rate |
|||
| Category | 2023 | 2024 | 2025 | 2026 | 2027 | 2028 |
|---|---|---|---|---|---|---|
| Other Pet Food | 146.8 | 152.1 | 160.5 | 167.9 | 174.2 | 176.9 |
| Bird Food | 26.9 | 27.9 | 29.4 | 30.8 | 32.0 | 32.5 |
| Fish Food | 51.8 | 53.2 | 55.8 | 58.0 | 59.8 | 60.5 |
| Small Mammal/Reptile Food | 68.2 | 71.0 | 75.2 | 79.1 | 82.4 | 83.9 |
|
Source: Euromonitor International, 2024 *CAGR: compound annual growth rate |
||||||
| Category | Annual growth % 2023-2024 | CAGR* % 2023-2028 | Total growth % 2023-2028 |
|---|---|---|---|
| Other Pet Food | 3.6 | 3.8 | 20.5 |
| Bird Food | 3.7 | 3.9 | 20.8 |
| Fish Food | 2.7 | 3.2 | 16.8 |
| Small Mammal/Reptile Food | 4.1 | 4.2 | 23.0 |
|
Source: Euromonitor International, 2024 *CAGR: compound annual growth rate |
|||
Company shares
Inaba Foods Co Ltd, Mars Inc and Unicharm Corp clearly dominate the cat food sector, representing 56.2% of the market share in 2022, ahead of other competitors. However, Mars Inc had a negative CAGR of −4.5% from 2018 to 2022. Pet Line Corp gained the highest CAGR with 11.3% over the past five years.
Inaba Pet Food maintained its leadership in Japan's cat food market, with a strong presence in cat treats, particularly the Ciao Churu brand. The purée format treats, constituting over 70% of total cat treat sales, are packaged in small sachets, promoting intimate feeding moments and fostering communication between owners and pets. Inaba's active innovation and expansion, including the introduction of functional treats, like the AIM line to prevent kidney disease, contributed to double-digit value growth in 2022. AIM's potential to increase cats' life expectancy from 15 to 30 years has attracted considerable attention, solidifying Inaba's success (Euromonitor International, 2023).
| Company name | 2018 | 2019 | 2020 | 2021 | 2022 | CAGR* % 2018-2022 |
|---|---|---|---|---|---|---|
| Inaba Pet Food Co Ltd | 16.3 | 18.0 | 19.8 | 22.3 | 23.1 | 9.1 |
| Mars Inc | 21.4 | 21.2 | 20.3 | 18.0 | 17.8 | −4.5 |
| Unicharm Corp | 12.4 | 12.9 | 13.8 | 14.9 | 15.3 | 5.4 |
| Nestlé SA | 13.7 | 13.6 | 13.6 | 13.9 | 13.7 | 0.0 |
| Pet Line Corp | 5.4 | 5.3 | 9.2 | 8.4 | 8.3 | 11.3 |
| Maruha Nichiro Holdings Inc | 6.5 | 6.5 | 6.5 | 6.9 | 6.5 | 0.0 |
| Nippon Pet Food Ltd | 5.5 | 5.5 | 5.4 | 5.3 | 5.5 | 0.0 |
| Colgate-Palmolive Co | 6.4 | 6.3 | 5.8 | 5.3 | 5.1 | −5.5 |
| Smack Co Ltd | 1.1 | 1.1 | 1.1 | 0.9 | 0.8 | −7.7 |
| DoggyMan HA Co Ltd | 0.2 | 0.2 | 0.2 | 0.2 | 0.2 | 0.0 |
| Private Label | 1.4 | 1.3 | 1.2 | 1.1 | 1.0 | −8.1 |
| Others | 9.7 | 8.1 | 3.1 | 2.8 | 2.7 | −27.4 |
|
Source: Euromonitor International, 2024 *CAGR: compound annual growth rate |
||||||
Mars Inc, Colgate-Palmolive Co and DoggyMan HA Co Ltd dominate the dog food sector, accounting for 50.4% of the market share in 2022. In particular, Inaba Pet Food Co Ltd had a high CAGR of 44.7% from 2018 to 2022.
| Company Name | 2018 | 2019 | 2020 | 2021 | 2022 | CAGR* % 2018-2022 |
|---|---|---|---|---|---|---|
| Mars Inc | 24.7 | 25.3 | 25.2 | 25.0 | 24.5 | −0.2 |
| Colgate-Palmolive Co | 14.6 | 14.9 | 14.9 | 15.0 | 14.7 | 0.2 |
| DoggyMan HA Co Ltd | 11.1 | 11.0 | 11.2 | 11.6 | 11.2 | 0.2 |
| Unicharm Corp | 9.9 | 10.1 | 10.1 | 10.1 | 10.4 | 1.2 |
| Inaba Pet Food Co Ltd | 1.3 | 2.6 | 3.6 | 4.9 | 5.7 | 44.7 |
| Marukan Co Ltd | 5.9 | 5.8 | 5.4 | 5.4 | 5.6 | −1.3 |
| Yamahisa Pet Co Ltd | 4.7 | 4.6 | 4.3 | 4.3 | 4.6 | −0.5 |
| Iris Ohyama Co Ltd | 3.0 | 3.0 | 2.9 | 2.8 | 2.7 | −2.6 |
| Nippon Pet Food Ltd | 2.9 | 2.8 | 2.9 | 2.8 | 2.7 | −1.8 |
| DBF Petfood Co Ltd | 2.1 | 2.1 | 2.2 | 2.2 | 2.3 | 2.3 |
| Private Label | 1.7 | 1.6 | 1.5 | 1.5 | 1.5 | −3.1 |
| Others | 18.1 | 16.2 | 15.8 | 14.4 | 14.1 | −6.1 |
|
Source: Euromonitor International, 2024 *CAGR: compound annual growth rate |
||||||
Kamihata Fish Ind Ltd, Marukan Co Ltd and Yeaster Co Ltd dominate the other pet food sector, accounting for 40.4% of the market share in 2022. In particular, Nippon Pet Food Ltd had a high CAGR of 54.3% from 2018 to 2022.
| Company Name | 2018 | 2019 | 2020 | 2021 | 2022 | CAGR* % 2018-2022 |
|---|---|---|---|---|---|---|
| Kamihata Fish Ind Ltd | 20.3 | 20.0 | 20.5 | 20.5 | 20.1 | −0.2 |
| Marukan Co Ltd | 10.5 | 10.6 | 10.6 | 12.4 | 12.5 | 4.5 |
| Yeaster Co Ltd | 9.1 | 9.2 | 9.2 | 7.5 | 7.8 | −3.8 |
| Spectrum Brands Holdings Inc | 5.6 | 5.4 | 5.2 | 5.0 | 4.7 | −4.3 |
| Natural Foods Co Ltd | 3.6 | 3.7 | 3.7 | 3.7 | 3.8 | 1.4 |
| Itosui Co Ltd | 3.0 | 2.9 | 2.9 | 2.9 | 3.7 | 5.4 |
| Pets Ishibashi Co Ltd | 4.2 | 4.3 | 4.2 | 4.0 | 3.6 | −3.8 |
| Nippon Pet Food Ltd | 0.6 | 0.6 | 0.6 | 3.7 | 3.4 | 54.3 |
| Gex Corp | 3.6 | 3.5 | 3.5 | 3.3 | 3.2 | −2.9 |
| Kurose Pet Food Co Ltd | 0.7 | 0.7 | 0.7 | 0.7 | 0.8 | 3.4 |
| Private Label | 0.8 | 0.7 | 0.7 | 0.7 | 0.7 | −3.3 |
| Others | 38.0 | 38.4 | 38.2 | 35.6 | 35.7 | −1.5 |
|
Source: Euromonitor International, 2024 *CAGR: compound annual growth rate |
||||||
Brand shares
Ciao by Inaba Foods Co Ltd is the top brand in cat food (23.1% share in 2022), followed by Gin No Spoon by Unicharm Corp (11.6% share) and Royal Canin by Mars Inc (8.4% share). Ciao saw the biggest CAGR of 9.1% from 2018 to 2022.
| Brand Name | Company name | 2018 | 2019 | 2020 | 2021 | 2022 | CAGR* % 2018-2022 |
|---|---|---|---|---|---|---|---|
| Ciao | Inaba Pet Food Co Ltd | 16.3 | 18.0 | 19.8 | 22.3 | 23.1 | 9.1 |
| Gin No Spoon | Unicharm Corp | 9.0 | 9.8 | 10.3 | 11.0 | 11.6 | 6.6 |
| Royal Canin | Mars Inc | 9.0 | 9.3 | 8.8 | 8.5 | 8.4 | −1.7 |
| Mon Petit | Nestlé SA | 7.6 | 7.7 | 7.8 | 8.4 | 7.4 | −0.7 |
| ONE | Nestlé SA | 4.0 | 4.0 | 3.8 | 4.0 | 4.5 | 3.0 |
| Kal Kan | Mars Inc | 6.6 | 6.4 | 6.1 | 4.6 | 4.4 | −9.6 |
| Sheba | Mars Inc | 4.6 | 4.4 | 4.3 | 3.9 | 4.1 | −2.8 |
| Combo | Nippon Pet Food Ltd | 3.5 | 3.6 | 3.6 | 3.6 | 3.7 | 1.4 |
| Canet | Pet Line Corp | 4.5 | 4.4 | 4.2 | 3.8 | 3.7 | −4.8 |
| Hill's Science Diet | Colgate-Palmolive Co | 4.0 | 3.9 | 3.6 | 3.2 | 3.0 | −6.9 |
| Private label | Private Label | 1.4 | 1.3 | 1.2 | 1.1 | 1.0 | −8.1 |
| Others | Others | 29.5 | 27.2 | 26.5 | 25.6 | 25.1 | −4.0 |
|
Source: Euromonitor International, 2024 *CAGR: compound annual growth rate |
|||||||
Royal Canin by Mars Inc leads the brand in dog food (11.5% share in 2022), followed by Hill's Science Diet by Colgate-Palmolive Co (8.9% share) and Hill's Prescription Diet by Colgate-Palmolive Co (5.8% share). Inaba saw the biggest CAGR of 44.7% from 2018 to 2022.
With increased bonds formed during home seclusion, pet owners now better understand their dogs' needs. Specialist dog food brands, like Nestlé's Pro Plan and Unicharm Corp's Grand Deli, tailored for various pet types, life stages, and health functions, have shown strong double-digit value growth in 2022 (Euromonitor International, 2023).
| Brand Name | Company name | 2018 | 2019 | 2020 | 2021 | 2022 | CAGR* % 2018-2022 |
|---|---|---|---|---|---|---|---|
| Royal Canin | Mars Inc | 10.3 | 11.0 | 11.1 | 11.4 | 11.5 | 2.8 |
| Hill's Science Diet | Colgate-Palmolive Co | 9.3 | 9.3 | 9.3 | 9.3 | 8.9 | −1.1 |
| Hill's Prescription Diet | Colgate-Palmolive Co | 5.4 | 5.6 | 5.6 | 5.8 | 5.8 | 1.8 |
| Inaba | Inaba Pet Food Co Ltd | 1.3 | 2.6 | 3.6 | 4.9 | 5.7 | 44.7 |
| Grand Deli | Unicharm Corp | 4.2 | 4.5 | 4.8 | 5.0 | 5.4 | 6.5 |
| Petio | Yamahisa Pet Co Ltd | 4.7 | 4.6 | 4.3 | 4.3 | 4.6 | −0.5 |
| Gonta | Marukan Co Ltd | 4.6 | 4.5 | 4.2 | 4.2 | 4.4 | −1.1 |
| Nutro | Mars Inc | 3.4 | 3.5 | 3.5 | 3.5 | 3.5 | 0.7 |
| Aiken Genki | Unicharm Corp | 4.2 | 3.9 | 3.6 | 3.3 | 3.2 | −6.6 |
| Iris | Iris Ohyama Co Ltd | 3.0 | 3.0 | 2.9 | 2.8 | 2.7 | −2.6 |
| Private label | Private Label | 1.7 | 1.6 | 1.5 | 1.5 | 1.5 | −3.1 |
|
Source: Euromonitor International, 2024 *CAGR: compound annual growth rate |
|||||||
Hikari by Kamihata Fish Ind Ltd leads the brand in other pet food (20.1% share in 2022), followed by Marukan by Marukan Co Ltd (12.5% share) and Yeaster by Yeaster Co Ltd (7.8% share). Comet saw the biggest CAGR of 5.4% from 2018 to 2022.
| Brand Name | Company name | 2018 | 2019 | 2020 | 2021 | 2022 | CAGR* % 2018-2022 |
|---|---|---|---|---|---|---|---|
| Hikari | Kamihata Fish Ind Ltd | 20.3 | 20.0 | 20.5 | 20.5 | 20.1 | −0.2 |
| Marukan | Marukan Co Ltd | 10.5 | 10.6 | 10.6 | 12.4 | 12.5 | 4.5 |
| Yeaster | Yeaster Co Ltd | 9.1 | 9.2 | 9.2 | 7.5 | 7.8 | −3.8 |
| Tetra | Spectrum Brands Holdings Inc | 5.6 | 5.4 | 5.2 | 5.0 | 4.7 | −4.3 |
| Natural Foods | Natural Foods Co Ltd | 3.6 | 3.7 | 3.7 | 3.7 | 3.8 | 1.4 |
| Comet | Itosui Co Ltd | 3.0 | 2.9 | 2.9 | 2.9 | 3.7 | 5.4 |
| Pets Ishibashi | Pets Ishibashi Co Ltd | 4.2 | 4.3 | 4.2 | 4.0 | 3.6 | −3.8 |
| GEX | Gex Corp | 3.6 | 3.5 | 3.5 | 3.3 | 3.2 | −2.9 |
| Nippai | Nippon Pet Food Ltd | 3.1 | 2.8 | N/A | |||
| Kurose | Kurose Pet Food Co Ltd | 0.7 | 0.7 | 0.7 | 0.7 | 0.8 | 3.4 |
| Private label | Private Label | 0.8 | 0.7 | 0.7 | 0.7 | 0.7 | −3.3 |
| Others | Others | 34.5 | 34.9 | 34.6 | 35.6 | 35.9 | 1.0 |
|
Source: Euromonitor International, 2024 *CAGR: compound annual growth rate N/A: Not available |
|||||||
Distribution channels
Pet food retail sales in Japan were distributed primarily through retail offline channels (70.9% market share representation), while the remaining pet food retail sales were distributed via retail e-commerce and veterinary clinics (29.1% market share representation) in 2023. Most distribution channels' market share representation declined in varying CAGRs between 2019 to 2023. In contrast, retail e-commerce increased by the largest CAGR (6.6%) in all channels, from a 17.9% market share recorded in 2019.
| Outlet | 2019 | 2020 | 2021 | 2022 | 2023 | CAGR* % 2019-2023 |
|---|---|---|---|---|---|---|
| Retail Channels | 93.3 | 93.5 | 93.7 | 93.9 | 94.0 | 0.2 |
| Retail Offline | 75.4 | 74.0 | 72.8 | 71.9 | 70.9 | −1.5 |
| Grocery Retailers | 22.9 | 22.0 | 22.2 | 22.3 | 22.5 | −0.4 |
| Convenience Retail | 1.4 | 1.2 | 1.2 | 1.2 | 1.2 | −3.8 |
| Hypermarkets | 4.9 | 4.7 | 4.6 | 4.6 | 4.6 | −1.6 |
| Supermarkets | 16.0 | 15.7 | 16.0 | 16.1 | 16.3 | 0.5 |
| Small Local Grocers | 0.5 | 0.5 | 0.4 | 0.4 | 0.4 | −5.4 |
| Non-Grocery Retailers | 52.5 | 51.9 | 50.6 | 49.6 | 48.4 | −2.0 |
| Home Products Specialists | 41.8 | 40.7 | 39.0 | 37.5 | 36.0 | −3.7 |
| Home Improvement and Gardening Stores | 32.9 | 32.3 | 30.7 | 29.5 | 28.2 | −3.8 |
| Pet Shops and Superstores | 8.9 | 8.5 | 8.3 | 8.0 | 7.9 | −2.9 |
| Health and Beauty Specialists | 10.7 | 11.2 | 11.6 | 12.0 | 12.4 | 3.8 |
| Retail E-Commerce | 17.9 | 19.6 | 20.9 | 22.0 | 23.1 | 6.6 |
| Non-retail channels | 6.7 | 6.5 | 6.3 | 6.1 | 6.0 | −2.7 |
| Veterinary clinics | 6.7 | 6.5 | 6.3 | 6.1 | 6.0 | −2.7 |
| Total | 100.0 | 100.0 | 100.0 | 100.0 | 100.0 | 0.0 |
|
Source: Euromonitor International, 2024 *CAGR: compound annual growth rate |
||||||
Product launch analysis
From 2019 to 2023, a total of 1,890 pet food products were launched in Japan. The number of yearly product launches has declined by a CAGR of 6.0% from the larger launch of 438 pet products in 2019 to its lowest and most recent launch of 261 pet products in 2023. Cat food wet, cat food dry, and dog food dry were the top categories of newly released pet food product launches, while no additives/preservatives, free from added/artificial colourings, and functional pet - digestion were the top claims associated with new pet food products released during the prescribed period.
| Product attributes | Yearly launch count | ||||
|---|---|---|---|---|---|
| 2019 | 2020 | 2021 | 2022 | 2023 | |
| Yearly product launches | 438 | 461 | 388 | 342 | 261 |
| Top five categories | |||||
| Cat food wet | 116 | 159 | 87 | 77 | 43 |
| Cat food dry | 51 | 61 | 83 | 97 | 72 |
| Dog food dry | 138 | 57 | 27 | 54 | 58 |
| Dog snacks & treats | 48 | 67 | 94 | 25 | 32 |
| Cat snacks & treats | 48 | 88 | 64 | 39 | 20 |
| Top five claims | |||||
| No additives/preservatives | 158 | 156 | 123 | 149 | 94 |
| Free from added/artificial colourings | 149 | 153 | 115 | 145 | 95 |
| Functional pet - digestion | 152 | 128 | 114 | 137 | 117 |
| Vitamin/mineral fortified | 156 | 116 | 91 | 83 | 69 |
| Pet - adult | 170 | 101 | 49 | 87 | 66 |
| Top five price groups (US dollars) | |||||
| 0.43-7.42 | 332 | 345 | 320 | 266 | 201 |
| 7.43-14.42 | 55 | 71 | 38 | 45 | 35 |
| 14.43-21.42 | 34 | 29 | 19 | 21 | 21 |
| 21.43-28.42 | 13 | 8 | 11 | 10 | 4 |
| 28.43-38.00 | 1 | 7 | 0 | 0 | 0 |
| Top five launch types | |||||
| New product | 107 | 145 | 159 | 113 | 70 |
| New variety/range extension | 127 | 160 | 113 | 108 | 81 |
| Relaunch | 168 | 119 | 94 | 81 | 94 |
| New packaging | 36 | 37 | 22 | 38 | 16 |
| New formulation | 0 | 0 | 0 | 2 | 0 |
| Top five flavours (including blend) | |||||
| Chicken | 95 | 77 | 56 | 54 | 36 |
| Tuna | 33 | 47 | 45 | 36 | 27 |
| Bonito | 10 | 23 | 51 | 17 | 26 |
| Tuna & bonito | 21 | 37 | 18 | 17 | 13 |
| Unflavoured/plain | 42 | 10 | 5 | 8 | 34 |
| Top five ingredients | |||||
| Vitamin E | 302 | 325 | 309 | 306 | 207 |
| Food Acids | 331 | 276 | 239 | 301 | 195 |
| Minerals | 304 | 249 | 197 | 267 | 184 |
| Vitamins | 294 | 207 | 154 | 217 | 157 |
| Thickeners | 193 | 307 | 228 | 173 | 119 |
| Source: Mintel, 2024 | |||||
Product examples
Bonito Cat Food

Source: Mintel Global New Products Database, 2024
| Company | Inaba Petfood |
|---|---|
| Brand | Ciao for AIM Crunky |
| Category | Cat food dry |
| Store name | Yodobashi Online Store |
| Store type | Internet / mail order |
| Date published | December 2023 |
| Launch type | New product |
| Price in US dollars | 6.80 |
Ciao for AIM Crunky Bonito Cat Food is now available and retails in a 560 gram pack with four 140 gram packets. - Formulated with amino acid S18 that supports kidney function - Designed for a long, healthy life of the cat - Features fish extract, containing DHA and EPA, for healthy skin and coat - Prevents kidney stones with reduced mineral contents - Contains Ajinomoto's Amino A&G that supports healthy digestion - Minimizes hairball formation with dietary fibre cellulose - Has fermented plant extracts that increase good bacteria in the gut - Formulated with green tea extract that absorbs odours and deodorises the cat's urine and excretions - Comes with tasty, crunchy kibble infused with fish extract and coated with bonito flake powder - Free from colourings - Complete cat food - Patented - Feeding instructions - Launched in Winter 2023, open-priced
Kidney Care Fish & Chicken Cat Food for Japanese Cats From 11 Years and Up with Aged Bonito
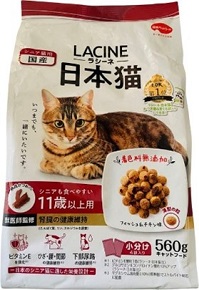
Source: Mintel Global New Products Database, 2024
| Company | Nippon Pet Food |
|---|---|
| Brand | Nippon Pet Food Lacine |
| Category | Cat food dry |
| Store name | Petemo |
| Store type | Specialist retailer |
| Date published | November 2023 |
| Launch type | New variety / range extension |
| Price in US dollars | 6.46 |
Nippon Pet Food Lacine Kidney Care Fish & Chicken Cat Food for Japanese Cats From 11 Years and Up with Aged Bonito is now available and retails in a 560 gram pack containing four 140 gram units. - Complete cat food for senior cats - Number one brand in the dry cat food category according to the magazine Cat DK - Easy-to-eat thin kibbles - Supervised by vets and Healthy Food Science Laboratory in Shizuoka, which specialises in pet food - Helps maintain healthy kidneys with the amended formulation of protein, phosphorus and calcium - Free from artificial colouring - Enriched with vitamin E - Contains three times the vitamin E, 10% more glucosamine and chondroitin, and 5% less fat compared to Japanese Cat Food from the brand - Contains glucosamine and chondroitin for healthy knees, back and joints - Contains only 0.10% magnesium for a healthy lower urinary tract - Nutritionally designed for senior Japanese cats - Contains beta-glucan for healthy immune system - Topped with tender aged bonito - Packed with the umami of aged bonito - Crunchy, tasty and healthy kibbles - A taste loved by Japanese cats - Feeding instructions - Pack is partly printed with botanical ink. - Launched on September 1, 2023, recommended retail price unavailable - Logos and certifications: QR code
Tuna & Bonito Jelly Cat Food with Whitebait & Crab Stick
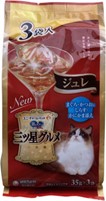
Source: Mintel Global New Products Database, 2024
| Company | Unicharm |
|---|---|
| Brand | Unicharm Pet Gin No Spoon Mitsuboshi Gourmet |
| Category | Cat food wet |
| Location of manufacture | Thailand |
| Import status | Imported product |
| Store name | Your Petia |
| Store type | Specialist retailer |
| Date published | December 2023 |
| Launch type | New packaging |
| Price in US dollars | 2.19 |
Unicharm Pet Gin No Spoon Mitsuboshi Gourmet Tuna & Bonito Jelly Cat Food with Whitebait & Crab Stick has been repackaged and retails in a pack with three 35 gram packets. - With toppings - Luxurious, tasty, and aromatic - Feeding instructions - Easy-to-open packets - Launched on September 4, 2023, open-priced
Digestive Care Cat Food for Adult Cats
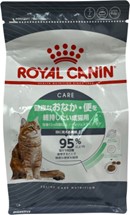
Source: Mintel Global New Products Database, 2024
| Company | Royal Canin |
|---|---|
| Brand | Royal Canin Feline Care Nutrition |
| Category | Cat food dry |
| Market | Japan |
| Location of manufacture | France |
| Import status | Imported product |
| Store name | Yahoo |
| Store type | Internet / mail order |
| Date published | November 2023 |
| Launch type | New variety / range extension |
| Price in US dollars | 8.58 |
Royal Canin Feline Care Nutrition Digestive Care Cat Food for Adult Cats is now available and retails in a 400 gram pack. It is also available in a 2 kilogram pack for 5,254 yen and a 4 kilogram pack for 9,347 yen. - Sufficient for seven days - Provides 207 kcal per 53 g - Suitable for cats from 12 months - With clinically proven results, improving over 95% healthy stool quality in 10 days - Gives a precisely balanced nutrition that helps support optimal digestive health - Contains antioxidants from natural origin - Free from artificial flavours and colours - Features highly digestible proteins L.I.P, prebiotics FOS, and a blend of fibres, including psyllium, to promote optimal stool quality - Has an optimal level of minerals for urinary health - Complete cat food for adult cats - Feeding instructions - Easy-to-open fresh pack is packed in a protective atmosphere to preserve the taste, freshness and nutrition - Launched on October 3, 2023, with a recommended retail price of 1,280 yen
Dental Care Chicken Breast & Cheese Dog Treat Assortment
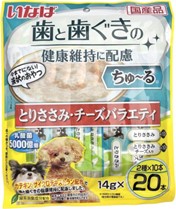
Source: Mintel Global New Products Database, 2024
| Company | Inaba Foods |
|---|---|
| Brand | Inaba Tulle |
| Category | Dog snacks and treats |
| Store name | Yodobashi Online Store |
| Store type | Internet / mail order |
| Date published | December 2023 |
| Launch type | New variety / range extension |
| Price in US dollars | 7.50 |
Inaba Tulle Dental Care Chicken Breast & Cheese Dog Treat Assortment is now available and retails in a twenty 14 gram pack with packets, containing ten 14 gram packets of Dental Care Chicken Breast Dog Treat, ten 14 gram packets of Dental Care Chicken Breast & Cheese Dog Treat. - Liquid dog treats - Contains 500 billion lactic acid bacteria for the digestive system - Features catechin and cyclodextrin for the teeth and gums - Formulated with green tea extract that absorbs odours and deodorises the dog's urine and excretions - Has six times as much catechin as the Inaba Tulle chicken breast dog food - Launched in Winter 2023, open-priced
Chicken Flavour Dog Food for Junior to Adult Shiba Inu
Source: Mintel Global New Products Database, 2024
| Company | Yeaster |
|---|---|
| Brand | Yeaster Nihonken |
| Category | Dog food dry |
| Market | Japan |
| Store name | Rakuten |
| Store type | Internet / mail order |
| Date published | December 2023 |
| Launch type | Relaunch |
| Price in US dollars | 8.56 |
Yeaster Nihonken Chicken Flavour Dog Food for Junior to Adult Shiba Inu has been relaunched and retails in a 2 kilogram pack. - Complete dog food for junior to adult shiba inu dogs - Luxurious, packed with the umami of chicken - Granules contain three layers made with chicken - Hard outer layer made with chicken liver powder - Inner layer made with chicken fat - Aromatic core made with chicken powder - Free from synthetic preservatives and colourings - Designed for the health, delicate skin and coat of shiba inu dogs - Formulated with DHA and EPA from refined fish oil, chamomile, linoleic acid and gamma-linolenic acid from Oenothera oil, vitamins A, vitamin B complex, vitamin C, vitamin E, inositol and choline - Helps maintain the skin barrier - Contains lactic acid bacteria and oligosaccharides for digestion - Contains zeolite to minimise the odour of dog feces - Feeding instructions - Resealable pack - Launched on September 01, 2023, recommended retail price not available - Logos and certifications: QR code
Jelly Dog Food for Senior Dogs

Source: Mintel Global New Products Database, 2024
| Company | Mars |
|---|---|
| Brand | Nutro Supremo |
| Category | Dog food wet |
| Location of manufacture | Thailand |
| Import status | Imported product |
| Store name | Pet Forest |
| Store type | Specialist Retailer |
| Date published | October 2023 |
| Launch type | New variety / range extension |
| Price in US dollars | 0.98 |
Nutro Supremo Jelly Dog Food for Senior Dogs is now available and retails in a 35 gram pack. - Made with over 10 types of selected natural ingredients - Dog food in jelly - Easy to eat - Provides 18 kcal - Nutritional and tasty dog food - Features synthetic vitamins, minerals, and amino acids - Formulated with antioxidants for senior dogs - Made using highly digestible ingredients and Meat First chicken - Contains omega 6 fatty acids and zinc for healthy skin and coat - Can be served with Nutro Supremo range dry dog food - Feeding instructions - Launched on August 23, 2023, with an recommended retail price of 146 yen
Extra Small Puppy Dog Food
Source: Mintel Global New Products Database, 2024
| Company | Royal Canin |
|---|---|
| Brand | Royal Canin |
| Category | Dog food dry |
| Location of manufacture | South Korea |
| Import status | Imported product |
| Store name | My Royal Canin |
| Store type | Internet / mail order |
| Date published | May 2023 |
| Launch type | Relaunch |
| Price in US dollars | 16.15 |
Royal Canin Extra Small Puppy Dog Food has been relaunched under a new brand name, having been previously known under Royal Canin Size Health Nutrition, and retails in an 800 gram pack. - Sufficient for 11 days - Complete dog food developed by vets - Suitable for extra-small puppies between 2 and 10 months old that will weigh up to 4 kilograms when fully grown - Supports the immune system - Helps contribute to brain development - With scientifically proven antioxidants from ingredients of natural-origin - Stage three - Free from artificial flavours or colours - Contains antioxidants vitamins E and C for immunity and omega 3 unsaturated fatty acid DHA to support brain development and learning during early training - Features prebiotics, including mannan oligosaccharides, and highly digestible protein to help digestive health and restore the natural balance of bacteria in the gut - Provides a high level of energy needed for the healthy growth of dogs - Comes with kibble specially designed for extra-small puppies - Pack bears a feeding guide and is designed to preserve taste, freshness and nutrition, with an easy-to-open zip - Launched in Spring 2023, with an recommended retail price of 2,167 yen - Logos and certifications: QR code
For more information
The Canadian Trade Commissioner Service:
International Trade Commissioners can provide Canadian industry with on-the-ground expertise regarding market potential, current conditions and local business contacts, and are an excellent point of contact for export advice.
More agri-food market intelligence:
International agri-food market intelligence
Discover global agriculture and food opportunities, the complete library of Global Analysis reports, market trends and forecasts, and information on Canada's free trade agreements.
Agri-food market intelligence service
Canadian agri-food and seafood businesses can take advantage of a customized service of reports and analysis, and join our email subscription service to have the latest reports delivered directly to their inbox.
More on Canada's agriculture and agri-food sectors:
Canada's agriculture sectors
Information on the agriculture industry by sector. Data on international markets. Initiatives to support awareness of the industry in Canada. How the department engages with the industry.
For additional information on the upcoming FOODEX Japan 2024, please contact:
Ben Berry, Deputy Director
Trade Show Strategy and Delivery
Agriculture and agri-food Canada
ben.berry@agr.gc.ca
Resources
- Global Trade Tracker, 2024
- Euromonitor International, 2024
- Euromonitor International 2023, Cat Food in Japan
- Euromonitor International 2023, Dog Food in Japan
- Euromonitor International 2023, Other Pet Food in Japan
- Mintel Global New Products Database, 2024
- Mintel 2023, A year of innovation in pet food and products, 2023
Sector Trend Analysis – Pet food in Japan
Global Analysis Report
Prepared by: Zhiduo Wang, Market Analyst
© His Majesty the King in Right of Canada, represented by the Minister of Agriculture and Agri-Food (2024).
Photo credits
All photographs reproduced in this publication are used by permission of the rights holders.
All images, unless otherwise noted, are copyright His Majesty the King in Right of Canada.
To join our distribution list or to suggest additional report topics or markets, please contact:
Agriculture and Agri-Food Canada, Global Analysis1341 Baseline Rd, Tower 5, 3rd floor
Ottawa ON K1A 0C5
Canada
Email: aafc.mas-sam.aac@agr.gc.ca
The Government of Canada has prepared this report based on primary and secondary sources of information. Although every effort has been made to ensure that the information is accurate, Agriculture and Agri-Food Canada (AAFC) assumes no liability for any actions taken based on the information contained herein.
Reproduction or redistribution of this document, in whole or in part, must include acknowledgement of agriculture and agri-food Canada as the owner of the copyright in the document, through a reference citing AAFC, the title of the document and the year. Where the reproduction or redistribution includes data from this document, it must also include an acknowledgement of the specific data source(s), as noted in this document.
Agriculture and Agri-Food Canada provides this document and other report services to agriculture and food industry clients free of charge.