

Note: This report includes forecasting data that is based on baseline historical data.
Executive summary
In 2022, Singapore attained a total population of 5.4 million and a gross income per capita of US$42,088. According to Euromonitor International, the country will maintain one of the highest per capita income levels in the Asia Pacific region, despite anticipated slower income growth from 2022 to 2027.
In 2023, Singapore imported US$1.4 billion of meat products from global markets (+5.6% in annual growth from US$1.0 billion in 2018) and exported US$146.1 million, recording a trade deficit of US$1.2 billion.
Canada was Singapore's sixteenth largest value supplier of meat products providing US$8.1 million (0.6% market share), 2.5 million kg in 2023, representing a measurable increase in annual growth (9.7%) from US$5.1 million, 1.7 million kg in 2018.
Top meat imports from Canada included frozen pork, bone in, valued at US$3.7 million (46.2% market share), followed by fresh or chilled pork, bone in with values of US$2.1 million (25.8% market share), and pig fat, fresh, chilled or frozen, with values of US$1.6 million (19.9% market share), in 2023.
Singapore's per capita fresh and processed meat retail sales was equivalent to US$214.8 in 2023 (+7.7% from US$148.1 in 2018), with fresh meat attaining the majority of retail sales (US$187.0) or an 87.1% market share, in comparison to processed meat sales of US$27.8 in 2023.
In terms of fresh meat retail sales, pork was Singapore's largest with retail sales of US$533.2 million (50.0% market share), followed by poultry with retail sales of US$306.9 million (28.8% market share) in 2023.
Retail sales of processed meat in Singapore was valued at US$158.3 million in 2023. During the 2018 to 2023 period, this market grew at a CAGR of 6.4% from US$116.2 million in 2018 (+12.4% from 2019 to 2020), as processed meat was purchased for home cooking primarily for its convenience in food and meal preparation.
The Singaporean consumer
In 2022, Singapore attained a total population of 5.4 million and a gross income per capita of US$42,088. According to Euromonitor International, the country will maintain one of the highest per capita income levels in the Asia Pacific region, despite anticipated slower income growth from 2022 to 2027.
Consumers aged 45 to 49 years old are forecast to remain the highest average income earners in 2027, as this particular age cohort is better educated, finding employment in high-paying industries such as IT and financial services. Those aged 65+ however, will be prevalent in the top income band (with annual gross income over US$250,000) as this cohort has garnered experience and participation within the labour force, and generally greater accumulated wealth levels, combined with multiple income sources, including pensions and investment incomes (Euromonitor International: Income and Expenditure). By 2040, millennials who will be aged 46-60 years old, are poised to strengthen their status as the most influential consumer segment in Singapore due to their sizeable population and rising disposable incomes (Euromonitor International: Singapore Consumer Profile).
Discretionary buying power in Singapore is set to increase over the long term, despite recent and conserved consumer spending patterns, prompted by increasing inflation in 2022. In response, the Singaporean government has recently (October 2022) issued a SGD1.5 billion support package, which among other measures included GDT Voucher, Household Utilities Credit and a special cost-of-living cash payment of up to SGD500 for 2.5 million Singaporeans to assist and alleviate some of the economic constraints experienced by the consumer. Similarly, many food and grocery retailers have offered discounts and support measures to assist more vulnerable consumers groups in Singapore (Euromonitor International: Singapore Consumer Profile).
Euromonitor International's Voice of the Consumer found that respondents are reviewing their spending intentions and priorities as rising prices, driven by higher inflation and interest rates, place pressure on household budgets. For example, only 33.0% of respondents said they intended to increase their overall spending over the next 12 months, with 37.0% hoping to save more. For those consumers intent on spending, higher quality and branded items are the preference as 30.0% of consumers report they would rather buy fewer, high-quality items while 57.0% will only buy from those companies and brands they trust, especially for the Generation Z and Millennial cohorts (Euromonitor International: Singapore Consumer Profile).
Global trade overview
The global market for meat has experienced positive value growth and increased at a CAGR of 3.9% as imports have increased from US$144.2 billion, 46.4 billion kg in 2018 to US$174.3 billion, 52.3 billion kg in 2023. In 2023, China was the largest market for meat with imports valued at US$26.9 billion (15.4% market share), experiencing the largest increase in value growth (19.4%) of the top markets, from US$11.1 billion reported in 2018, followed by the United States with meat imports of US$13.9 billion (8.0% market share) and Japan, with imports valued at US$13.1 billion (7.5% market share) in 2023.
Singapore was the twenty-ninth largest market for meat in the world with imports valued at US$1.4 billion (0.8% market share), 407.3 million kg in 2023, representing a moderate increase in CAGR of 5.6% from US$1.0 billion, 386.0 million kg in 2018. Canada in comparison, was the eleventh largest market with meat imports of US$3.6 billion (2.0% market share), 694.1 million kg in 2023, registering an increase in CAGR of 5.1% from meat imports of US$2.8 billion, 622.1 million kg in 2018.
| Country | 2018 | 2019 | 2020 | 2021 | 2022 | 2023 | CAGR* % 2018-2023 |
|---|---|---|---|---|---|---|---|
| Global total | 144,232.8 | 153,353.3 | 155,212.6 | 172,702.3 | 187,589.9 | 174,288.5 | 3.9 |
| China | 11,095.2 | 18,888.9 | 30,332.2 | 31,636.3 | 30,906.1 | 26,879.1 | 19.4 |
| United States | 9,411.4 | 9,836.3 | 10,543.8 | 13,397.8 | 14,568.8 | 13,996.9 | 8.3 |
| Japan | 13,781.1 | 14,198.5 | 13,488.4 | 14,194.2 | 14,700.1 | 13,100.3 | −1.0 |
| Germany | 9,789.5 | 9,355.1 | 8,776.0 | 9,191.1 | 10,035.4 | 10,485.2 | 1.4 |
| United Kingdom | 8,982.5 | 8,465.3 | 7,966.3 | 7,867.5 | 9,597.7 | 10,203.1 | 2.6 |
| France | 6,184.4 | 6,017.3 | 5,661.6 | 6,806.5 | 8,040.2 | 8,711.7 | 7.1 |
| Netherlands | 6,122.5 | 5,906.0 | 5,549.0 | 6,148.5 | 7,460.2 | 7,325.4 | 3.7 |
| Korea | 5,354.1 | 5,499.9 | 5,212.6 | 6,300.7 | 7,645.7 | 6,920.0 | 5.3 |
| Italy | 5,466.1 | 5,553.7 | 5,032.5 | 5,354.4 | 6,201.9 | 6,684.8 | 4.1 (2018-November 2023) |
| Mexico | 4,181.1 | 4,551.2 | 3,836.6 | 5,577.5 | 6,307.9 | 6,074.0 | 7.8 (2018-November 2023) |
| Canada (11) | 2,770.6 | 2,684.4 | 2,934.6 | 3,270.8 | 3,621.4 | 3,553.9 | 5.1 |
| Singapore (29) | 1,031.6 | 1,023.9 | 1,160.3 | 1,227.8 | 1,422.3 | 1,353.7 | 5.6 |
|
Source: Global trade tracker, 2024 1: defined by HS codes 02 (meat and edible meat offal), 1602 (prepared or preserved meat, offal or blood) and 1601 (sausages and similar products, of meat, offal or blood) *CAGR: Compound Annual Growth Rate |
|||||||
| Country | 2018 | 2019 | 2020 | 2021 | 2022 | 2023 | CAGR* % 2018-2023 |
|---|---|---|---|---|---|---|---|
| Global total | 46,413.4 | 50,033.7 | 49,622.2 | 51,183.4 | 49,859.0 | 52,256.5 | 2.4 |
| Egypt | 101.0 | 90.6 | 936.5 | 525.6 | 614.5 | 7,604.6 | 137.3 (2018-November 2023) |
| China | 4,098.3 | 6,052.9 | 9,765.9 | 9,217.7 | 7,218.8 | 7,235.9 | 12.0 |
| Japan | 3,055.5 | 3,088.7 | 2,921.8 | 2,962.1 | 3,063.7 | 2,915.0 | −0.9 |
| Mexico | 2,421.9 | 3,841.6 | 2,328.7 | 2,656.6 | 2,685.4 | 2,624.9 | 1.6 (2018-November 2023) |
| Germany | 2,791.6 | 2,733.6 | 2,515.1 | 2,467.8 | 2,458.7 | 2,362.0 | −3.3 |
| United States | 1,833.9 | 1,811.0 | 1,899.8 | 2,102.4 | 2,258.3 | 2,187.5 | 3.6 |
| United Kingdom | 2,371.5 | 2,249.8 | 2,052.5 | 1,918.8 | 2,158.8 | 2,154.6 | −1.9 |
| Netherlands | 1,850.4 | 1,939.6 | 1,858.7 | 1,987.6 | 2,188.5 | 2,112.9 | 2.7 |
| France | 1,538.5 | 1,519.4 | 1,414.3 | 1,605.0 | 1,748.1 | 1,721.0 | 2.3 |
| Italy | 1,680.3 | 1,617.1 | 1,493.8 | 1,612.6 | 1,649.5 | 1,547.3 | −1.6 (2018-November 2023) |
| Canada (18) | 622.1 | 616.8 | 689.5 | 652.0 | 644.8 | 694.1 | 2.2 |
| Singapore (27) | 386.0 | 331.2 | 371.2 | 357.7 | 407.7 | 407.3 | 1.1 |
|
Source: Global trade tracker, 2024 1: defined by HS codes 02 (meat and edible meat offal), 1602 (prepared or preserved meat, offal or blood) and 1601 (sausages and similar products, of meat, offal or blood) *CAGR: Compound Annual Growth Rate |
|||||||
Singapore's trade summary
Singapore is a small city-state with nominal resources (as only 1.0% of land is available for food production), necessitating the importation of over 90.0% of the country's food requirements, essential to meeting consumption demand (Singapore Food Statistics 2021). Relatedly, the country's meat and livestock production industry is limited, comprised mainly of processed meats that use raw imported meats to produce sausages, deli meats and dim sum products for export to the region and for domestic consumption (Trade Commissioner Service; Singapore).
In 2023, Singapore imported US$1.4 billion of meat products from global markets (+5.6% in annual growth from US$1.0 billion in 2018) and exported US$146.1 million, recording a trade deficit of US$1.2 billion.
The top three suppliers of meat products to Singapore were Brazil with values of US$522.2 million (38.6% market share), 218.1 million kg, followed by Australia with values of US$233.5 million (17.2% market share), 44.2 million kg and Thailand with values of US$149.5 million (11.0% market share), 31.4 million kg.
Canada in comparison, was Singapore's sixteenth largest value supplier of meat products providing US$8.1 million (0.6% market share), 2.5 million kg in 2023, representing a measurable increase in annual growth (9.7%) from US$5.1 million, 1.7 million kg in 2018. Of note, Thailand and Germany experienced the largest increases in annual value growth (12.3% and 28.1% respectively) from 2018 to 2023, while Japan also grew 11.0% annually, increasing their product supply from US$17.1 million to US$28.7 million during the same period.
| Country | 2018 | 2019 | 2020 | 2021 | 2022 | 2023 | CAGR* % 2018-2023 | Market share % in 2023 |
|---|---|---|---|---|---|---|---|---|
| Global supplier | 1,031.6 | 1,023.9 | 1,160.3 | 1,227.8 | 1,422.3 | 1,353.7 | 5.6 | 100.0 |
| Brazil | 363.6 | 374.6 | 453.1 | 467.0 | 613.9 | 522.2 | 7.5 | 38.6 |
| Australia | 213.3 | 194.4 | 218.2 | 256.2 | 212.9 | 233.5 | 1.8 | 17.2 |
| Thailand | 83.6 | 92.6 | 102.8 | 114.3 | 142.5 | 149.5 | 12.3 | 11.0 |
| United States | 78.3 | 87.7 | 83.0 | 84.5 | 100.2 | 92.2 | 3.3 | 6.8 |
| Malaysia | 38.6 | 33.8 | 33.9 | 36.9 | 49.5 | 44.2 | 2.8 | 3.3 |
| Germany | 12.6 | 15.9 | 19.3 | 36.7 | 44.1 | 43.4 | 28.1 | 3.2 |
| China | 36.7 | 30.1 | 40.0 | 30.9 | 34.1 | 39.8 | 1.6 | 2.9 |
| New Zealand | 30.1 | 25.8 | 28.6 | 31.9 | 37.0 | 36.1 | 3.7 | 2.7 |
| Spain | 26.1 | 34.2 | 37.7 | 32.8 | 32.4 | 34.8 | 5.9 | 2.6 |
| Japan | 17.1 | 19.6 | 21.7 | 30.6 | 32.4 | 28.7 | 11.0 | 2.1 |
| Canada (16) | 5.1 | 6.4 | 8.6 | 7.8 | 8.4 | 8.1 | 9.7 | 0.6 |
|
Source: Global trade tracker, 2024 *CAGR: Compound Annual Growth Rate |
||||||||
| Country | 2018 | 2019 | 2020 | 2021 | 2022 | 2023 | CAGR* % 2018-2023 | Market share % in 2023 |
|---|---|---|---|---|---|---|---|---|
| Global supplier | 386.0 | 331.2 | 371.2 | 357.7 | 407.7 | 407.3 | 1.1 | 100.0 |
| Brazil | 161.0 | 161.3 | 194.3 | 188.0 | 232.2 | 218.1 | 6.3 | 53.5 |
| Australia | 90.8 | 36.1 | 36.4 | 40.8 | 30.1 | 44.2 | −13.4 | 10.9 |
| Thailand | 18.3 | 20.1 | 23.4 | 28.2 | 30.6 | 31.4 | 11.4 | 7.7 |
| United States | 33.0 | 36.6 | 38.1 | 25.5 | 27.9 | 29.9 | −2.0 | 7.3 |
| Germany | 4.7 | 5.6 | 5.0 | 10.9 | 14.2 | 11.7 | 19.9 | 2.9 |
| China | 8.6 | 7.8 | 10.1 | 7.3 | 7.9 | 10.9 | 4.8 | 2.7 |
| Malaysia | 9.9 | 8.8 | 9.5 | 8.9 | 11.7 | 9.8 | −0.1 | 2.4 |
| Spain | 7.5 | 9.6 | 8.6 | 6.8 | 6.4 | 7.5 | 0.1 | 1.8 |
| Denmark | 6.2 | 5.6 | 5.5 | 5.9 | 5.3 | 6.1 | −0.3 | 1.5 |
| Netherlands | 16.3 | 11.8 | 10.0 | 6.4 | 4.5 | 5.7 | −19.1 | 1.4 |
| Canada (15) | 1.7 | 2.7 | 2.9 | 2.5 | 2.8 | 2.5 | 8.2 | 0.6 |
|
Source: Global trade tracker, 2024 *CAGR: Compound Annual Growth Rate |
||||||||
Singapore's top imported meat products were frozen cuts and edible offal of fowls (HS code 020714) valued at US$273.5 million (20.2% market share), 142.1 million kg, supplied primarily by Brazil (providing an 80.1% market share), followed by frozen pork, bone in (HS code 020329) valued at US$267.2 million (19.7% market share), 85.4 million kg, supplied mainly by Brazil and Germany and meat or offal of fowls, prepared or preserved (HS code 160232) valued at US$150.3 million (11.1% market share), 29.5 million kg, supplied mainly by Thailand (providing a 82.3% market share) in 2023.
| HS Code | Description | Import value (US$) | Import volume (kg) | Top suppliers and market value share % | Canada's value share % | ||
|---|---|---|---|---|---|---|---|
| 1 | 2 | 3 | |||||
| Meat total | 1,353,732,992 | 407,292,755 | Brazil: 38.6 | Australia: 17.2 | Thailand: 11.0 | 1.0 | |
| 020714 | Frozen cuts and edible offal of fowls | 273,535,487 | 142,125,000 | Brazil: 80.1 | United States: 9.3 | Thailand: 4.5 | |
| 020329 | Frozen meat of pork, (bone in) | 267,241,651 | 85,358,000 | Brazil: 60.3 | Germany: 13.4 | Spain: 9.2 | 1.4 |
| 160232 | Meat or offal of fowls, prepared or preserved | 150,294,370 | 29,476,243 | Thailand: 82.3 | Malaysia: 11.0 | China: 4.6 | |
| 020230 | Frozen, boneless beef | 149,584,159 | 30,612,000 | Brazil: 53.4 | United States: 22.3 | India: 8.9 | 0.1 |
| 020130 | Fresh or chilled beef, boneless | 101,947,060 | 5,651,000 | Australia: 51.0 | New Zealand: 18.0 | Japan: 16.4 | 0.0 |
| 020311 | Fresh or chilled pork, (carcasses and half-carcasses) | 67,040,843 | 14,395,000 | Australia: 99.9 | United States: 0.1 | ||
| 020712 | Frozen fowls, not cut in pieces | 54,867,500 | 31,525,000 | Brazil: 70.5 | Thailand: 10.4 | Poland: 5.6 | |
| 160250 | Prepared or preserved meat or offal of beef | 33,123,651 | 4,451,308 | Malaysia: 57.8 | Australia: 32.0 | Brazil: 6.9 | |
| 160249 | Prepared or preserved meat and offal of pork | 27,860,654 | 6,100,687 | China: 81.4 | United States: 7.3 | Korea: 3.2 | 1.0 |
| 020442 | Frozen cuts of sheep, with bone in | 27,151,411 | 5,880,000 | Australia: 77.8 | New Zealand: 18.7 | Ireland: 1.7 | |
| Source: Global Trade Tracker, 2024 | |||||||
Singapore's meat product imports from Canada
Singapore was the twenty-ninth largest global market for meat products with imports of US$ 1.4 billion (0.8% market share), 407.3 million kg in 2022. Of these imports, Canada was the sixteenth largest supplier to Singapore (representing a 0.6% market share) with imports valued at US$8.1 million (+9.7% from US$5.1 million in 2018), 2.5 million kg in 2023.
Top meat imports from Canada included frozen pork, bone in (HS code: 020329) valued at US$3.7 million (46.2% market share), 1.4 million kg, followed by fresh or chilled pork, bone in (HS code 020319) with values of US$2.1 million (25.8% market share), 203,000 kg and pig fat, fresh, chilled or frozen (HS code: 020910) with values of US$1.6 million (19.9% market share), 789,00 kg in 2023.
| HS Code | Description | Import value (US$) | Import volume (kg) | Market value share % |
|---|---|---|---|---|
| Meat total | 8,085,089 | 2,477,736 | 100.0 | |
| 020329 | Frozen meat of pork (bone in) | 3,731,676 | 1,353,000 | 46.2 |
| 020319 | Fresh or chilled pork (bone in) | 2,084,794 | 203,000 | 25.8 |
| 020910 | Pig fat fresh, chilled, frozen, salted, in brine, dried or smoked | 1,610,456 | 789,000 | 19.9 |
| 160249 | Prepared or preserved meat and offal of pork | 227,369 | 20,636 | 2.8 |
| 020630 | Fresh or chilled edible offal (pork) | 136,098 | 12,000 | 1.7 |
| 020230 | Frozen, boneless beef | 117,990 | 23,000 | 1.5 |
| 020322 | Frozen hams, bone in | 104,823 | 50,000 | 1.3 |
| 020649 | Edible offal of pork, frozen | 59,933 | 26,000 | 0.7 |
| 020312 | Fresh or chilled hams, with bone in | 9,772 | 1,000 | 0.1 |
| 160100 | Sausages and similar products, of meat, meat offal, blood or insects | 1,236 | 100 | 0.0 |
| Source: Global Trade Tracker, 2024 | ||||
| Category | 2018 | 2019 | 2020 | 2021 | 2022 | 2023 | CAGR* % 2018-2022 |
|---|---|---|---|---|---|---|---|
| Singapore's meat imports from the World | 1,031.6 | 1,023.9 | 1,160.3 | 1,227.8 | 1,422.3 | 1,353.7 | 5.6 |
| Singapore's meat imports from Canada | 5.1 | 6.4 | 8.6 | 7.8 | 8.4 | 8.1 | 9.7 |
| Supply gap | 1,026.5 | 1,017.5 | 1,151.7 | 1,220.0 | 1,413.9 | 1,345.6 | 5.6 |
|
Source: Global Trade Tracker, 2024 *CAGR: Compound Annual Growth Rate |
|||||||
Canada's performance
Canada's export market
Canada, unlike Singapore, is a net exporter of meat products. In 2023, Canada enjoyed a meat product trade surplus of US$4.2 billion with imports of US$3.6 billion, and exports valued at US$7.8 billion (+7.1% from exports of US$5.5 billion in 2018). Of interest, Canada was the eighth largest (after Germany and Poland) global exporter of meat products in 2023.
Top export markets for Canadian meat products in 2023 were the United States (62.4% market share), followed by Japan (12.0% market share) and Mexico (6.8% market share). Singapore in comparison, was Canada's twenty-sixth largest export market for meat products with values of US$6.0 million (0.1% market share) in 2023, representing an increase in annual growth of 6.9% from US$4.3 million in 2018.
Canada's top three meat products exported to Singapore were frozen pork, bone in (HS code: 020329) with values of US$3.1 million (51.9% market share), followed by fresh or chilled pork, bone in (HS code: 020319) with values of US$1.5 million (25.1% market share) and frozen hams, bone in (HS code: 020322) with values of US$0.5 million (7.9% market share) in 2023, increasing 22.9% in annual growth from US$0.2 million supplied in 2018. In contrast, fresh or chilled boneless beef (HS code: 020130) experienced the largest decline in annual growth (48.0%) as Canadian exports decreased from US$17,113 in 2018 to US$651 in 2023.
| HS Code | Description | 2018 | 2019 | 2020 | 2021 | 2022 | 2023 | CAGR* % 2018-2023 | Market share % in 2023 |
|---|---|---|---|---|---|---|---|---|---|
| Meat total | 4.3 | 5.9 | 7.8 | 6.5 | 5.6 | 6.0 | 6.9 | 100.0 | |
| 020329 | Frozen meat of pork (bone in) | 2.3 | 3.2 | 3.8 | 2.9 | 1.9 | 3.1 | 6.3 | 51.9 |
| 020319 | Fresh or chilled pork (bone in) | 1.3 | 1.5 | 1.8 | 2.0 | 1.7 | 1.5 | 2.7 | 25.1 |
| 020322 | Frozen hams, with bone in | 0.2 | 0.2 | 1.1 | 0.6 | 0.6 | 0.5 | 22.9 | 7.9 |
| 020910 | Pig fat, fresh, chilled, frozen, salted, in brine, dried or smoked | 0.2 | 0.1 | 0.3 | 0.5 | 0.3 | 5.6 (2019-2023) | 5.1 | |
| 020649 | Edible offal of pork, frozen | 0.1 | 0.3 | 0.2 | 0.2 | 0.1 | 0.2 | 15.4 | 3.7 |
| 020312 | Fresh or chilled hams, with bone in | 0.1 | 0.1 | 0.2 | 0.2 | 0.2 | 0.1 | 5.1 | 2.5 |
| 020230 | Frozen, boneless beef | 0.1 | N/C | 1.9 | |||||
| 020630 | Fresh or chilled edible offal (pork) | 0.0 | 0.1 | 0.1 | 0.1 | 0.0 | 0.1 | 21.4 | 1.2 |
| 021019 | Pork, salted, in brine, dried or smoked | 0.2 | 0.1 | 0.0 | −26.4 (2019-2023) | 0.8 | |||
| 020130 | Fresh or chilled beef, boneless | 0.0 | 0.0 | 0.0 | −48.0 | 0.0 | |||
|
Source: Global trade tracker, 2024 *CAGR: Compound Annual Growth Rate N/C: not calculable |
|||||||||
British Columbia (B.C) was predominant in supplying meat products to Singapore, occupying a 43.7% market share, followed by Québec with a 32.1% market share and Alberta, representing an 8.6% market share in 2023.
Canada's largest meat export to Singapore was frozen pork, bone in (HS code: 020329), supplied mainly by Québec and B.C, providing 47.0% and 39.7% respectively, while fresh or chilled pork, bone in as the second largest meat export segment, was provided by B.C and Alberta, occupying a combined market share of 98.5% in 2023.
| HS Code | Description | Export value (US$) | Export volume (kg) | Top provincial suppliers and market value share % | ||
|---|---|---|---|---|---|---|
| Meat total | 5,980,967 | 2,561,262 | British Columbia: 43.7 | Quebec: 32.1 | Alberta: 8.6 | |
| 020329 | Frozen meat of pork (bone in) | 3,105,800 | 1,260,840 | Quebec: 47.0 | British Columbia: 39.7 | Manitoba: 10.2 |
| 020319 | Fresh or chilled pork (bone in) | 1,503,162 | 369,492 | British Columbia: 84.3 | Alberta: 14.2 | Ontario: 1.0 |
| 020322 | Frozen hams, with bone in | 472,278 | 435,383 | Ontario: 37.0 | Quebec: 28.1 | Manitoba: 27.0 |
| 020910 | Pig fat, fresh, chilled, frozen, salted, in brine, dried or smoked | 303,659 | 262,160 | Quebec: 67.2 | Ontario: 23.1 | Manitoba: 9.6 |
| 020649 | Edible offal of pork, frozen | 220,024 | 103,563 | Quebec: 63.6 | Ontario: 36.4 | |
| 020312 | Fresh or chilled hams, with bone in | 146,897 | 48,955 | Alberta: 78.1 | British Columbia: 16.7 | Ontario: 5.2 |
| 020230 | Frozen, boneless beef | 113,832 | 23,475 | Alberta: 100.0 | ||
| 020630 | Fresh or chilled edible offal (pork) | 69,488 | 31,798 | Alberta: 93.8 | Ontario: 6.3 | |
| 021019 | Pork, salted, in brine, dried or smoked | 44,962 | 25,500 | British Columbia: 100.0 | ||
| 020130 | Fresh or chilled beef, boneless | 651 | 77 | Alberta: 100.0 | ||
| Source: Global trade tracker, 2024 | ||||||
Market size
Singapore's per capita fresh and processed meat retail sales was equivalent to US$214.8 in 2023 (+7.7% from US$148.1 in 2018), with fresh meat attaining the majority of retail sales (US$187.0) or an 87.1% market share, in comparison to processed meat sales of US$27.8 in 2023.
In the fresh meat category, per capita pork sales were the largest with US$93.5 (50.0% market share) in 2023, increasing 6.3% from US$69.0 in 2018, while the beef and veal segment experienced significant growth (17.5%) as per capita sales grew from US$12.1 to US$27.1 from 2018 to 2023. In the processed meat category, per capita frozen processed meat retail sales were US$18.8 (67.6% market share) in 2023, increasing moderately by 7.2% from US$13.3 in 2018.
In the forecast period, Singaporean per capita fresh and processed meat retail sales will remain positive, albeit at lower rates, with the exception of the poultry segment, which is expected to decline in growth by 3.5% as per capita retail sales decrease from US$53.8 in 2023 to US$45.1 by 2028.
| Category | 2018 | 2023 | CAGR* % 2018-2023 | 2024 | 2028 | CAGR* % 2023-2028 | Market share % in 2023 |
|---|---|---|---|---|---|---|---|
| Fresh meat (total) | 127.5 | 187.0 | 8.0 | 182.4 | 191.7 | 0.5 | 100.0 |
| Beef and veal | 12.1 | 27.1 | 17.5 | 27.5 | 35.6 | 5.6 | 14.5 |
| Lamb, mutton and goat | 7.8 | 11.0 | 7.1 | 10.7 | 11.6 | 1.1 | 5.9 |
| Pork | 69.0 | 93.5 | 6.3 | 92.7 | 97.8 | 0.9 | 50.0 |
| Poultry | 37.3 | 53.8 | 7.6 | 49.9 | 45.1 | −3.5 | 28.8 |
| Other meat | 1.3 | 1.5 | 2.9 | 1.5 | 1.6 | 1.3 | 0.8 |
| Processed meat (total) | 20.6 | 27.8 | 6.2 | 29.3 | 34.1 | 4.2 | 100.0 |
| Shelf stable meat | 1.4 | 1.7 | 4.0 | 1.8 | 1.9 | 2.2 | 6.1 |
| Chilled processed meat | 5.9 | 7.3 | 4.4 | 7.6 | 8.7 | 3.6 | 26.3 |
| Frozen processed meat | 13.3 | 18.8 | 7.2 | 19.9 | 23.5 | 4.6 | 67.6 |
|
Source: Euromonitor International, 2024 *CAGR: Compound Annual Growth Rate |
|||||||
In comparison, Canada's per capita fresh and processed meat retail sales were greater than that of the Singaporean consumer, with total values of US$428.4 in 2023 (+3.2% from US$366.0 in 2018), with fresh meat also attaining the majority of retail sales (US$317.0) or an 74.0% market share, in relation to processed meat sales of US$111.4 in 2023.
In the fresh meat category, per capita meat retail sales were the highest within the pork and poultry segments representing a combined market share of 69.5%, while per capita retail sales in the chilled processed meat segment was greater than both frozen and shelf-stable meat, with values of US$96.8 (86.9% market share) in 2023.
In the forecast period, Canadian per capita retail sales of fresh and processed meats will remain positive, with lower rates, with the exception of the beef and veal segment, which is expected to decline slightly in growth by 0.6% as per capita retail sales decrease from US$93.5 in 2023 to US$90.6 by 2028.
| Category | 2018 | 2023 | CAGR* % 2018-2023 | 2024 | 2028 | CAGR* % 2023-2028 | Market share % in 2023 |
|---|---|---|---|---|---|---|---|
| Fresh meat (total) | 270.4 | 317.0 | 3.2 | 323.0 | 356.5 | 2.4 | 100.0 |
| Beef and veal | 88.3 | 93.5 | 1.2 | 91.2 | 90.6 | −0.6 | 29.5 |
| Lamb, mutton and goat | 2.2 | 2.6 | 3.4 | 2.7 | 2.9 | 2.2 | 0.8 |
| Pork | 92.6 | 114.8 | 4.4 | 119.4 | 133.4 | 3.0 | 36.2 |
| Poultry | 86.7 | 105.7 | 4.0 | 109.2 | 129.1 | 4.1 | 33.3 |
| Other meat | 0.5 | 0.5 | 0.0 | 0.5 | 0.5 | 0.0 | 0.2 |
| Processed meat total) | 95.6 | 111.4 | 3.1 | 112.0 | 122.8 | 2.0 | 100.0 |
| Shelf stable meat | 1.7 | 1.8 | 1.1 | 1.7 | 1.8 | 0.0 | 1.6 |
| Chilled processed meat | 83.0 | 96.8 | 3.1 | 97.4 | 106.9 | 2.0 | 86.9 |
| Frozen processed meat | 10.9 | 12.9 | 3.4 | 12.9 | 14.0 | 1.7 | 11.6 |
|
Source: Euromonitor International, 2024 *CAGR: Compound Annual Growth Rate |
|||||||
Retail sales of fresh meat
Global retail sales of fresh meat
Global retail sales of fresh meat (fresh, raw, uncooked and unprocessed meat [beef and veal, lamb, mutton and goat, pork, poultry and other meat] whether packaged or unpackaged, chilled or frozen) have increased 7.9% in CAGR from US$638.5 billion in 2018 to US$934.5 billion in 2023 and are expected to increase in CAGR by an additional 6.6% as retail sales attain US$1.3 trillion by 2028.
China was the largest global market with retail sales of US$212.4 billion (22.7% market share), followed by the United States (U.S) with retail sales of US$108.9 billion (11.6% market share) and Brazil with retail sales of US$88.0 billion (9.4% market share) in 2023. Of interest, Türkiye experienced the largest increase in CAGR, as the country's retail sales of fresh meat grew 31.6% from US$6.9 billion in 2018 to US$27.3 billion in 2023 and is forecast to increase in annual growth by 23.0% to reach US$76.7 billion by 2028.
Singapore was the fifty-third largest global retail sales market for fresh meat, after Hong Kong and Slovakia, with retail sales of US$1,065.7 million (0.1% market share) in 2023. The country has experienced a moderate increase in CAGR of 8.2% from retail sales of US$719.0 million in 2018, and is expected to grow an additional 1.1% in the forecast period to US$1,123.3 million by 202.8 In comparison, Canada was the sixteenth largest retail sales market for fresh meat, accounting for a 1.3% retail sale market share with values of US$12.6 billion in 2023. Similarly, Canada is also expected to achieve positive growth with an increase in CAGR of 3.2% as retail sales are anticipated to increase to US$14.7 billion by 2028.
| Country | 2018 | 2023 | CAGR* % 2018-2023 | 2024 | 2028 | CAGR* % 2023-2028 |
|---|---|---|---|---|---|---|
| Global retail sales of fresh meat (total) | 638,542.7 | 934,464.6 | 7.9 | 992,350.5 | 1,288,011.7 | 6.6 |
| China | 133,578.2 | 212,393.5 | 9.7 | 216,728.6 | 248,062.1 | 3.2 |
| United States | 77,624.7 | 108,855.6 | 7.0 | 113,978.1 | 135,133.8 | 4.4 |
| Brazil | 47,045.2 | 88,026.0 | 13.3 | 97,933.4 | 139,678.0 | 9.7 |
| India | 28,973.2 | 36,196.5 | 4.6 | 39,280.4 | 52,123.3 | 7.6 |
| Japan | 32,817.8 | 35,981.8 | 1.9 | 36,993.2 | 40,466.2 | 2.4 |
| Italy | 25,779.4 | 32,588.1 | 4.8 | 34,104.0 | 38,475.4 | 3.4 |
| France | 24,551.7 | 32,076.5 | 5.5 | 33,573.9 | 36,793.4 | 2.8 |
| Mexico | 20,221.6 | 31,590.5 | 9.3 | 34,078.4 | 45,238.1 | 7.4 |
| Germany | 26,329.4 | 31,579.2 | 3.7 | 30,232.7 | 32,008.3 | 0.3 |
| Türkiye | 6,905.8 | 27,272.5 | 31.6 | 36,857.3 | 76,711.6 | 23.0 |
| Canada (16) | 10,021.6 | 12,557.1 | 4.6 | 12,936.0 | 14,729.2 | 3.2 |
| Singapore (53) | 719.0 | 1,065.7 | 8.2 | 1,046.0 | 1,123.3 | 1.1 |
|
Source: Euromonitor International, 2024 1: Fresh meat - the aggregation of beef and veal, lamb, mutton and goat, pork, poultry and other meat. Only includes fresh, raw, uncooked and unprocessed meat whether packaged or unpackaged, chilled or frozen. *CAGR: Compound Annual Growth Rate |
||||||
Association of Southeast Asian Nations retail sales of fresh meat
Association of Southeast Asian Nations (ASEAN) retail sales of fresh meat have increased 7.9% annually from US$27.0 billion in 2018 to US$39.6 billion in 2023 and are expected to increase a further 4.7% as retail sales attain US$49.8 billion by 2028.
Vietnam was the largest ASEAN market for fresh meat with retail sales of US$13.7 billion (34.7% market share), followed by the Philippines with retail sales of US$8.4 billion (21.2% market share) and Indonesia with retail sales of US$7.1 billion (17.9% market share) in 2023 (+13.1% from US$3.8 billion in 2018). Singapore in comparison, represented a 2.7% market share of fresh meat retail sales in 2023.
| Country | 2018 | 2023 | CAGR* % 2018-2023 | 2024 | 2028 | CAGR* % 2023-2028 |
|---|---|---|---|---|---|---|
| ASEAN retail sales of fresh meat (total) | 27,045.6 | 39,599.7 | 7.9 | 40,422.2 | 49,769.3 | 4.7 |
| Indonesia | 3,830.4 | 7,084.3 | 13.1 | 6,898.0 | 7,814.4 | 2.0 |
| Malaysia | 2,247.0 | 3,521.8 | 9.4 | 3,344.3 | 3,465.4 | −0.3 |
| Philippines | 5,069.8 | 8,401.8 | 10.6 | 8,218.7 | 9,136.5 | 1.7 |
| Singapore | 719.0 | 1,065.7 | 8.2 | 1,046.0 | 1,123.3 | 1.1 |
| Thailand | 4,582.9 | 5,789.1 | 4.8 | 6,264.7 | 8,070.5 | 6.9 |
| Vietnam | 10,596.5 | 13,737.0 | 5.3 | 14,650.5 | 20,159.2 | 8.0 |
|
Source: Euromonitor International, 2024 1: countries include the Philippines, Malaysia, Singapore, Indonesia, Thailand, Brunei Darussalam, Lao, Cambodia Myanmar and Vietnam (fresh meat data available only for listed countries). *CAGR: Compound Annual Growth Rate |
||||||
Retail sales of fresh meat in Singapore
According to Euromonitor International, the growing importance of health and wellness in the Singaporean diet is evident as more consumers show a preference for fresh meat over processed options (Euromonitor International; January 2024).
In terms of fresh meat retail sales, pork was Singapore's largest with retail sales of US$533.2 million (50.0% market share), followed by poultry with retail sales of US$306.9 million (28.8% market share) in 2023. Of interest, the beef and veal experienced the largest increase in annual growth (17.8%) as retail sales increased from US$68.2 million in 2018 to US$154.6 million in 2023 (+14.9% from US$134.5 million in 2022.
| Category | 2018 | 2019 | 2020 | 2021 | 2022 | 2023 |
|---|---|---|---|---|---|---|
| Fresh meat (total) | 719.0 | 757.0 | 866.2 | 848.4 | 982.6 | 1,065.7 |
| Beef and veal | 68.2 | 77.4 | 98.7 | 102.6 | 134.5 | 154.6 |
| Lamb, mutton and goat | 44.2 | 48.6 | 57.3 | 48.6 | 58.6 | 62.5 |
| Pork | 389.1 | 377.0 | 374.6 | 442.4 | 490.9 | 533.2 |
| Poultry | 210.5 | 247.2 | 328.7 | 247.5 | 290.6 | 306.9 |
| Other meat | 7.1 | 6.9 | 7.0 | 7.2 | 8.0 | 8.5 |
| Source: Euromonitor International, 2024 | ||||||
| Category | Annual growth % 2022-2023 | CAGR* % 2018-2023 | Total growth % 2018-2023 |
|---|---|---|---|
| Fresh meat (total) | 8.5 | 8.2 | 48.2 |
| Beef and veal | 14.9 | 17.8 | 126.7 |
| Lamb, mutton and goat | 6.7 | 7.2 | 41.4 |
| Pork | 8.6 | 6.5 | 37.0 |
| Poultry | 5.6 | 7.8 | 45.8 |
| Other meat | 6.3 | 3.7 | 19.7 |
|
Source: Euromonitor International, 2024 *CAGR: Compound Annual Growth Rate |
|||
In the forecast period, the fresh meat market is expected to remain positive, albeit at a lower growth rate of 1.1% between 2023 to 2028, with the exception of poultry, which is expected to decline by 2.9% from US$306.9 million in 2023 to US$264.3 million by 2028 (−6.8% from 2023 to 2024). Of note, similar to the historic period, the beef and veal segment is anticipated to experience the greatest performance, increasing 6.2% annually from US$154.6 million in 2023 to US$208.4 million in 2028.
| Category | 2024 | 2025 | 2026 | 2027 | 2028 |
|---|---|---|---|---|---|
| Fresh meat (total) | 1,046.0 | 1,067.6 | 1,086.0 | 1,106.3 | 1,123.3 |
| Beef and veal | 157.9 | 170.5 | 183.4 | 197.4 | 208.4 |
| Lamb, mutton and goat | 61.6 | 63.6 | 65.0 | 66.5 | 68.1 |
| Pork | 531.8 | 542.3 | 551.6 | 562.1 | 572.9 |
| Poultry | 286.0 | 282.2 | 276.8 | 270.8 | 264.3 |
| Other meat | 8.6 | 9.0 | 9.2 | 9.4 | 9.6 |
| Source: Euromonitor International, 2024 | |||||
| Category | Annual growth % 2023-2024 | CAGR* % 2023-2028 | Total growth % 2023-2028 |
|---|---|---|---|
| Fresh meat (total) | −1.8 | 1.1 | 5.4 |
| Beef and veal | 2.1 | 6.2 | 34.8 |
| Lamb, mutton and goat | −1.4 | 1.7 | 9.0 |
| Pork | −0.3 | 1.4 | 7.4 |
| Poultry | −6.8 | −2.9 | −13.9 |
| Other meat | 1.2 | 2.5 | 12.9 |
|
Source: Euromonitor International, 2024 *CAGR: Compound Annual Growth Rate |
|||
Volume sales of fresh meat in Singapore
Total volume sales (retail, foodservice and institutional) of fresh meat in Singapore was equivalent to 462.3 thousand tonnes in 2023. Poultry was the largest segment of fresh meat with volume sales of 233.9 thousand tonnes (50.6% market share), followed by pork with volume sales of 176.5 thousand tonnes (38.2% market share) and beef and veal with volume sales of 31.1 thousand tonnes (6.7% market share) in 2023. Of interest, beef and veal experienced the greatest volume sales performance increasing 8.1% from 21.1 thousand tonnes in 2018, and 6.9% annually from 29.1 thousand tonnes in 2022.
| Category | 2018 | 2019 | 2020 | 2021 | 2022 | 2023 |
|---|---|---|---|---|---|---|
| Meat (total) | 409.1 | 391.3 | 414.2 | 434.6 | 452.4 | 462.3 |
| Beef and veal | 21.1 | 23.4 | 25.3 | 26.1 | 29.1 | 31.1 |
| Lamb, mutton and goat | 14.6 | 15.1 | 15.1 | 14.9 | 15.6 | 15.9 |
| Pork | 169.4 | 128.5 | 137.1 | 166.2 | 172.5 | 176.5 |
| Poultry | 198.9 | 219.2 | 232.1 | 222.5 | 230.3 | 233.9 |
| Other Meat | 5.0 | 5.1 | 4.7 | 4.8 | 4.8 | 5.0 |
|
Source: Euromonitor International, 2024 1: Fresh meat volume sales - encompasses not only retail sales, but also fresh meat sales to foodservice and institutional (military, prisons, work/school canteens, hospitals, etc.) channels. |
||||||
| Category | Annual growth % 2022-2023 | CAGR* % 2018-2023 | Total growth % 2018-2023 |
|---|---|---|---|
| Meat (total) | 2.2 | 2.5 | 13.0 |
| Beef and veal | 6.9 | 8.1 | 47.4 |
| Lamb, mutton and goat | 1.9 | 1.7 | 8.9 |
| Pork | 2.3 | 0.8 | 4.2 |
| Poultry | 1.6 | 3.3 | 17.6 |
| Other meat | 4.2 | 0.0 | 0.0 |
|
Source: Euromonitor International, 2024 *CAGR: Compound Annual Growth Rate |
|||
In the forecast period, total volume sales of fresh meat are anticipated to increase in CAGR by 1.0% to attain 485.5 thousand tonnes by 2028. All segments of fresh meat will experience positive growth in volume sales within the Singaporean market. Beef and veal in particular, are expected to experience the largest increase in annual growth (5.0%) from 31.1 thousand tonnes in 2023 to 39.7 thousand tonnes by 2028 (+5.1% from 2023 to 2024).
| Category | 2024 | 2025 | 2026 | 2027 | 2028 |
|---|---|---|---|---|---|
| Meat (total) | 467.2 | 472.1 | 476.8 | 481.4 | 485.8 |
| Beef and veal | 32.7 | 34.5 | 36.3 | 38.1 | 39.7 |
| Lamb, mutton and goat | 16.2 | 16.4 | 16.7 | 16.9 | 17.2 |
| Pork | 177.8 | 179.0 | 180.1 | 181.5 | 182.8 |
| Poultry | 235.5 | 237.1 | 238.4 | 239.7 | 240.8 |
| Other meat | 5.0 | 5.1 | 5.3 | 5.3 | 5.4 |
| Source: Euromonitor International, 2024 | |||||
| Category | Annual growth % 2023-2024 | CAGR* % 2023-2028 | Total growth % 2023-2028 |
|---|---|---|---|
| Meat (total) | 1.1 | 1.0 | 5.1 |
| Beef and veal | 5.1 | 5.0 | 27.7 |
| Lamb, mutton and goat | 1.9 | 1.6 | 8.2 |
| Pork | 0.7 | 0.7 | 3.6 |
| Poultry | 0.7 | 0.6 | 2.9 |
| Other meat | 0.0 | 1.6 | 8.0 |
|
Source: Euromonitor International, 2024 *CAGR: Compound Annual Growth Rate |
|||
Retail sales of processed meat
Global retail sales of processed meat
Global retail sales of processed meat (shelf stable meat, chilled processed meat and frozen processed meat) have increased 7.3% in CAGR from US$141.2 billion in 2018 to US$201.2 billion in 2023 and are expected to increase in CAGR by an additional 6.0% as retail sales attain US$268.7 billion by 2028. The United States was the largest global market for processed meat with retail sales of US$46.8 billion (23.3% market share), followed by China with retail sales of US$14.8 billion (7.3% market share) and Germany with retail sales of US$13.0 billion (6.5% market share) in 2023. Russia experienced the largest increase in CAGR, as the country's retail sales grew 10.1% from US$5.7 billion in 2018 to US$9.3 billion in 2023 and is forecast to increase 7.2% annually to reach US$13.1 billion by 2028.
Retail sales of processed meat in Singapore was valued at US$158.3 million (0.1% market share) in 2023, representing a moderate increase in CAGR of 6.4% from US$116.2 million in 2018. The country is expected to continue to increase by 4.8% annually as retail sales grow to US$200.0 million by 2028. In comparison, Canada was the tenth largest retail sales market for processed meat, accounting for a 2.2% retail sales market share with values of US$4.4 billion in 2023. Similarly, Canada is also expected to increase in annual growth (2.8%) in the forecast period as retail sales reach US$5.1 billion by 2028.
| Country | 2018 | 2023 | CAGR* % 2018-2023 | 2024 | 2028 | CAGR* % 2023-2028 |
|---|---|---|---|---|---|---|
| Global retail sales of processed meat (total) | 141,229.7 | 201,216.0 | 7.3 | 212,937.5 | 268,724.4 | 6.0 |
| United States | 30,390.5 | 46,793.1 | 9.0 | 49,366.3 | 55,771.4 | 3.6 |
| China | 11,485.0 | 14,782.8 | 5.2 | 15,395.5 | 17,831.2 | 3.8 |
| Germany | 10,852.6 | 13,034.6 | 3.7 | 12,438.2 | 12,819.4 | −0.3 |
| Italy | 9,647.1 | 13,017.6 | 6.2 | 13,485.6 | 15,635.1 | 3.7 |
| France | 10,118.7 | 12,610.8 | 4.5 | 12,982.3 | 13,958.6 | 2.1 |
| Japan | 8,763.7 | 9,984.2 | 2.6 | 10,115.2 | 10,620.8 | 1.2 |
| Russia | 5,730.1 | 9,260.8 | 10.1 | 9,975.1 | 13,088.0 | 7.2 |
| United Kingdom | 6,611.9 | 8,131.4 | 4.2 | 8,400.1 | 9,483.9 | 3.1 |
| Spain | 5,385.4 | 6,362.8 | 3.4 | 6,615.7 | 7,613.2 | 3.7 |
| Canada | 3,543.5 | 4,414.3 | 4.5 | 4,485.7 | 5,072.5 | 2.8 |
| Singapore (73) | 116.2 | 158.3 | 6.4 | 167.9 | 200.0 | 4.8 |
|
Source: Euromonitor International, 2024 1: Processed meat includes shelf stable meat, chilled processed meat and frozen processed meat *CAGR: Compound Annual Growth Rate |
||||||
Association of Southeast Asian Nations retail sales of processed meat
ASEAN retail sales of processed meat have increased 10.3% annually from US$3.1 billion in 2018 to US$5.1 billion in 2023 and is expected to increase in CAGR by an additional 10.2% to reach US$8.2 billion by 2028.
The Philippines was the largest ASEAN market for processed meat with retail sales of US$2.1 billion (42.4% market share), followed by Indonesia with US$1.6 billion (31.5% market share) and Malaysia with US$434.0 million (8.6% market share) in 2023. Singapore in comparison, was the sixth largest ASEAN market for processed meat with retail sales of US$158.3 million (3.1% market share) in 2023. Of interest, Myanmar experienced the largest increase in CAGR as the country's retail sales grew 21.9% from US$28.4 million in 2018 to US$76.5 million in 2023, while Indonesia is forecast to increase 16.3% in annual growth form US$1.6 billion in 2023 to US$3.4 billion by 2028.
| Country | 2018 | 2023 | CAGR* % 2018-2023 | 2024 | 2028 | CAGR* % 2023-2028 |
|---|---|---|---|---|---|---|
| ASEAN retail sales of processed meat (total) | 3,102.6 | 5,063.4 | 10.3 | 5,586.2 | 8,219.9 | 10.2 |
| Brunei Darussalam-modelled | 20.6 | 25.1 | 4.0 | 25.7 | 28.0 | 2.2 |
| Cambodia-modelled | 9.4 | 12.7 | 6.2 | 12.7 | 14.8 | 3.1 |
| Indonesia | 961.0 | 1,595.3 | 10.7 | 1,872.4 | 3,392.6 | 16.3 |
| Laos-modelled | 2.1 | 3.8 | 12.6 | 3.7 | 3.9 | 0.5 |
| Malaysia | 351.8 | 434.0 | 4.3 | 447.0 | 537.3 | 4.4 |
| Myanmar-modelled | 28.4 | 76.5 | 21.9 | 76.3 | 102.4 | 6.0 |
| Philippines | 1,213.0 | 2,149.1 | 12.1 | 2,303.7 | 2,938.6 | 6.5 |
| Singapore | 116.2 | 158.3 | 6.4 | 167.9 | 200.0 | 4.8 |
| Thailand | 248.0 | 399.2 | 10.0 | 443.6 | 649.7 | 10.2 |
| Vietnam | 152.1 | 209.4 | 6.6 | 233.2 | 352.6 | 11.0 |
|
Source: Euromonitor International, 2024 *CAGR: Compound Annual Growth Rate |
||||||
Retail sales of processed meat in Singapore
Retail sales of processed meat in Singapore was valued at US$158.3 million in 2023. During the 2018-2023 period, this market grew at a CAGR of 6.4% from US$116.2 million in 2018 (+12.4% from 2019-2020), as processed meat was purchased for home cooking primarily for its convenience in food and meal preparation.
Frozen processed meat was the largest category of processed meat in Singapore with retail sales of US$107.3 million (67.8% market share), recording record volume growth due to the segment's wide product variety, convenient formats and extended shelf life (in comparison to chilled formats) (Euromonitor International; January 2024). Chilled processed meat was the second largest category of processed meats with retail sales of US$41.3 million (26.1% market share), followed by the shelf stable category, often perceived as the unhealthier and less appealing option to the increasingly health-conscious consumer, with lower retail sales of US$9.6 million (6.1% market share) in 2023 (Euromonitor International; January 2024). Of interest, the chilled poultry segment has recently experienced greater flavour innovation through improvements in the quality and nutritional value of their offerings, targeting health-conscious consumers who traditionally prefer fresh meat over processed. Chilled chicken breast in particular, has increased in demand as a leaner cut, white meat, perceived to be healthier than red meat, in addition to the convenience of the products ready-to-cook format.
Segment retail sales within frozen processed meat were led by poultry with values of US$101.2 million (63.9% market share) in 2023 (+7.6% in annual growth from US$70.1 million in 2018), while retail sales of frozen red meat also performed well, increasing 6.9% from US$5.8 million in 2022 to US$6.2 million in 2023. Further, in the frozen poultry segment, retail sales of sausages and nuggets were the most in demand, attaining US$40.6 million and US$36.8 million respectively, representing a combined market share of 49.0% in 2023, while the other poultry segment attained the best performance increasing 8.7% from US$10.2 million in 2018 to US$15.5 million in 2023 (+6.9% from US$14.5 million in 2022).
| Category | 2018 | 2019 | 2020 | 2021 | 2022 | 2023 |
|---|---|---|---|---|---|---|
| Processed meat (total) | 116.2 | 123.6 | 138.9 | 142.2 | 149.8 | 158.3 |
| Shelf stable meat | 8.1 | 8.1 | 8.7 | 9.1 | 9.2 | 9.6 |
| Shelf stable processed red meat | 6.7 | 6.7 | 7.3 | 7.6 | 7.7 | 8.1 |
| Shelf stable processed poultry | 1.4 | 1.4 | 1.5 | 1.5 | 1.5 | 1.5 |
| Chilled processed meat | 33.3 | 33.6 | 36.0 | 37.5 | 39.7 | 41.3 |
| Chilled processed red meat | 21.6 | 21.8 | 23.3 | 24.4 | 25.7 | 26.8 |
| Chilled processed poultry | 11.7 | 11.9 | 12.7 | 13.1 | 14.0 | 14.6 |
| Frozen processed meat | 74.8 | 81.9 | 94.1 | 95.6 | 100.9 | 107.3 |
| Frozen processed red meat | 4.7 | 4.8 | 5.3 | 5.5 | 5.8 | 6.2 |
| Frozen processed poultry | 70.1 | 77.1 | 88.8 | 90.1 | 95.1 | 101.2 |
| Sausages[1] | 28.3 | 31.1 | 35.9 | 36.3 | 38.3 | 40.6 |
| Nuggets[1] | 25.4 | 28.0 | 32.3 | 32.7 | 34.5 | 36.8 |
| Other poultry[1] | 10.2 | 11.4 | 13.3 | 13.6 | 14.5 | 15.5 |
| Chicken burgers[1] | 6.1 | 6.6 | 7.4 | 7.4 | 7.8 | 8.2 |
|
Source: Euromonitor International, 2024 1: Frozen processed poultry segment - retail sales data available from 2018 to 2023 only. |
||||||
| Category | Annual growth % 2022-2023 | CAGR* % 2018-2023 | Total growth % 2018-2023 |
|---|---|---|---|
| Processed meat (total) | 5.7 | 6.4 | 36.2 |
| Shelf stable meat | 4.3 | 3.5 | 18.5 |
| Shelf stable processed red meat | 5.2 | 3.9 | 20.9 |
| Shelf stable processed poultry | 0.0 | 1.4 | 7.1 |
| Chilled processed meat | 4.0 | 4.4 | 24.0 |
| Chilled processed red meat | 4.3 | 4.4 | 24.1 |
| Chilled processed poultry | 4.3 | 4.5 | 24.8 |
| Frozen processed meat | 6.3 | 7.5 | 43.4 |
| Frozen processed red meat | 6.9 | 5.7 | 31.9 |
| Frozen processed poultry | 6.4 | 7.6 | 44.4 |
| Sausages | 6.0 | 7.5 | 43.5 |
| Nuggets | 6.7 | 7.7 | 44.9 |
| Other poultry | 6.9 | 8.7 | 52.0 |
| Chicken burgers | 5.1 | 6.1 | 34.4 |
|
Source: Euromonitor International, 2024 *CAGR: Compound Annual Growth Rate |
|||
In the forecast period, the processed meat market is expected to remain positive, with a lower growth rate of 4.8% between 2023 to 2028. Of note, the frozen red meat segment is anticipated to experience the greatest performance, increasing 5.2% annually from US$6.2 million in 2023 to US$8.0 million by 2028, while shelf stable poultry is expected to increase 6.7% from US$1.5 million in 2023 to US$1.6 million in 2024, as manufacturers such as Ayam for example, introduced new products like Pulled Chicken (available in Hot Chilli and Mayonnaise flavours), in April 2023, expanding and diversifying their product portfolio to also include shelf stable poultry. Further, as growth in the industry is expected to continue, manufacturers in this segment have growing opportunities to provide innovative high-quality products that offer distinctive health benefits such as reduced salt or fewer additives and no preservatives, in addition to launching new flavour varieties to sustain consumer interest and address consumer health expectations (Euromonitor International; January 2024).
| Category | 2024 | 2025 | 2026 | 2027 | 2028 |
|---|---|---|---|---|---|
| Processed meat (total) | 167.9 | 176.4 | 184.0 | 191.9 | 200.0 |
| Shelf stable meat | 10.0 | 10.4 | 10.6 | 10.8 | 11.0 |
| Shelf stable processed red meat | 8.5 | 8.7 | 8.9 | 9.1 | 9.3 |
| Shelf stable processed poultry | 1.6 | 1.6 | 1.7 | 1.7 | 1.7 |
| Chilled processed meat | 43.7 | 45.7 | 47.5 | 49.3 | 51.0 |
| Chilled processed red meat | 28.2 | 29.4 | 30.4 | 31.5 | 32.5 |
| Chilled processed poultry | 15.5 | 16.3 | 17.0 | 17.8 | 18.6 |
| Frozen processed meat | 114.2 | 120.3 | 126.0 | 131.9 | 138.0 |
| Frozen processed red meat | 6.5 | 6.9 | 7.2 | 7.6 | 8.0 |
| Frozen processed poultry | 107.6 | 113.4 | 118.7 | 124.3 | 130.0 |
| Source: Euromonitor International, 2024 | |||||
| Category | Annual growth % 2023-2024 | CAGR* % 2023-2028 | Total growth % 2023-2028 |
|---|---|---|---|
| Processed meat (total) | 6.1 | 4.8 | 26.3 |
| Shelf stable meat | 4.2 | 2.8 | 14.6 |
| Shelf stable processed red meat | 4.9 | 2.8 | 14.8 |
| Shelf stable processed poultry | 6.7 | 2.5 | 13.3 |
| Chilled processed meat | 5.8 | 4.3 | 23.5 |
| Chilled processed red meat | 5.2 | 3.9 | 21.3 |
| Chilled processed poultry | 6.2 | 5.0 | 27.4 |
| Frozen processed meat | 6.4 | 5.2 | 28.6 |
| Frozen processed red meat | 4.8 | 5.2 | 29.0 |
| Frozen processed poultry | 6.3 | 5.1 | 28.5 |
|
Source: Euromonitor International, 2024 *CAGR: Compound Annual Growth Rate |
|||
Volume sales of processed meat in Singapore
Total volume sales (retail and foodservice) of processed meat in Singapore was 34.6 thousand tonnes in 2023. Of the processed meat volume sales, frozen meat was the largest category recording 26.2 thousand tonnes (75.7% market share) in 2023, (+2.6% from 23.0 thousand tonnes in 2018), with frozen poultry attaining the largest volume sales of 23.0 thousand tonnes (66.5% of processed meat market share), increasing 2.9% from 19.9 thousand tonnes in 2018. Of note, frozen red meat experienced the greatest annual increase (6.5%) as volume sales grew from 3.1 thousand tonnes in 2022 to 3.3 thousand tonnes in 2023. In contrast, the shelf stable meat category experienced the only decline in volume sales decreasing 1.2% from 3.4 thousand tonnes in 2018 to 3.2 thousand tonnes in 2023 (−3.0% from 3.3 thousand tonnes recorded in 2022).
| Category | 2018 | 2019 | 2020 | 2021 | 2022 | 2023 |
|---|---|---|---|---|---|---|
| Processed meat (total) | 31.4 | 32.9 | 31.5 | 32.5 | 33.6 | 34.6 |
| Shelf stable meat | 3.4 | 3.4 | 3.1 | 3.2 | 3.3 | 3.2 |
| Shelf stable processed red meat | 3.2 | 3.2 | 2.9 | 3.0 | 3.1 | 3.1 |
| Shelf stable processed poultry | 0.2 | 0.2 | 0.2 | 0.2 | 0.2 | 0.2 |
| Chilled processed meat | 5.0 | 5.1 | 4.8 | 4.9 | 5.0 | 5.1 |
| Chilled processed red meat | 2.8 | 2.8 | 2.7 | 2.7 | 2.8 | 2.8 |
| Chilled processed poultry | 2.2 | 2.3 | 2.2 | 2.2 | 2.2 | 2.3 |
| Frozen processed meat | 23.0 | 24.3 | 23.6 | 24.4 | 25.3 | 26.2 |
| Frozen processed red meat | 3.2 | 3.2 | 2.9 | 3.1 | 3.1 | 3.3 |
| Frozen processed poultry | 19.9 | 21.1 | 20.7 | 21.3 | 22.1 | 23.0 |
|
Source: Euromonitor International, 2024 1: Processed meat volume sales - encompasses retail and foodservice channels |
||||||
| Category | Annual growth % 2022-2023 | CAGR* % 2018-2023 | Total growth % 2018-2023 |
|---|---|---|---|
| Processed meat (total) | 3.0 | 2.0 | 10.2 |
| Shelf stable meat | −3.0 | −1.2 | −5.9 |
| Shelf stable processed red meat | 0.0 | −0.6 | −3.1 |
| Shelf stable processed poultry | 0.0 | 0.0 | 0.0 |
| Chilled processed meat | 2.0 | 0.4 | 2.0 |
| Chilled processed red meat | 0.0 | 0.0 | 0.0 |
| Chilled processed poultry | 4.5 | 0.9 | 4.5 |
| Frozen processed meat | 3.6 | 2.6 | 13.9 |
| Frozen processed red meat | 6.5 | 0.6 | 3.1 |
| Frozen processed poultry | 4.1 | 2.9 | 15.6 |
|
Source: Euromonitor International, 2024 *CAGR: Compound Annual Growth Rate |
|||
In the forecast period, total volume sales of processed meat are anticipated to increase in CAGR by 3.4% to attain 40.8 thousand tonnes by 2028. Frozen red meat in particular, is expected to experience the largest increase in annual growth (4.4%) from 3.3 thousand tonnes in 2023 to 4.1 thousand tonnes by 2028, while chilled poultry is expected to grow by 4.3% from 2.3 thousand tonnes to 2.4 thousand tonnes between 2023 to 2024.
| Category | 2024 | 2025 | 2026 | 2027 | 2028 |
|---|---|---|---|---|---|
| Processed meat (total) | 35.8 | 37.2 | 38.4 | 39.6 | 40.8 |
| Shelf stable meat | 3.3 | 3.5 | 3.6 | 3.6 | 3.7 |
| Shelf stable processed red meat | 3.1 | 3.3 | 3.4 | 3.4 | 3.5 |
| Shelf stable processed poultry | 0.2 | 0.2 | 0.2 | 0.2 | 0.2 |
| Chilled processed meat | 5.2 | 5.4 | 5.5 | 5.7 | 5.8 |
| Chilled processed red meat | 2.9 | 3.0 | 3.0 | 3.1 | 3.2 |
| Chilled processed poultry | 2.4 | 2.4 | 2.5 | 2.6 | 2.6 |
| Frozen processed meat | 27.3 | 28.3 | 29.3 | 30.3 | 31.3 |
| Frozen processed red meat | 3.4 | 3.6 | 3.7 | 3.9 | 4.1 |
| Frozen processed poultry | 23.9 | 24.7 | 25.5 | 26.4 | 27.3 |
| Source: Euromonitor International, 2024 | |||||
| Category | Annual growth % 2023-2024 | CAGR* % 2023-2028 | Total growth % 2023-2028 |
|---|---|---|---|
| Processed meat (total) | 3.5 | 3.4 | 17.9 |
| Shelf stable meat | 3.1 | 2.9 | 15.6 |
| Shelf stable processed red meat | 0.0 | 2.5 | 12.9 |
| Shelf stable processed poultry | 0.0 | 0.0 | 0.0 |
| Chilled processed meat | 2.0 | 2.6 | 13.7 |
| Chilled processed red meat | 3.6 | 2.7 | 14.3 |
| Chilled processed poultry | 4.3 | 2.5 | 13.0 |
| Frozen processed meat | 4.2 | 3.6 | 19.5 |
| Frozen processed red meat | 3.0 | 4.4 | 24.2 |
| Frozen processed poultry | 3.9 | 3.5 | 18.7 |
|
Source: Euromonitor International, 2024 *CAGR: Compound Annual Growth Rate |
|||
Competitive landscape
Singapore's processed meat market remained a highly fragmented industry in 2023. The top five processed meat companies (Charoen Pokphand Group, CS Tay Foods Pte Ltd, QAF Ltd, Johnsonville Sausage LLC and Sin Li-Hin Frozen Food Pte Ltd) represented a combined market share of 25.5% in 2023.
In terms of retail sales, Charoen Pokphand Group (Brand name: CP) was the largest processed meat company with values of US$12.0 million (7.6% market share), followed by CS Tay Foods Pte Ltd (Brand name: Tay) with retail values of US$8.9 million (5.6% market share) in 2023.
Private label companies in comparison, continue to show a measured presence in the processed meat market in Singapore with retail sales of US$7.1 million (4.5% market share) in 2023, increasing in CAGR by 11.6% from retail sales of US$4.1 million in 2018.
| Company | Brand | Retail sales (US$ millions) | Market share % |
|---|---|---|---|
| Processed meat (total) | 158.3 | 100.0 | |
| Charoen Pokphand Group | CP | 12.0 | 7.6 |
| CS Tay Foods Pte Ltd | Tay | 8.9 | 5.6 |
| QAF Ltd | Farmland | 7.3 | 4.6 |
| Johnsonville Sausage LLC | Johnsonville | 7.0 | 4.4 |
| Sin Li-Hin Frozen Food Pte Ltd | Bibik's Choice | 5.1 | 3.2 |
| Auric Pacific Group Ltd | Gourmet | 5.0 | 3.2 |
| Wang Foong Foodstuffs Suppliers Pte Ltd | Saucisse House of Gourmet | 4.3 | 2.7 |
| Country Foods Pte Ltd | Farmpride | 3.3 | 2.1 |
| BRF SA | Sadia | 2.5 | 1.6 |
| Danish Crown Amba | Tulip | 2.2 | 1.4 |
| Private Label | Private label | 7.1 | 4.5 |
| Others | Others | 84.3 | 53.3 |
| Source: Euromonitor International, 2024 | |||
Distribution channels
The majority of Singapore's processed meat, seafood and alternatives to meat is distributed through grocery retailers versus non-grocery retailers. Grocery retailers (offline) distribution of processed meat, seafood and alternatives to meat accounted for an 97.5% market share in 2023, decreasing slightly from 98.4% held in 2018, while grocery retailing (online, e-commerce), increased from US$4.4 million (1.7% market share) in 2018 to US$8.7 million (2.5% market share) in 2023. Further, within grocery retailers (offline), supermarkets were the predominant distribution channel for processed meat, seafood and alternatives to meat representing US$207.7 million (60.3% market share), while hypermarkets and small local grocers occupied an 18.7% and 18.9% market share respectively, in 2023.
| Outlet type | 2018 | 2023 | ||
|---|---|---|---|---|
| Actual | Share % | Actual | Share % | |
| Retail channels total | 262.5 | 100.0 | 352.9 | 100.0 |
| Retail Offline | 258.2 | 98.4 | 344.2 | 97.5 |
| Grocery Retailers | 258.2 | 98.4 | 344.2 | 97.5 |
| Convenience Retail | 6.3 | 2.4 | 7.1 | 2.1 |
| Convenience Stores | 6.3 | 2.4 | 7.1 | 2.1 |
| Supermarkets | 152.2 | 58.9 | 207.7 | 60.3 |
| Hypermarkets | 46.4 | 18.0 | 64.2 | 18.7 |
| Small Local Grocers | 53.4 | 20.7 | 65.2 | 18.9 |
| Retail E-Commerce | 4.4 | 1.7 | 8.7 | 2.5 |
| Source: Euromonitor International, 2024 | ||||
New product launch analysis
According to Mintel, economic uncertainty and the cost-of-living crisis has prompted many consumers to look for more affordable options when shopping for food and drink. For cost-conscious consumers, poultry is an increasingly attractive protein option owing to an average price equivalent to almost half that of red meat. Furthermore, poultry brands are further enhancing their value proposition with a growing focus on shelf-stable options, which save on the need for refrigeration, minimize the risk of food going to waste, and are a practical option for stockpiling during sales. Social media with packaging links, are increasingly relevant for establishing and promoting brand awareness (Mintel; A year of innovation in meat and poultry, Asia Pacific, 2023).
According to Mintel's Global New Products Database (GNPD), there were 1,067 new meat and meat products (food) (searched as an ingredient) launched in Singapore from January 2018 to December 2023. The number of yearly new product launches has increased in growth by a CAGR of 2.4% from a launch of 166 products in 2018, to its most recent launch of 187 products in 2023 (+11.6% from 2020 to 2021).
The predominant sub-categories of new meat and meat products released were poultry products (309 products), meat products (207 products), prepared meals (118 products), hors d'oeuvres (97 products) and meat snacks (58 products). The most popular product claims were halal (398 products), no additives/preservatives (368 products) and microwaveable with (324 products).
The companies with the highest number of new product launches were RM Food Manufacturing with (38 products), followed by NTUC Fairprice Co-Operative (34 products) and Cold Storage (26 products). Under half (41.9%) of the new product launches were new variety/range extension (447 products), whereas 39.6% were new products (422 products). Top packaging types included flexible packaging (429 products), skinpack (226 products), tray (142 products), can (82 products) and flexible stand-up pouch (66 products). Top flavours were unflavoured/plain (183 products), chicken (43 products) and pork (26 products).
| Product attributes | Number of new products by year | Total | |||||
|---|---|---|---|---|---|---|---|
| 2018 | 2019 | 2020 | 2021 | 2022 | 2023 | ||
| Yearly product launches | 166 | 157 | 173 | 193 | 191 | 187 | 1,067 |
| Top 5 sub-categories | |||||||
| Poultry products | 45 | 35 | 61 | 47 | 63 | 58 | 309 |
| Meat products | 28 | 52 | 31 | 34 | 31 | 31 | 207 |
| Prepared meals | 33 | 15 | 15 | 24 | 18 | 11 | 118 |
| Hors d'oeuvres | 5 | 10 | 17 | 18 | 15 | 32 | 97 |
| Meat snacks | 8 | 4 | 11 | 12 | 14 | 9 | 58 |
| Instant noodles | 6 | 5 | 7 | 13 | 14 | 9 | 54 |
| Wet soup | 7 | 9 | 3 | 5 | 6 | 12 | 42 |
| Fish products | 1 | 1 | 5 | 12 | 12 | 3 | 34 |
| Potato snacks | 8 | 7 | 1 | 3 | 3 | 2 | 24 |
| Meal kits | 1 | 0 | 2 | 8 | 4 | 6 | 21 |
| Top 5 claims | |||||||
| Halal | 77 | 42 | 79 | 79 | 70 | 51 | 398 |
| No additives/preservatives | 86 | 70 | 54 | 58 | 51 | 49 | 368 |
| Microwaveable | 73 | 46 | 47 | 69 | 39 | 50 | 324 |
| Ease of use | 61 | 35 | 36 | 47 | 51 | 48 | 278 |
| Free from added/artificial preservatives | 67 | 35 | 38 | 47 | 36 | 40 | 263 |
| Top 5 companies | |||||||
| RM Food Manufacturing | 22 | 3 | 3 | 6 | 1 | 3 | 38 |
| NTUC Fairprice Co-Operative | 3 | 10 | 2 | 5 | 3 | 11 | 34 |
| Cold Storage | 6 | 9 | 5 | 1 | 2 | 3 | 26 |
| Country Foods | 0 | 0 | 4 | 7 | 4 | 10 | 25 |
| CPF | 3 | 1 | 11 | 3 | 4 | 3 | 25 |
| Top product launches | |||||||
| New variety/range extension | 70 | 56 | 59 | 90 | 99 | 73 | 447 |
| New product | 48 | 82 | 69 | 76 | 62 | 85 | 422 |
| New packaging | 34 | 18 | 41 | 23 | 25 | 23 | 164 |
| Relaunch | 14 | 1 | 4 | 4 | 4 | 4 | 31 |
| New formulation | 0 | 0 | 0 | 0 | 1 | 2 | 3 |
| Top 5 flavours (including blend) | |||||||
| Unflavoured/plain | 26 | 32 | 33 | 29 | 40 | 23 | 183 |
| Chicken | 11 | 5 | 11 | 6 | 3 | 7 | 43 |
| Pork | 1 | 3 | 5 | 6 | 6 | 5 | 26 |
| Cheese | 4 | 5 | 3 | 2 | 2 | 1 | 17 |
| Spice/spicy | 2 | 2 | 3 | 4 | 3 | 2 | 16 |
| Top 5 ingredients | |||||||
| Chicken meat | 76 | 54 | 74 | 80 | 85 | 88 | 459 |
| Pork | 35 | 59 | 47 | 48 | 48 | 43 | 280 |
| Chicken fat | 23 | 23 | 15 | 29 | 24 | 39 | 153 |
| Chicken powder | 33 | 8 | 19 | 26 | 14 | 12 | 112 |
| Chicken stock | 6 | 8 | 6 | 14 | 12 | 17 | 63 |
| Top 5 package types | |||||||
| Flexible | 48 | 50 | 74 | 81 | 95 | 81 | 429 |
| Skinpack | 28 | 59 | 40 | 25 | 35 | 39 | 226 |
| Tray | 39 | 24 | 17 | 31 | 14 | 17 | 142 |
| Can | 15 | 1 | 13 | 16 | 27 | 10 | 82 |
| Flexible stand-up pouch | 7 | 11 | 10 | 18 | 6 | 14 | 66 |
| Unit pack size | |||||||
| 500.00 grams | 7 | 12 | 12 | 22 | 14 | 22 | 89 |
| 400.00 grams | 16 | 8 | 12 | 10 | 9 | 19 | 74 |
| 300.00 grams | 8 | 1 | 14 | 15 | 15 | 13 | 66 |
| 200.00 grams | 5 | 8 | 9 | 10 | 5 | 17 | 54 |
| 1000.00 grams | 4 | 8 | 11 | 6 | 18 | 6 | 53 |
| Source: Mintel Global New Product Database (GNPD), 2024 | |||||||
| Sub-category | Number of products | Average price per product (in US$) |
|---|---|---|
| Poultry products | 309 | 6.60 |
| Meat products | 207 | 7.17 |
| Prepared meals | 116 | 5.25 |
| Hors d'oeuvres/canapes | 97 | 5.25 |
| Meat snacks | 58 | 8.40 |
| Other | 280 | 6.09 |
| Source: Mintel Global New Product Database (GNPD), 2024 | ||
Examples of new products
Chicken Nugget

Source: Mintel Global New Product Database (GNPD), 2024
| Company | Eastern Harvest Foods |
|---|---|
| Brand | Royal Delights |
| Category | Processed fish, meat and egg |
| Sub-category | Poultry products |
| Market | Singapore |
| Store type | Internet / mail order |
| Date published | November 2023 |
| Launch type | New variety / range extension |
| Price in US dollars | 6.29 |
Royal Delights Chicken Nugget is now available, and retails in a 1 kilogram pack. - Just heat and serve - Crispy and juicy - Preparation instructions - Logos and certifications: Facebook, Instagram, Halal
Spiced Pork Cubes
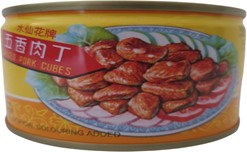
Source: Mintel Global New Product Database (GNPD), 2024
| Company | YHPL Marketing |
|---|---|
| Brand | Narcissus Brand |
| Category | Processed fish, meat and egg |
| Sub-category | Meat products |
| Market | Singapore |
| Location of manufacture | China |
| Import status | Imported |
| Store type | Supermarket |
| Date published | May 2022 |
| Launch type | New variety / range extension |
| Price in US dollars | 2.15 |
Narcissus Brand Spiced Pork Cubes contain no preservatives and artificial colouring. The product is said to be No. 1 in Singapore and retails in a 142 gram pack, bearing the Seal of Authenticity.
Thai Basil Minced Chicken

Source: Mintel Global New Product Database (GNPD), 2024
| Company | RM Food Manufacturing |
|---|---|
| Brand | Taste Asia |
| Category | Meals and meal centers |
| Sub-category | Prepared meals |
| Market | Singapore |
| Location of manufacture | Singapore |
| Import status | Not imported |
| Store type | Supermarket |
| Date published | October 2021 |
| Launch type | New variety / range extension |
| Price in US dollars | 5.16 |
Taste Asia Thai Basil Minced Chicken is a microwavable dish with no added preservatives or colouring. The halal ISO 22000 product is said to be good for sharing and retails in a 320 gram pack with 2017 Winner Singapore Quality Award logo.
Juicy Meat Siew Mai
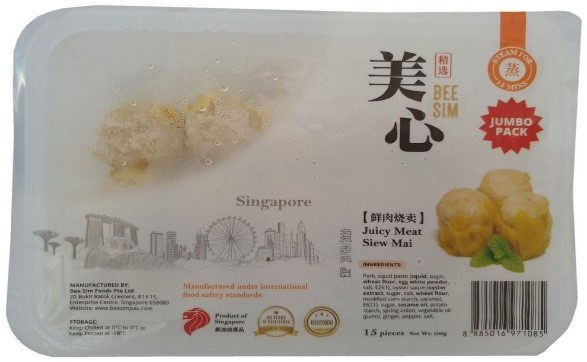
Source: Mintel Global New Product Database (GNPD), 2024
| Company | Bee Sim Foods |
|---|---|
| Brand | Bee Sim |
| Category | Snacks |
| Sub-category | Hors d'oeuvres / canapes |
| Market | Singapore |
| Location of manufacture | Singapore |
| Import status | Not imported |
| Store type | Supermarket |
| Date published | September 2020 |
| Launch type | New product |
| Price in US dollars | 4.75 |
Bee Sim Juicy Meat Siew Mai can be prepared by steaming for 15 minutes. This dumpling is ISO 22000 certified, is freezable, and retails in a 500 gram jumbo pack containing 15 units.
BBQ Pork Bak Kwa Smoked with Lycheewood

Source: Mintel Global New Product Database (GNPD), 2024
| Company | Golden Bridge Foods Manufacturing |
|---|---|
| Brand | Golden Bridge |
| Category | Snacks |
| Sub-category | Meat snacks |
| Market | Singapore |
| Store type | Supermarket |
| Date published | February 2018 |
| Launch type | New variety / range extension |
| Price in US dollars | 6.44 |
Golden Bridge BBQ Pork Bak Kwa Smoked with Lycheewood is made with lean pork meat, and contains no added nitrites or MSG. The ready-to-eat product retails in a 240 gram pack bearing a QR code.
Opportunities for Canada
The demand for fresh and processed meat is expected to continue and evolve as Singaporeans incorporate more health and wellness attributes into their daily lifestyles and diets, post pandemic.
Fresh and processed meat as a staple product, can offer better-for-you features such as low fat and leaner source proteins, which address growing consumer requirements for healthier and clean eating food choices (for example, white meat such as chicken, is perceived as healthier than red meat) as well as the affordability and convenience offered by processed meat. As such, there remains substantial opportunity for Canada to increase its presence in the Singapore market as suppliers of safe and high- quality fresh meat, and value-added processed meat, and meat products. That said, it remains important for Canadian suppliers to work closely with their importing partners to ensure that Singapore's import requirements are met. It is also important to note and appreciate the value of commitment, and market development efforts needed to further access the Singaporean market in relation to competitors who may yield a price competitiveness and freight advantage due to their relative proximity.
Canada's broad (and growing) trade network provides Canadian companies preferred access to diverse markets all over the world. Information on Canada's free trade agreements (FTA) may be found at Global Affairs Canada,Trade and investment agreements.
The Comprehensive and Progressive Agreement for Trans-Pacific Partnership (CPTPP) is a free trade agreement (FTA) between Canada and 10 other countries in the Asia-Pacific region: Australia, Brunei, Chile, Japan, Malaysia, Mexico, New Zealand, Peru, Singapore and Vietnam. The CPTPP entered into force on December 30, 2018, in the first six countries to have ratified the agreement: Canada, Australia, Japan, Mexico, New Zealand, and Singapore (Global Affairs Canada; About the Comprehensive and Progressive Agreement for Trans-Pacific Partnership [CPTPP]).
One of the benefits of the CPTPP agreement is a comprehensive tariff elimination across all sectors. Once fully implemented, 99% (94% of Canada's exports of agriculture and agri-food products) of tariff lines among CPTPP parties will be duty free. For additional tariff information, please consult theCanada Tariff Finder to explore tariff information for the CPTPP market, and other countries with which Canada has a free trade agreement (Global Affairs Canada; About tariff elimination under the CPTPP).
The CPTPP commits to helping small and medium-sized enterprises (SMEs) take advantage of the agreement's commercial opportunities. SMEs represent over 99% of Canadian businesses and almost 90% of all private sector jobs in Canada. For further information, please consult Learn about CPTPP benefits for small and medium-sized enterprises.
Canadian suppliers interested in exporting meat and meat products to the Singaporean market are encouraged to review the Singapore - Export requirements for meat and poultry products provided by the Canadian Food Inspection Agency (CFIA).
For more information
The Canadian Trade Commissioner Service:
International Trade Commissioners can provide Canadian industry with on-the-ground expertise regarding market potential, current conditions and local business contacts, and are an excellent point of contact for export advice.
More agri-food market intelligence:
International agri-food market intelligence
Discover global agriculture and food opportunities, the complete library of Global Analysis reports, market trends and forecasts, and information on Canada's free trade agreements.
Agri-food market intelligence service
Canadian agri-food and seafood businesses can take advantage of a customized service of reports and analysis, and join our email subscription service to have the latest reports delivered directly to their inbox.
More on Canada's agriculture and agri-food sectors:
Canada's agriculture sectors
Information on the agriculture industry by sector. Data on international markets. Initiatives to support awareness of the industry in Canada. How the department engages with the industry.
For information on upcoming trade show such as Food & Hotel Asia (Singapore), please contact:
Ben Berry, Deputy Director
Trade Show Strategy and Delivery
Agriculture and agri-food Canada
ben.berry@agr.gc.ca
Resources
- Euromonitor International, 2024
- Country Report; Singapore Consumer Profile, October 10, 2023
- Country Report; Income and Expenditure, October 13, 2023
- Country Report; Processed meat, seafood and alternatives to meat in Singapore, January 2024
- Global Affairs Canada; Trade and investment agreements, (About) Comprehensive and Progressive Agreement for Trans-Pacific Partnership (CPTPP)
- Global Affairs Canada; Trade and investment agreements, Learn about CPTPP benefits for small and medium-sized enterprises
- Global Trade Tracker, 2024
- Mintel Global New Products Database, 2024
- Mintel; A year of innovation in meat and poultry, 2023. Kaczorowski, Michael, January 15, 2024
- Singapore Food Agency, Singapore Food Statistics 2021, page 6
- Trade Commissioner Service; Agriculture and processed foods, High Commission of Canada, Singapore
Sector Trend Analysis – Meat trends in Singapore
Global Analysis Report
Prepared by: Laurie Bernardi, International Market Research Analyst
© His Majesty the King in Right of Canada, represented by the Minister of Agriculture and Agri-Food (2024).
Photo credits
All photographs reproduced in this publication are used by permission of the rights holders.
All images, unless otherwise noted, are copyright His Majesty the King in Right of Canada.
To join our distribution list or to suggest additional report topics or markets, please contact:
Agriculture and Agri-Food Canada, Global Analysis1341 Baseline Rd, Tower 5, 3rd floor
Ottawa ON K1A 0C5
Canada
Email: aafc.mas-sam.aac@agr.gc.ca
The Government of Canada has prepared this report based on primary and secondary sources of information. Although every effort has been made to ensure that the information is accurate, Agriculture and Agri-Food Canada (AAFC) assumes no liability for any actions taken based on the information contained herein.
Reproduction or redistribution of this document, in whole or in part, must include acknowledgement of agriculture and agri-food Canada as the owner of the copyright in the document, through a reference citing AAFC, the title of the document and the year. Where the reproduction or redistribution includes data from this document, it must also include an acknowledgement of the specific data source(s), as noted in this document.
Agriculture and Agri-Food Canada provides this document and other report services to agriculture and food industry clients free of charge.