

Note: This report includes forecasting data that is based on baseline historical data.
Executive summary
The European Union (EU) was Canada's 3rd largest export market for fish and seafood in 2023, representing 5.5% of Canada's global fish and seafood exports. In 2023, Canada exported Can$418.1 million in fish and seafood to the EU, an increase of 3.2% every year between 2018 and 2023. Canada's key exports included lobster, cold-water shrimp and scallop. Canada has duty-free access under the Canada-EU Comprehensive Economic and Trade Agreement (CETA) for fish and seafood products since January 1, 2024. For more information on the CETA provisions, please refer to the chapter-by-chapter guide.
The EU's global fish and seafood imports reached Can$86.1 billion in 2023, including nearly Can$44 billion of imports sourced outside of the EU region. This represented 51.1% of the region's global fish and seafood imports. During the 2018-2023 period, inter-EU fish and seafood imports expanded by 4.9% per year, while non-EU imports increased by 2.2% per year. Excluding inter-EU imports, Canada was the 19th largest supplier in 2023. Top 5 EU fish and seafood importers were Spain, Italy, France, Sweden and Germany. The EU's top 3 imports were salmon, shrimp and tuna.
The EU's total fish and seafood volume sales were estimated at 3.8 million tons in 2023, a decrease of 1.4% every year during the 2018-2023 period. However, volume sales were projected to increase by 1.3% annually between 2023 and 2028. By total sales volume, Spain was the largest market with 901,000 tons in 2023. Among the 19 EU member states in the database, Italy was the largest market, with retail value sales at US$8.3 billion in 2023. Most of the EU member states are projected to see a positive growth during the forecast period.
There were 13,930 new packaged fish and seafood products introduced in the EU market between January 2018 and December 2023. Salmon and tuna were the two most popular fish and seafood ingredients, which are two of the most popular species consumed in the EU.
Canadian performance
The EU was Canada's 3rd largest export market for fish and seafood in 2023, to which Canada exported Can$418.1 million, accounting for 5.5% of Canada's global fish and seafood exports. Canada's fish seafood exports to the EU expanded by 3.2% per year between 2018 and 2023. Canada has always been a net exporter for fish and seafood trade with the EU, recording a trade surplus of Can$170.4 million in 2023.
France was Canada's largest fish and seafood export market within the EU, to which Canada shipped nearly quarter of Canadian fish and seafood exports to the EU (or Can$99.7 million) in 2023. Other key export destinations were Belgium (Can$67.9 million, 16.2% share), Denmark (Can$58.5 million, 14.0%), Netherlands (Can$55.3 million, 13.2%) and Spain (Can$48.2 million, 11.5%). During the review period, Ireland was Canada's fastest growing fish and seafood export market within the EU, for which our exports increased by 35.0% per year, recording Can$63,390 in exports in 2023. Canadian fish and seafood exports to Greece, Lithuania and Latvia also saw a healthy growth between 2018 and 2023.
| Export market | 2018 | 2019 | 2020 | 2021 | 2022 | 2023 | Share % in 2023 | CAGR* % 2018-2023 |
|---|---|---|---|---|---|---|---|---|
| World | 6,938.7 | 7,459.8 | 6,432.2 | 8,828.1 | 8,399.6 | 7,585.1 | 1.8 | |
| United States | 4,277.4 | 4,567.9 | 4,115.9 | 6,162.2 | 5,442.2 | 4,881.6 | 64.4 | 2.7 |
| China | 1,170.3 | 1,309.1 | 1,037.2 | 1,159.1 | 1,295.2 | 1,441.2 | 19.0 | 4.3 |
| European Union | 356.4 | 413.5 | 378.6 | 459.8 | 536.8 | 418.1 | 5.5 | 3.2 |
| Japan | 287.3 | 285.1 | 220.8 | 253.4 | 252.6 | 188.4 | 2.5 | −8.1 |
| Hong Kong | 179.2 | 233.8 | 126.6 | 165.6 | 160.7 | 162.2 | 2.1 | −2.0 |
| South Korea | 121.3 | 121.6 | 106.0 | 129.4 | 145.1 | 94.3 | 1.2 | −4.9 |
| United Kingdom | 96.7 | 100.7 | 64.9 | 111.4 | 112.7 | 89.1 | 1.2 | −1.6 |
| Vietnam | 60.0 | 70.8 | 51.5 | 43.5 | 91.1 | 48.0 | 0.6 | −4.4 |
| Dominican Republic | 28.8 | 33.1 | 40.7 | 36.0 | 41.9 | 34.1 | 0.4 | 3.4 |
| Taiwan | 56.9 | 38.0 | 34.6 | 41.1 | 42.9 | 31.4 | 0.4 | −11.2 |
|
Source: StatCan, accessed by Global Trade Tracker, 2024 *CAGR: Compound Annual Growth Rate |
||||||||
| Export market | 2018 | 2019 | 2020 | 2021 | 2022 | 2023 | Share % in 2023 | CAGR* % 2018-2023 |
|---|---|---|---|---|---|---|---|---|
| European Union | 356,373.8 | 413,466.9 | 378,619.8 | 459,825.1 | 536,796.2 | 418,097.4 | 100.0 | 3.2 |
| France | 63,792.3 | 81,947.0 | 80,503.7 | 83,774.1 | 103,133.4 | 99,727.2 | 23.9 | 9.3 |
| Belgium | 48,214.7 | 54,833.5 | 61,868.2 | 83,465.4 | 85,438.3 | 67,884.9 | 16.2 | 7.1 |
| Denmark | 81,247.2 | 91,894.6 | 65,137.6 | 69,783.4 | 63,677.4 | 58,497.2 | 14.0 | −6.4 |
| Netherlands | 35,645.7 | 50,054.2 | 50,057.5 | 68,794.5 | 86,901.4 | 55,325.0 | 13.2 | 9.2 |
| Spain | 42,481.1 | 47,646.7 | 51,146.1 | 71,238.2 | 92,499.1 | 48,224.8 | 11.5 | 2.6 |
| Italy | 16,907.9 | 19,640.5 | 17,763.8 | 29,354.4 | 35,453.2 | 22,450.3 | 5.4 | 5.8 |
| Lithuania | 7,538.9 | 9,575.4 | 4,509.4 | 2,187.9 | 18,388.8 | 19,827.3 | 4.7 | 21.3 |
| Germany | 13,117.6 | 13,748.7 | 11,138.5 | 11,199.6 | 15,203.5 | 12,970.0 | 3.1 | −0.2 |
| Sweden | 11,964.4 | 12,505.1 | 10,234.2 | 11,903.8 | 13,081.7 | 8,660.8 | 2.1 | −6.3 |
| Bulgaria | 12,851.3 | 9,781.1 | 9,590.6 | 7,844.6 | 6,989.0 | 5,779.4 | 1.4 | −14.8 |
| Romania | 4,281.3 | 6,779.6 | 5,243.9 | 7,108.5 | 3,634.9 | 4,176.1 | 1.0 | −0.5 |
| Poland | 3,462.2 | 1,737.5 | 3,234.3 | 2,988.2 | 2,427.7 | 3,499.6 | 0.8 | 0.2 |
| Portugal | 5,314.8 | 4,051.1 | 1,196.8 | 1,718.1 | 3,020.1 | 2,986.2 | 0.7 | −10.9 |
| Finland | 5,602.3 | 4,562.1 | 4,140.4 | 2,452.3 | 2,703.7 | 2,915.0 | 0.7 | −12.2 |
| Estonia | 2,617.7 | 1,759.8 | 808.9 | 1,974.8 | 1,654.8 | 2,889.5 | 0.7 | 2.0 |
| Greece | 490.5 | 1,144.8 | 1,042.1 | 2,768.8 | 1,686.5 | 1,754.6 | 0.4 | 29.0 |
| Austria | 283.3 | 193.0 | 18.7 | 682.1 | 438.1 | 377.6 | 0.1 | 5.9 |
| Ireland | 14.1 | 1,065.7 | 706.3 | 63.4 | 0.0 | 35.0 | ||
| Croatia | 83.3 | 153.5 | 43.7 | 49.1 | 0.0 | −10.0 | ||
| Latvia | 16.1 | 93.7 | 51.5 | 35.6 | 71.8 | 29.0 | 0.0 | 12.5 |
| Czech Republic | 4.7 | 144.9 | 298.1 | 7.6 | 0.0 | |||
| Hungary | 69.6 | 18.5 | 350.4 | 1.6 | 0.0 | −53.0 | ||
| Slovenia | 94.7 | 1.1 | 0.0 | |||||
| Slovakia | 57.5 | 0.0 | ||||||
| Malta | 223.0 | 15.0 | 0.0 | −100.0 | ||||
| Luxembourg | 203.8 | 0.0 | ||||||
| Cyprus | 154.5 | 82.4 | 156.7 | 0.0 | −100.0 | |||
|
Source: StatCan, accessed by Global Trade Tracker, 2024 *CAGR: Compound Annual Growth Rate |
||||||||
Canada's top 3 fish and seafood exports in 2023
Lobster
Lobster was Canada's largest fish and seafood export to the EU in 2023, valued at Can$201.2 million, which accounted for 48.1% of Canada's total fish and seafood exports to the EU. Canada's lobster exports expanded by 7.2% annually between 2018 and 2023. For product types, live, fresh and chilled lobster represented 52.2% of Canada's total lobster exports to the EU (Can$105.1 million). Frozen lobster accounted for 39.9% (Can$80.2 million), followed by prepared/ preserved lobster accounting for 7.2% (Can$14.7 million).
Lobster was the EU's 10th largest fish and seafood imports in 2023, valued at Can$1.4 billion, representing 1.6% of the EU's global fish and seafood imports. The EU's lobster imports increased by 3.8% during the 2018-2023 period. Live, fresh and chilled lobster was the largest imports, valued at Can$429.5 million, followed by frozen Norway lobster (Can$365.5 million) and frozen lobster (Can$180.0 million). Canada was the 2nd largest supplier with the UK and the U.S. being our main competitor. While there is no free trade agreement between the EU and U.S., the two struck an agreement on a package of tariff reductions in 2020, which includes duty-free access for live and frozen lobster imported from the U.S. Prepared/ preserved lobster from the U.S. is subject to a most favored nation (MFN) tariff of 20%.
Cold-water shrimp
Cold-water shrimp was Canada's 2nd largest fish and seafood export to the EU in 2023, valued at Can$58.0 million, which accounted for 13.9% of Canada's total fish and seafood exports to the EU. Canada's cold-water shrimp exports contracted by 2.6% annually and all exports were frozen products during the review period. Cold-water shrimp was the EU's 18th largest fish and seafood imports in 2023, valued at Can$739.7 million, representing 0.9% of the EU's global fish and seafood imports. The EU's cold-water shrimp imports increased by 1.2% during the 2018-2023 period. Nearly 90% of the EU's cold-water shrimp imports were frozen products (Can$661.9 million), which expanded by 4.5% per year during the review period. Excluding inter-EU trade, Canada was the 2nd largest supplier, representing 3.4% of the EU's global cold-water shrimp imports in 2023. Greenland was the largest supplier, accounting for nearly half of the EU's cold-water shrimp imports (Can$359.2 million).
Scallop
Scallop was Canada's 3rd largest fish and seafood exports to the EU in 2023, valued at Can$56.5 million, which accounted for 13.5% of Canada's total fish and seafood exports to the EU. Canada's scallop exports increased by 13.8% annually between 2018 and 2023. Scallop was the EU's 21st largest fish and seafood imports in 2023, valued at Can$694.3 million, representing 0.8% of the EU's global fish and seafood imports. The EU's scallop imports increased by 1.4% during the 2018-2023 period. Excluding inter-EU trade, Canada was the 3rd largest supplier, representing 9.6% of the EU's global scallop imports in 2023. The UK was the largest supplier, accounting for nearly 20% of the EU's scallop imports (Can$137.6 million).
| Species/ Product | 2018 | 2019 | 2020 | 2021 | 2022 | 2023 | Share % in 2023 | CAGR* % 2018-2023 |
|---|---|---|---|---|---|---|---|---|
| Lobster | 142.4 | 161.3 | 166.6 | 256.0 | 312.1 | 201.2 | 48.1 | 7.2 |
| Cold-water shrimp | 66.2 | 67.2 | 48.8 | 55.2 | 34.2 | 58.0 | 13.9 | −2.6 |
| Scallop | 29.6 | 53.9 | 54.6 | 52.8 | 74.7 | 56.5 | 13.5 | 13.8 |
| Hake | 19.6 | 21.2 | 13.6 | 13.7 | 20.9 | 20.6 | 4.9 | 1.0 |
| Fish oil | 2.3 | 7.1 | 12.6 | 11.9 | 11.8 | 7.2 | 1.7 | 25.5 |
| Shrimp | 21.6 | 25.1 | 19.0 | 13.7 | 11.5 | 6.6 | 1.6 | −21.2 |
| Cod | 4.0 | 4.5 | 2.3 | 2.4 | 7.9 | 5.4 | 1.3 | 5.9 |
| Salmon | 16.4 | 10.5 | 8.7 | 5.2 | 5.3 | 4.9 | 1.2 | −21.4 |
| Fish liver and roe | 0.3 | 0.4 | 0.6 | 0.1 | 2.3 | 4.8 | 1.1 | 72.0 |
| Halibut | 0.4 | 1.3 | 1.4 | 1.7 | 0.6 | 4.7 | 1.1 | 64.5 |
|
Source: StatCan, accessed by Global Trade Tracker, 2024 *CAGR: Compound Annual Growth Rate |
||||||||
| Species/ Product | 2018 | 2019 | 2020 | 2021 | 2022 | 2023 | Share % in 2023 | CAGR* % 2018-2023 |
|---|---|---|---|---|---|---|---|---|
| Pollack | 43.0 | 32.4 | 159.5 | 4,323.4 | 2,000.9 | 0.5 | 115.6 | |
| Tuna | 129.2 | 8.2 | 1,210.4 | 664.8 | 1,982.5 | 3,099.3 | 0.7 | 88.8 |
| Sea cucumber | 3.2 | 77.0 | 11.4 | 51.8 | 44.2 | 0.0 | 68.9 | |
| Halibut | 389.7 | 1,272.0 | 1,385.6 | 1,680.0 | 592.9 | 4,698.1 | 1.1 | 64.5 |
| Sea bass | 0.1 | 0.0 | 3.7 | 0.7 | 0.0 | 57.6 | ||
| Fish oil | 2,312.0 | 7,104.7 | 12,636.6 | 11,872.2 | 11,812.0 | 7,191.1 | 1.7 | 25.5 |
| Haddock | 1.2 | 121.3 | 0.5 | 0.6 | 1.7 | 3.5 | 0.0 | 23.2 |
| Clam | 1,705.4 | 1,421.0 | 1,725.5 | 4,033.2 | 4,843.1 | 4,361.9 | 1.0 | 20.7 |
| Trout | 23.8 | 115.5 | 48.9 | 87.4 | 78.4 | 53.6 | 0.0 | 17.6 |
| Scallop | 29,637.3 | 53,935.3 | 54,642.6 | 52,775.1 | 74,681.8 | 56,530.9 | 13.5 | 13.8 |
|
Source: StatCan, accessed by Global Trade Tracker, 2024 *CAGR: Compound Annual Growth Rate |
||||||||
The European Union's fish and seafood imports
The EU's fish and seafood imports reached nearly Can$86.1 billion in 2023, including Can$42.1 billion of inter-EU imports. For the same year, the EU imported nearly Can$44 billion in fish and seafood outside of the EU region, which accounted for 51.1% of the region's global fish and seafood imports. During the 2018 to 2023 period, inter-EU fish and seafood imports expanded by 4.9% per year, while non-EU imports increased by 2.2% per year. Excluding inter-EU imports, Canada was the 19th largest supplier. With fish and seafood trade with non-EU markets, the EU is a net importer, recording a trade deficit of Can$32.7 billion in 2023.
Spain was the largest fish and seafood importer within the EU, accounting for 14.5% of the region's global fish and seafood imports. In 2023, Spain imported Can$12.5 billion in fish and seafood globally. Top 5 markets included Italy (Can$10.9 billion, 12.7%% share), France (Can$10.7 billion, 12.4% share), Sweden (Can$8.9 billion, 10.3% share) and Germany (Can$8.5 billion, 9.9% share). Spain, France, Italy and Germany sourced about two-thirds of its imported fish and seafood outside of the EU region, whereas Sweden sourced about 90% from non-EU markets. Croatia was the fastest growing fish and seafood importer within the EU, with Can$397.5 of global imports in 2023, an increase of 10.8% during the review period.
| Importer | 2018 | 2019 | 2020 | 2021 | 2022 | 2023 | Share % in 2023 | CAGR* % 2018-2023 |
|---|---|---|---|---|---|---|---|---|
| European Union total | 72,634.1 | 71,383.8 | 68,950.2 | 74,150.8 | 83,212.3 | 86,085.2 | 100.0 | 3.5 |
| Spain | 11,249.0 | 10,817.1 | 9,889.5 | 11,205.6 | 12,631.9 | 12,465.3 | 14.5 | 2.1 |
| Italy | 9,222.2 | 8,931.9 | 8,222.0 | 9,723.5 | 10,361.6 | 10,916.0 | 12.7 | 3.4 |
| France | 9,267.3 | 9,019.8 | 8,676.4 | 9,869.1 | 10,802.7 | 10,702.7 | 12.4 | 2.9 |
| Sweden | 7,301.0 | 6,993.9 | 6,790.9 | 7,035.8 | 8,094.8 | 8,886.4 | 10.3 | 4.0 |
| Germany | 7,998.1 | 7,941.1 | 8,136.4 | 7,635.0 | 8,690.5 | 8,537.2 | 9.9 | 1.3 |
| Netherlands | 5,882.2 | 5,998.1 | 6,172.9 | 6,464.2 | 7,241.3 | 7,520.9 | 8.7 | 5.0 |
| Denmark | 5,124.9 | 5,321.9 | 5,139.9 | 5,253.0 | 6,099.4 | 6,521.9 | 7.6 | 4.9 |
| Poland | 3,341.5 | 3,458.0 | 3,546.4 | 3,807.3 | 4,285.2 | 4,794.7 | 5.6 | 7.5 |
| Portugal | 3,345.7 | 3,212.0 | 2,916.5 | 3,061.0 | 3,514.0 | 3,674.8 | 4.3 | 1.9 |
| Belgium | 3,054.5 | 2,881.6 | 2,914.0 | 3,018.8 | 3,313.7 | 3,342.8 | 3.9 | 1.8 |
| Greece | 1,013.4 | 1,032.8 | 950.6 | 1,069.8 | 1,296.1 | 1,343.6 | 1.6 | 5.8 |
| Austria | 821.0 | 833.5 | 782.2 | 841.7 | 896.8 | 1,019.5 | 1.2 | 4.4 |
| Lithuania | 825.4 | 810.6 | 790.5 | 794.0 | 953.4 | 886.5 | 1.0 | 1.4 |
| Finland | 804.8 | 727.0 | 698.6 | 679.8 | 892.8 | 812.0 | 0.9 | 0.2 |
| Czech Republic | 513.7 | 529.9 | 538.3 | 611.2 | 701.0 | 782.6 | 0.9 | 8.8 |
| Romania | 481.4 | 476.2 | 490.9 | 566.9 | 628.5 | 710.7 | 0.8 | 8.1 |
| Ireland | 491.7 | 484.7 | 491.5 | 447.3 | 464.0 | 557.3 | 0.6 | 2.5 |
| Croatia | 238.4 | 269.6 | 220.4 | 299.2 | 358.3 | 397.5 | 0.5 | 10.8 |
| Latvia | 252.5 | 259.4 | 284.5 | 309.3 | 341.0 | 365.8 | 0.4 | 7.7 |
| Malta | 261.0 | 198.7 | 158.8 | 180.6 | 242.3 | 315.5 | 0.4 | 3.9 |
| Estonia | 194.1 | 209.4 | 212.1 | 227.4 | 263.0 | 279.3 | 0.3 | 7.6 |
| Slovakia | 161.7 | 168.9 | 175.2 | 202.3 | 206.1 | 247.5 | 0.3 | 8.9 |
| Slovenia | 163.3 | 173.9 | 160.6 | 201.0 | 212.3 | 231.3 | 0.3 | 7.2 |
| Bulgaria | 161.2 | 167.0 | 153.8 | 177.0 | 208.7 | 229.7 | 0.3 | 7.3 |
| Hungary | 163.3 | 161.4 | 167.4 | 175.4 | 187.8 | 198.3 | 0.2 | 4.0 |
| Luxembourg | 180.4 | 175.2 | 172.7 | 178.3 | 179.9 | 188.4 | 0.2 | 0.9 |
| Cyprus | 120.4 | 129.9 | 97.1 | 116.2 | 145.0 | 157.1 | 0.2 | 5.5 |
|
Source: Eurostat, accessed by Global Trade Tracker, 2024 *CAGR: Compound Annual Growth Rate |
||||||||
The European Union's top 3 fish and seafood imports in 2023
Salmon
Salmon was the EU's largest fish and seafood import, valued at Can$25.2 billion, which accounted for nearly 30% of the EU's global fish and seafood imports in 2023. The EU's salmon imports increased by 6.3% every year between 2018 and 2023. With respect to import origin, 51.4% of the region's salmon imports were sourced within the EU-27 member states. Excluding inter-EU imports, Norway was the largest supplier, accounting for nearly 40% of the region's global imports. Canada was 11th largest supplier in 2023. Top 3 products were fresh/ chilled Atlantic salmon, fresh/ chilled Pacific salmon fillet and smoked Pacific salmon.
Shrimp
Shrimp was the EU's 2nd largest fish and seafood import, valued at Can$7.9 billion, representing 9.2% of the EU's global fish and seafood imports in 2023. The EU's shrimp imports recorded an annual growth of 0.5% between 2018 and 2023 and were sourced from diverse markets with nearly two-thirds of them originated from non-EU markets. The majority of EU shrimp imports are warm water species with Ecuador, India and Vietnam being the main suppliers and accounting for 31.5% of the region's total shrimp imports. Canada was the 23rd largest supplier in 2023. Top 3 products were frozen shrimp, prepared/ preserved shrimp in air tight container and prepared/ preserved shrimp not in air tight containers.
Tuna
Tuna was the EU's 3rd largest fish and seafood import, reaching nearly Can$7.0 billion in value, representing 8.1% of the EU's global fish and seafood imports in 2023. The EU's tuna imports expanded by 2.2% annually between 2018 and 2023. With respect to import origin, inter-EU imports represented 42.4% in 2023. Excluding inter-EU imports, Ecuador was the largest supplier, from which the EU imported nearly Can$1 billion, accounting for 14.3% of the region's total tuna imports in 2023. Top 3 imports included, prepared/ preserved tunas, skipjack and Atlantic bonito, frozen fillet of skipjack tuna and stripe-bellied bonito, and frozen yellow fin tuna. Canada is a tiny player in this market.
| Product / Supplier | 2018 | 2019 | 2020 | 2021 | 2022 | 2023 | Share % in 2023 | CAGR* % 2018-2023 |
|---|---|---|---|---|---|---|---|---|
| Salmon | 18,565.4 | 18,340.1 | 17,820.0 | 19,694.4 | 23,067.1 | 25,161.6 | 6.3 | |
| Inter-EU total | 8,977.9 | 8,730.6 | 8,690.0 | 10,011.6 | 11,589.3 | 12,924.5 | 51.4 | 7.6 |
| Norway | 7,867.3 | 7,633.4 | 7,220.6 | 7,657.6 | 9,181.6 | 10,039.1 | 39.9 | 5.0 |
| United Kingdom | 668.4 | 796.2 | 790.2 | 828.8 | 710.2 | 679.8 | 2.7 | 0.3 |
| Faroe Islands | 126.2 | 254.1 | 274.9 | 415.8 | 576.5 | 567.9 | 2.3 | 35.1 |
| Iceland | 53.2 | 128.3 | 165.6 | 187.6 | 241.0 | 275.1 | 1.1 | 38.9 |
| Canada (11th) | 24.9 | 12.2 | 11.3 | 9.0 | 7.0 | 6.3 | 0.0 | −24.0 |
| Shrimp | 7,747.2 | 7,225.9 | 7,145.0 | 8,153.2 | 8,748.1 | 7,937.3 | 0.5 | |
| Inter-EU total | 2,300.9 | 2,140.7 | 2,234.2 | 2,567.1 | 2,737.3 | 2,750.9 | 34.7 | 3.6 |
| Ecuador | 929.7 | 896.1 | 1,004.3 | 1,225.8 | 1,367.1 | 1,328.3 | 16.7 | 7.4 |
| India | 553.5 | 505.8 | 494.7 | 591.7 | 835.5 | 660.9 | 8.3 | 3.6 |
| Argentina | 762.4 | 683.7 | 570.7 | 879.3 | 656.7 | 642.4 | 8.1 | −3.4 |
| Vietnam | 713.2 | 605.5 | 620.9 | 637.7 | 873.0 | 519.0 | 6.5 | −6.2 |
| Venezuela | 76.4 | 134.9 | 138.7 | 200.6 | 218.2 | 274.9 | 3.5 | 29.2 |
| Canada (23rd) | 106.6 | 72.6 | 41.9 | 33.4 | 19.1 | 28.3 | 0.4 | −23.3 |
| Tuna | 6,279.4 | 6,005.0 | 6,266.1 | 5,929.5 | 6,941.2 | 6,988.3 | 2.2 | |
| Inter-EU total | 2,223.6 | 2,104.1 | 2,389.4 | 2,431.4 | 2,780.8 | 2,965.6 | 42.4 | 5.9 |
| Ecuador | 891.2 | 966.7 | 850.6 | 786.7 | 945.2 | 998.3 | 14.3 | 2.3 |
| Seychelles | 318.4 | 236.8 | 282.6 | 316.1 | 330.3 | 372.4 | 5.3 | 3.2 |
| Papua New Guinea | 232.7 | 239.5 | 287.8 | 282.9 | 330.6 | 273.6 | 3.9 | 3.3 |
| Mauritius | 296.5 | 271.5 | 254.6 | 207.8 | 244.0 | 265.7 | 3.8 | −2.2 |
| Philippines | 309.5 | 288.4 | 312.9 | 240.8 | 263.4 | 233.3 | 3.3 | −5.5 |
| Canada (36th) | 0.0 | 0.0 | 0.5 | 1.0 | 3.2 | 3.1 | 0.0 | 223.2 |
| Cod | 4,845.0 | 4,978.0 | 4,744.7 | 4,452.7 | 5,104.7 | 5,223.8 | 1.5 | |
| Inter-EU | 2,063.6 | 2,039.4 | 2,047.2 | 2,055.0 | 2,332.7 | 2,348.4 | 45.0 | 2.6 |
| Norway | 1,188.6 | 1,179.7 | 1,127.8 | 1,081.4 | 1,201.5 | 1,174.7 | 22.5 | −0.2 |
| Russia | 566.1 | 600.7 | 536.9 | 515.8 | 680.0 | 703.6 | 13.5 | 4.4 |
| Iceland | 359.1 | 378.0 | 408.3 | 372.3 | 399.9 | 413.3 | 7.9 | 2.9 |
| China | 323.9 | 390.1 | 316.4 | 242.2 | 299.5 | 283.9 | 5.4 | −2.6 |
| Greenland | 74.3 | 90.7 | 78.5 | 75.8 | 93.0 | 126.2 | 2.4 | 11.2 |
| Canada (10th) | 10.4 | 11.3 | 5.9 | 6.8 | 8.5 | 8.3 | 0.2 | −4.3 |
| Squid | 3,770.3 | 3,647.9 | 3,174.5 | 3,639.5 | 4,315.7 | 4,240.1 | 2.4 | |
| Inter-EU total | 1,085.9 | 1,114.4 | 955.6 | 1,204.1 | 1,370.7 | 1,467.1 | 34.6 | 6.2 |
| Morocco | 246.4 | 350.8 | 432.6 | 550.1 | 416.8 | 614.2 | 14.5 | 20.0 |
| India | 459.6 | 421.7 | 366.2 | 440.5 | 646.0 | 498.4 | 11.8 | 1.6 |
| Falkland Islands | 294.0 | 311.2 | 309.0 | 315.8 | 371.6 | 319.2 | 7.5 | 1.7 |
| Peru | 288.9 | 308.8 | 250.6 | 217.7 | 251.6 | 277.8 | 6.6 | −0.8 |
| China | 405.9 | 325.7 | 221.3 | 225.9 | 309.6 | 235.6 | 5.6 | −10.3 |
| Canada (73rd) | 0.0 | 0.6 | 2.0 | 4.7 | 3.0 | 0.0 | −100.0 | |
| Octopus | 2,215.5 | 1,641.5 | 1,244.5 | 2,158.8 | 2,206.3 | 2,026.8 | −1.8 | |
| Inter-EU total | 678.6 | 514.7 | 410.9 | 719.7 | 733.3 | 701.0 | 34.6 | 0.6 |
| Morocco | 658.8 | 497.4 | 435.8 | 758.2 | 652.1 | 744.7 | 36.7 | 2.5 |
| Mauritania | 351.6 | 266.7 | 200.1 | 288.0 | 418.9 | 290.2 | 14.3 | −3.8 |
| Indonesia | 102.6 | 66.1 | 43.7 | 61.2 | 87.8 | 61.8 | 3.0 | −9.7 |
| Senegal | 97.3 | 94.6 | 37.0 | 117.7 | 107.2 | 59.3 | 2.9 | −9.4 |
| India | 20.3 | 20.7 | 13.6 | 23.1 | 40.4 | 23.8 | 1.2 | 3.3 |
| Pollack | 1,285.0 | 1,465.3 | 1,599.1 | 1,536.0 | 1,921.7 | 1,906.8 | 8.2 | |
| Inter-EU | 266.0 | 247.8 | 263.2 | 308.0 | 451.0 | 434.1 | 22.8 | 10.3 |
| China | 426.9 | 554.0 | 539.1 | 469.7 | 604.3 | 665.3 | 34.9 | 9.3 |
| Russia | 155.5 | 163.3 | 191.0 | 245.4 | 408.8 | 387.9 | 20.3 | 20.1 |
| United States | 426.1 | 487.4 | 590.2 | 504.4 | 426.5 | 385.5 | 20.2 | −2.0 |
| South Korea | 3.6 | 5.2 | 6.1 | 5.9 | 26.6 | 33.3 | 1.7 | 56.3 |
| Canada (5th) | 0.1 | 0.1 | 0.0 | 0.5 | 1.5 | 0.3 | 0.0 | 14.4 |
| Hake | 1,468.7 | 1,454.3 | 1,380.7 | 1,348.5 | 1,418.4 | 1,569.6 | 1.3 | |
| Inter-EU | 514.2 | 487.1 | 469.1 | 492.6 | 532.1 | 555.3 | 35.4 | 1.5 |
| Namibia | 386.7 | 371.0 | 341.7 | 309.6 | 304.6 | 400.5 | 25.5 | 0.7 |
| South Africa | 188.4 | 181.2 | 208.9 | 201.8 | 169.4 | 194.2 | 12.4 | 0.6 |
| Argentina | 95.6 | 118.6 | 104.5 | 100.9 | 126.9 | 152.5 | 9.7 | 9.8 |
| United States | 69.0 | 84.7 | 76.6 | 74.0 | 95.5 | 108.0 | 6.9 | 9.4 |
| Chile | 75.5 | 71.2 | 68.4 | 71.2 | 82.3 | 79.4 | 5.1 | 1.0 |
| Canada (10th) | 13.7 | 12.7 | 10.9 | 12.0 | 11.7 | 7.7 | 0.5 | −10.9 |
| Fish fat and oil | 753.9 | 726.6 | 880.0 | 863.9 | 1,052.3 | 1,524.4 | 15.1 | |
| Inter-EU | 242.6 | 244.2 | 302.9 | 329.6 | 388.4 | 540.3 | 35.4 | 17.4 |
| Norway | 84.7 | 93.3 | 142.4 | 127.0 | 148.1 | 167.6 | 11.0 | 14.6 |
| Chile | 13.4 | 60.4 | 43.2 | 39.5 | 64.7 | 166.1 | 10.9 | 65.4 |
| Panama | 12.4 | 24.1 | 21.4 | 8.8 | 0.4 | 107.8 | 7.1 | 54.0 |
| Morocco | 27.0 | 30.4 | 61.7 | 27.9 | 49.1 | 75.7 | 5.0 | 22.9 |
| Mexico | 12.9 | 10.8 | 25.0 | 9.0 | 16.2 | 75.3 | 4.9 | 42.3 |
| Canada (18th) | 16.1 | 8.9 | 12.1 | 12.4 | 11.3 | 9.2 | 0.6 | −10.5 |
| Lobster | 1,153.3 | 1,155.5 | 966.2 | 1,428.8 | 1,620.9 | 1,387.2 | 3.8 | |
| Inter-EU | 452.7 | 468.7 | 393.2 | 623.9 | 705.3 | 637.4 | 45.9 | 7.1 |
| United Kingdom | 230.8 | 231.4 | 191.8 | 277.4 | 292.7 | 290.6 | 20.9 | 4.7 |
| Canada | 230.2 | 254.9 | 211.3 | 290.4 | 331.3 | 231.5 | 16.7 | 0.1 |
| United States | 95.8 | 62.3 | 38.5 | 88.4 | 99.4 | 94.9 | 6.8 | −0.2 |
| Morocco | 14.0 | 16.8 | 13.0 | 20.3 | 27.5 | 31.6 | 2.3 | 17.7 |
| Bahamas | 25.4 | 22.8 | 48.4 | 46.8 | 47.3 | 20.4 | 1.5 | −4.4 |
|
Source: Eurostat, accessed by Global Trade Tracker, 2024 *CAGR: Compound Annual Growth Rate Note: Rankings exclude inter-EU trade. |
||||||||
| Product / Supplier | 2018 | 2019 | 2020 | 2021 | 2022 | 2023 | Share % in 2023 | CAGR* % 2018-2023 |
|---|---|---|---|---|---|---|---|---|
| Marine mammal oil | 0.4 | 0.8 | 1.1 | 1.3 | 1.4 | 1.4 | 31.0 | |
| Inter-EU | 0.3 | 0.5 | 0.8 | 1.2 | 1.4 | 1.4 | 99.1 | 37.3 |
| Sea urchin | 10.7 | 12.5 | 13.1 | 19.5 | 35.4 | 27.0 | 20.2 | |
| Inter-EU | 9.1 | 10.5 | 12.3 | 17.7 | 23.4 | 22.2 | 82.3 | 19.6 |
| Turkey | 0.0 | 0.2 | 0.2 | 1.2 | 11.5 | 3.7 | 13.9 | 185.1 |
| Chile | 0.1 | 0.3 | 0.0 | 0.2 | 0.5 | 1.8 | 37.9 | |
| Canada (3rd) | 0.5 | 0.4 | 0.3 | 0.5 | 0.3 | 0.5 | 1.7 | −1.2 |
| Fish fat and oil | 753.9 | 726.6 | 880.0 | 863.9 | 1,052.3 | 1,524.4 | 15.1 | |
| Inter-EU | 242.6 | 244.2 | 302.9 | 329.6 | 388.4 | 540.3 | 35.4 | 17.4 |
| Norway | 84.7 | 93.3 | 142.4 | 127.0 | 148.1 | 167.6 | 11.0 | 14.6 |
| Chile | 13.4 | 60.4 | 43.2 | 39.5 | 64.7 | 166.1 | 10.9 | 65.4 |
| Panama | 12.4 | 24.1 | 21.4 | 8.8 | 0.4 | 107.8 | 7.1 | 54.0 |
| Morocco | 27.0 | 30.4 | 61.7 | 27.9 | 49.1 | 75.7 | 5.0 | 22.9 |
| Mexico | 12.9 | 10.8 | 25.0 | 9.0 | 16.2 | 75.3 | 4.9 | 42.3 |
| Canada (18th) | 16.1 | 8.9 | 12.1 | 12.4 | 11.3 | 9.2 | 0.6 | −10.5 |
| Carp | 110.2 | 87.8 | 87.1 | 104.5 | 107.5 | 196.5 | 12.3 | |
| Inter-EU | 101.8 | 80.4 | 76.2 | 95.4 | 97.1 | 181.2 | 92.2 | 12.2 |
| Myanmar | 4.0 | 4.3 | 7.9 | 6.7 | 8.0 | 11.7 | 6.0 | 24.1 |
| Russia | 0.1 | 0.0 | 0.1 | 0.3 | 0.6 | 0.3 | ||
| Japan | 0.0 | 0.0 | 0.0 | 0.5 | 0.2 | 105.8 | ||
| Belarus | 0.8 | 0.2 | 0.7 | 0.4 | 0.4 | 0.2 | −10.4 | |
| Turkey | 0.0 | 0.0 | 0.0 | 0.2 | 0.7 | 0.4 | 0.2 | 58.8 |
| Fish liver and roe | 151.7 | 229.0 | 213.7 | 210.5 | 248.1 | 253.0 | 10.8 | |
| Inter-EU | 62.1 | 65.8 | 67.3 | 72.9 | 87.6 | 92.0 | 36.3 | 8.2 |
| United States | 18.7 | 49.8 | 37.7 | 34.7 | 45.5 | 48.3 | 19.1 | 20.9 |
| Iceland | 18.6 | 33.0 | 26.3 | 38.3 | 32.9 | 30.0 | 11.9 | 10.1 |
| Norway | 16.7 | 25.0 | 21.7 | 17.1 | 21.2 | 16.4 | 6.5 | −0.4 |
| Mauritania | 8.6 | 9.8 | 12.3 | 10.5 | 16.3 | 15.8 | 6.2 | 12.8 |
| Greenland | 7.0 | 12.9 | 17.8 | 11.2 | 9.6 | 10.7 | 4.2 | 8.8 |
| Canada (7th) | 1.8 | 4.5 | 5.7 | 2.7 | 5.2 | 6.6 | 2.6 | 30.0 |
| Coalfish | 455.7 | 499.0 | 458.2 | 496.0 | 700.6 | 708.3 | 9.2 | |
| Inter-EU | 190.4 | 203.8 | 192.9 | 218.1 | 301.5 | 322.5 | 45.5 | 11.1 |
| Norway | 75.9 | 95.1 | 92.2 | 89.1 | 153.6 | 177.5 | 25.1 | 18.5 |
| Iceland | 101.0 | 95.6 | 70.9 | 104.8 | 132.3 | 99.7 | 14.1 | −0.3 |
| Faroe Islands | 44.9 | 48.5 | 43.1 | 43.1 | 56.4 | 53.0 | 7.5 | 3.4 |
| China | 27.1 | 35.2 | 35.0 | 22.2 | 33.8 | 36.5 | 5.2 | 6.1 |
| United Kingdom | 14.1 | 20.0 | 22.8 | 17.8 | 14.5 | 10.1 | 1.4 | −6.6 |
| Pollack | 1,285.0 | 1,465.3 | 1,599.1 | 1,536.0 | 1,921.7 | 1,906.8 | 8.2 | |
| Inter-EU | 266.0 | 247.8 | 263.2 | 308.0 | 451.0 | 434.1 | 22.8 | 10.3 |
| China | 426.9 | 554.0 | 539.1 | 469.7 | 604.3 | 665.3 | 34.9 | 9.3 |
| Russia | 155.5 | 163.3 | 191.0 | 245.4 | 408.8 | 387.9 | 20.3 | 20.1 |
| United States | 426.1 | 487.4 | 590.2 | 504.4 | 426.5 | 385.5 | 20.2 | −2.0 |
| South Korea | 3.6 | 5.2 | 6.1 | 5.9 | 26.6 | 33.3 | 1.7 | 56.3 |
| Canada (5th) | 0.1 | 0.1 | 0.0 | 0.5 | 1.5 | 0.3 | 0.0 | 14.4 |
| Sea bream | 752.6 | 768.4 | 836.9 | 937.3 | 979.1 | 1,084.8 | 7.6 | |
| Inter-EU | 511.6 | 514.4 | 570.6 | 645.1 | 704.0 | 763.5 | 70.4 | 8.3 |
| Turkey | 181.9 | 198.9 | 217.4 | 234.6 | 223.6 | 255.8 | 23.6 | 7.1 |
| Morocco | 20.4 | 19.7 | 15.2 | 21.6 | 21.3 | 24.6 | 2.3 | 3.8 |
| Albania | 6.6 | 7.7 | 10.5 | 14.7 | 13.0 | 18.8 | 1.7 | 23.3 |
| Mauritania | 16.1 | 13.1 | 13.3 | 10.8 | 10.0 | 10.9 | 1.0 | −7.6 |
| Tunisia | 2.2 | 2.6 | 1.2 | 1.8 | 1.7 | 5.4 | 0.5 | 20.3 |
| Blue whiting | 77.3 | 77.5 | 91.3 | 112.5 | 52.9 | 105.2 | 6.4 | |
| Inter-EU | 35.9 | 38.3 | 60.4 | 51.9 | 29.0 | 66.6 | 63.3 | 13.2 |
| United Kingdom | 4.9 | 3.6 | 4.3 | 19.5 | 12.0 | 22.1 | 21.0 | 35.4 |
| Faroe Islands | 8.0 | 23.2 | 9.8 | 20.8 | 0.0 | 7.4 | 7.0 | −1.7 |
| Greenland | 5.1 | 4.5 | 4.9 | 6.8 | 3.1 | 5.6 | 5.3 | 1.8 |
| Norway | 23.1 | 7.9 | 12.0 | 10.0 | 6.9 | 2.6 | 2.4 | −35.6 |
| Iceland | 0.0 | 0.0 | 0.0 | 3.3 | 1.2 | 0.7 | 0.6 | 121.8 |
| Oysters | 176.1 | 182.5 | 148.3 | 202.8 | 242.7 | 239.2 | 6.3 | |
| Inter-EU | 164.1 | 172.3 | 139.5 | 191.1 | 232.9 | 233.2 | 97.5 | 7.3 |
| United Kingdom | 10.2 | 8.8 | 7.4 | 9.8 | 7.6 | 4.8 | 2.0 | −14.2 |
| South Korea | 1.1 | 0.8 | 1.2 | 1.3 | 1.4 | 0.8 | 0.3 | −6.1 |
| New Zealand | 0.1 | 0.2 | 0.1 | 0.3 | 0.4 | 0.2 | 0.1 | 4.9 |
| Canada (4th) | 0.3 | 0.2 | 0.1 | 0.2 | 0.2 | 0.1 | 0.1 | −16.9 |
|
Source: Eurostat, accessed by Global Trade Tracker, 2024 *CAGR: Compound Annual Growth Rate Note: Rankings exclude inter-EU trade. |
||||||||
Retail market
The EU's total fish and seafood volume sales were estimated at 3.8 million tons in 2023, including sales in retail channels, foodservices and institutional consumption. The EU's total fish and seafood volume sales decreased by 1.4% annually during the 2018 to 2023 period; however, it is forecasted to increase by 1.3% between 2023 and 2028. By total volume, Spain was the largest market with 901,000 tons in 2023. While Spain experienced a decrease in volume sales between 2018 and 2023, it is expected to experience an increase of 1.1% per year during the forecast period (2023 to 2028).
For retail value sales, among the 19 EU member states in the database, Italy recorded the largest retail value sales, reaching nearly US$8.3 billion in 2023. Italy's retail market saw moderate growth between 2018 and 2023, but is expected to experience slower growth during the forecast period. According to the forecast by Euromonitor International (2024), top 10 markets within the EU will see positive growth in retail value sales during the forecast period.
With respect to consumption, a person living in the EU consumed 24 kilograms (live weight) of fish and seafood annually on average, which was 3.3 kilograms more than the rest of the world. However, consumption levels vary across the EU-27 member states. For example, in Czech Republic, per capita fish and seafood consumption was 6 kilograms, whereas per capita consumption in Portugal was 59.9 kilograms based on 2019 data. With respect to types of fisheries, the EU reported three quarters of the fish or seafood consumed in the EU were wild catch and the remaining from aquaculture. Tuna, salmon and cod were identified as the most popular species for consumption (European Commission, 2022).
| Market / product | 2018 | 2023 | CAGR* % 2018-2023 | 2024 | 2028 | CAGR* % 2023-2028 |
|---|---|---|---|---|---|---|
| Spain | ||||||
| Fish and seafood total | 1,070.0 | 901.0 | −3.4 | 938.5 | 990.2 | 1.1 |
| Crustaceans | 153.0 | 136.6 | −2.2 | 139.5 | 142.7 | 0.5 |
| Fish | 680.6 | 575.2 | −3.3 | 600.6 | 636.4 | 1.2 |
| Molluscs and Cephalopods | 236.4 | 189.2 | −4.4 | 198.5 | 211.1 | 1.2 |
| Italy | ||||||
| Fish and seafood total | 521.9 | 553.4 | 1.2 | 561.6 | 593.0 | 1.1 |
| Crustaceans | 32.0 | 33.1 | 0.7 | 33.4 | 35.2 | 1.1 |
| Fish | 389.2 | 414.1 | 1.2 | 420.5 | 444.0 | 1.1 |
| Molluscs and Cephalopods | 100.7 | 106.3 | 1.1 | 107.6 | 113.9 | 1.1 |
| France | ||||||
| Fish and seafood total | 349.3 | 341.5 | −0.5 | 350.1 | 345.7 | −0.3 |
| Crustaceans | 19.4 | 18.3 | −1.2 | 18.8 | 18.4 | −0.4 |
| Fish | 193.5 | 194.0 | 0.1 | 199.5 | 199.5 | 0.0 |
| Molluscs and Cephalopods | 136.5 | 129.2 | −1.1 | 131.8 | 127.9 | −0.6 |
| Poland | ||||||
| Fish and seafood total | 337.0 | 339.7 | 0.2 | 348.6 | 376.9 | 1.6 |
| Crustaceans | 5.7 | 6.4 | 2.3 | 6.5 | 8.9 | 6.5 |
| Fish | 326.8 | 328.9 | 0.1 | 337.7 | 362.8 | 1.4 |
| Molluscs and Cephalopods | 4.5 | 4.4 | −0.4 | 4.4 | 5.2 | 3.4 |
| Germany | ||||||
| Fish and seafood total | 383.6 | 313.2 | −4.0 | 315.1 | 316.6 | 0.1 |
| Crustaceans | 37.3 | 37.1 | −0.1 | 37.5 | 38.4 | 0.5 |
| Fish | 315.3 | 249.0 | −4.6 | 250.8 | 253.3 | 0.2 |
| Molluscs and Cephalopods | 31.0 | 27.1 | −2.7 | 26.7 | 24.9 | −1.4 |
| Portugal | ||||||
| Fish and seafood total | 267.0 | 220.7 | −3.7 | 228.4 | 232.2 | 0.3 |
| Crustaceans | 36.1 | 31.8 | −2.5 | 32.2 | 31.7 | −0.3 |
| Fish | 172.0 | 142.7 | −3.7 | 147.9 | 151.0 | 0.4 |
| Molluscs and Cephalopods | 59.0 | 46.2 | −4.8 | 48.2 | 49.5 | 0.5 |
| Sweden | ||||||
| Fish and seafood total | 163.9 | 166.6 | 0.3 | 166.5 | 170.0 | 0.4 |
| Crustaceans | 11.2 | 11.3 | 0.2 | 11.6 | 12.1 | 0.8 |
| Fish | 150.9 | 153.6 | 0.4 | 153.3 | 156.3 | 0.4 |
| Molluscs and Cephalopods | 1.7 | 1.7 | 0.0 | 1.7 | 1.6 | −1.2 |
| Netherlands | ||||||
| Fish and seafood total | 150.8 | 130.0 | −2.9 | 131.0 | 131.5 | 0.1 |
| Crustaceans | 12.9 | 12.6 | −0.5 | 12.6 | 13.4 | 1.2 |
| Fish | 122.4 | 102.2 | −3.5 | 102.8 | 104.6 | 0.3 |
| Molluscs and Cephalopods | 15.6 | 15.3 | −0.4 | 15.6 | 13.6 | −2.7 |
| Bulgaria | ||||||
| Fish and seafood total | 120.5 | 116.0 | −0.8 | 118.2 | 127.1 | 1.5 |
| Crustaceans | 3.9 | 4.2 | 1.5 | 4.3 | 5.8 | 6.2 |
| Fish | 115.6 | 110.9 | −0.8 | 113.1 | 120.3 | 1.2 |
| Molluscs and Cephalopods | 0.9 | 0.9 | 0.0 | 0.9 | 1.0 | 2.1 |
| Romania | ||||||
| Fish and seafood total | 116.8 | 114.7 | −0.4 | 117.0 | 126.4 | 1.6 |
| Crustaceans | 3.6 | 4.0 | 2.1 | 4.0 | 5.5 | 6.6 |
| Fish | 112.6 | 110.0 | −0.5 | 112.3 | 120.2 | 1.4 |
| Molluscs and Cephalopods | 0.6 | 0.7 | 3.1 | 0.7 | 0.8 | 2.7 |
|
Source: Euromonitor International, 2024 *CAGR: Compound Annual Growth Rate |
||||||
| Market / product | 2018 | 2023 | CAGR* % 2018-2023 | 2024 | 2028 | CAGR* % 2023-2028 |
|---|---|---|---|---|---|---|
| Italy | ||||||
| Fish and seafood total | 6,317.0 | 8,268.7 | 5.5 | 8,641.6 | 9,922.2 | 2.8 |
| Crustaceans | 584.2 | 758.3 | 5.4 | 796.6 | 911.3 | 2.7 |
| Fish | 4,931.4 | 6,471.7 | 5.6 | 6,768.5 | 7,781.7 | 2.8 |
| Molluscs and Cephalopods | 801.4 | 1,038.7 | 5.3 | 1,076.5 | 1,229.2 | 2.7 |
| Spain | ||||||
| Fish and seafood total | 7,268.4 | 7,374.1 | 0.3 | 7,935.3 | 9,110.5 | 2.8 |
| Crustaceans | 1,382.1 | 1,402.4 | 0.3 | 1,466.1 | 1,567.6 | 1.3 |
| Fish | 4,295.1 | 4,442.6 | 0.7 | 4,812.7 | 5,650.3 | 3.3 |
| Molluscs and Cephalopods | 1,591.1 | 1,529.0 | −0.8 | 1,656.4 | 1,892.6 | 2.7 |
| Germany | ||||||
| Fish and seafood total | 3,928.8 | 4,720.9 | 3.7 | 4,686.8 | 5,095.5 | 1.7 |
| Crustaceans | 756.2 | 947.8 | 4.6 | 987.9 | 1,114.6 | 2.4 |
| Fish | 2,569.9 | 3,142.7 | 4.1 | 3,073.2 | 3,376.9 | 1.9 |
| Molluscs and Cephalopods | 602.7 | 630.3 | 0.9 | 625.7 | 604.0 | −0.7 |
| France | ||||||
| Fish and seafood total | 3,066.9 | 3,589.3 | 3.2 | 3,771.2 | 4,194.0 | 2.1 |
| Crustaceans | 198.4 | 238.4 | 3.7 | 248.9 | 271.8 | 1.8 |
| Fish | 2,202.2 | 2,616.3 | 3.5 | 2,755.8 | 3,071.3 | 2.2 |
| Molluscs and Cephalopods | 666.3 | 734.6 | 2.0 | 766.5 | 850.8 | 2.1 |
| Sweden | ||||||
| Fish and seafood total | 1,910.7 | 2,870.1 | 8.5 | 3,019.4 | 3,874.3 | 5.1 |
| Crustaceans | 154.4 | 221.5 | 7.5 | 234.0 | 316.5 | 6.2 |
| Fish | 1,739.4 | 2,627.8 | 8.6 | 2,763.9 | 3,533.9 | 5.0 |
| Molluscs and Cephalopods | 16.8 | 20.8 | 4.4 | 21.5 | 23.9 | 2.1 |
| Netherlands | ||||||
| Fish and seafood total | 2,155.7 | 2,546.0 | 3.4 | 2,660.2 | 2,853.7 | 1.4 |
| Crustaceans | 349.3 | 426.1 | 4.1 | 439.0 | 504.5 | 2.8 |
| Fish | 1,391.3 | 1,579.9 | 2.6 | 1,657.7 | 1,829.3 | 2.0 |
| Molluscs and Cephalopods | 415.2 | 540.0 | 5.4 | 563.5 | 519.9 | −1.6 |
| Poland | ||||||
| Fish and seafood total | 1,134.7 | 1,667.9 | 8.0 | 1,822.4 | 2,224.1 | 4.1 |
| Crustaceans | 42.5 | 65.6 | 9.1 | 65.1 | 94.8 | 7.8 |
| Fish | 1,043.3 | 1,544.9 | 8.2 | 1,698.2 | 2,053.3 | 3.9 |
| Molluscs and Cephalopods | 48.8 | 57.4 | 3.3 | 59.2 | 76.0 | 5.1 |
| Portugal | ||||||
| Fish and seafood total | 1,811.4 | 1,648.7 | −1.9 | 1,749.8 | 1,927.4 | 2.0 |
| Crustaceans | 326.7 | 314.4 | −0.8 | 328.4 | 343.3 | 0.9 |
| Fish | 1,087.1 | 993.0 | −1.8 | 1,056.0 | 1,181.6 | 2.3 |
| Molluscs and Cephalopods | 397.6 | 341.3 | −3.0 | 365.4 | 402.5 | 2.0 |
| Greece | ||||||
| Fish and seafood total | 1,266.3 | 1,532.4 | 3.9 | 1,563.2 | 1,730.5 | 2.1 |
| Crustaceans | 110.1 | 132.4 | 3.8 | 133.6 | 147.7 | 2.0 |
| Fish | 936.4 | 1,138.4 | 4.0 | 1,161.6 | 1,281.7 | 2.0 |
| Molluscs and Cephalopods | 219.8 | 261.6 | 3.5 | 268.0 | 301.0 | 2.3 |
| Ireland | ||||||
| Fish and seafood total | 775.6 | 1,153.5 | 8.3 | 1,224.0 | 1,584.7 | 5.3 |
| Crustaceans | 93.0 | 132.6 | 7.4 | 141.3 | 192.4 | 6.4 |
| Fish | 674.3 | 1,011.5 | 8.4 | 1,072.9 | 1,381.4 | 5.2 |
| Molluscs and Cephalopods | 8.4 | 9.5 | 2.5 | 9.8 | 10.9 | 2.2 |
|
Source: Euromonitor International, 2024 *CAGR: Compound Annual Growth Rate |
||||||
| Market | 2018 | 2023 | CAGR* % 2018-2023 | 2024 | 2028 | CAGR* % 2023-2028 |
|---|---|---|---|---|---|---|
| Germany | 56,070.2 | 83,822.8 | 8.4 | 88,750.6 | 101,549.0 | 2.7 |
| Italy | 50,317.3 | 61,038.3 | 3.9 | 63,914.2 | 78,704.3 | 4.3 |
| Sweden | 42,868.0 | 53,912.1 | 4.7 | 55,846.9 | 62,581.0 | 2.3 |
| Finland | 58,249.0 | 52,971.8 | −1.9 | 54,338.1 | 63,051.5 | 3.0 |
| Denmark | 29,358.6 | 40,826.6 | 6.8 | 43,141.1 | 54,226.2 | 4.7 |
| France | 25,956.3 | 34,721.1 | 6.0 | 36,334.9 | 40,969.4 | 2.4 |
| Netherlands | 25,219.9 | 32,516.2 | 5.2 | 34,433.4 | 41,624.3 | 3.9 |
| Poland | 15,603.6 | 22,588.0 | 7.7 | 24,902.5 | 32,929.7 | 5.7 |
| Greece | 11,968.8 | 20,194.5 | 11.0 | 19,427.1 | 21,543.7 | 2.1 |
| Lithuania[1] | 6,984.6 | 15,729.0 | 17.6 | 16,825.0 | 20,311.6 | 3.8 |
| Ireland | 10,151.4 | 11,823.8 | 3.1 | 12,315.6 | 13,705.9 | 2.2 |
| Belgium | 9,982.0 | 10,869.4 | 1.7 | 10,758.0 | 11,002.7 | 0.5 |
| Austria | 7,566.0 | 6,840.0 | −2.0 | 7,232.4 | 8,564.6 | 3.4 |
| Latvia[1] | 3,780.0 | 5,445.3 | 7.6 | 5,377.7 | 5,170.0 | −0.8 |
| Spain | 3,361.2 | 4,268.7 | 4.9 | 4,486.8 | 5,497.5 | 4.1 |
| Czech Republic | 3,741.3 | 4,247.7 | 2.6 | 4,305.6 | 4,891.8 | 2.6 |
| Hungary | 3,013.9 | 4,066.4 | 6.2 | 4,198.2 | 5,073.6 | 3.9 |
| Bulgaria | 2,318.0 | 3,889.5 | 10.9 | 4,100.1 | 5,466.8 | 5.9 |
| Slovakia | 3,338.5 | 3,587.6 | 1.4 | 3,624.0 | 4,022.8 | 2.1 |
| Slovenia[1] | 2,532.6 | 3,367.9 | 5.9 | 3,623.0 | 4,501.6 | 4.4 |
| Romania | 1,898.2 | 2,774.5 | 7.9 | 2,977.8 | 3,810.8 | 5.1 |
| Estonia | 1,481.8 | 1,802.2 | 4.0 | 1,893.1 | 2,133.6 | 2.4 |
| Croatia[1] | 1,139.7 | 1,338.8 | 3.3 | 1,391.8 | 1,543.1 | 2.1 |
| Cyprus[1] | 615.6 | 919.2 | 8.3 | 929.0 | 1,070.3 | 2.9 |
| Malta[1] | 608.3 | 831.5 | 6.5 | 891.8 | 1,069.6 | 3.7 |
| Luxembourg[1] | 494.0 | 626.8 | 4.9 | 655.4 | 779.1 | 3.5 |
| Portugal | 359.4 | 509.8 | 7.2 | 541.3 | 677.8 | 4.6 |
|
Source: Euromonitor International, 2024 *CAGR: Compound Annual Growth Rate 1: modelled data for both historic/ forecast market size |
||||||
Product launch analysis
Between January 2018 and December 2023, 13,930 new packaged fish and seafood products were launched in the EU market. Salmon and tuna were the two most popular fish and seafood ingredients.
| Year of release | 2018 | 2019 | 2020 | 2021 | 2022 | 2023 | Total |
|---|---|---|---|---|---|---|---|
| Total annual release | 2,153 | 2,134 | 2,338 | 2,243 | 2,435 | 2,627 | 13,930 |
| Top 10 company | |||||||
| Lidl | 184 | 206 | 240 | 223 | 198 | 202 | 1,253 |
| Carrefour | 21 | 31 | 35 | 38 | 53 | 45 | 223 |
| Albert Heijn | 37 | 42 | 36 | 19 | 17 | 11 | 162 |
| Iglo | 22 | 25 | 33 | 21 | 25 | 28 | 154 |
| Aldi | 28 | 45 | 31 | 14 | 14 | 21 | 153 |
| Aldi Süd | 17 | 29 | 49 | 28 | 15 | 10 | 148 |
| Bolton Food | 0 | 1 | 20 | 23 | 41 | 60 | 145 |
| Interdis | 8 | 10 | 24 | 39 | 24 | 36 | 141 |
| Bofrost | 19 | 21 | 20 | 26 | 28 | 19 | 133 |
| Aldi Nord | 23 | 21 | 27 | 8 | 3 | 30 | 112 |
| Distribution | |||||||
| Supermarket | 127 | 1,168 | 1,277 | 1,205 | 1,261 | 1,267 | 6,305 |
| Hypermarket | 718 | 681 | 680 | 556 | 627 | 750 | 4,012 |
| Internet / Mail Order | 18 | 29 | 97 | 148 | 193 | 189 | 674 |
| Department Store | 108 | 60 | 68 | 114 | 139 | 125 | 614 |
| Natural / Health Food Store | 71 | 55 | 76 | 69 | 66 | 53 | 390 |
| Gourmet Store | 35 | 38 | 57 | 63 | 39 | 48 | 280 |
| Specialist Retailer | 29 | 48 | 33 | 32 | 32 | 42 | 216 |
| Direct Selling | 22 | 29 | 26 | 29 | 35 | 28 | 169 |
| Convenience Store | 13 | 15 | 14 | 22 | 35 | 59 | 158 |
| Club Store | 0 | 0 | 0 | 0 | 1 | 56 | 57 |
| Branding | |||||||
| Branded | 374 | 1,220 | 1,336 | 1,357 | 1,545 | 1,619 | 7,451 |
| Private Label | 779 | 914 | 1002 | 886 | 890 | 1,008 | 5,479 |
| Import status | |||||||
| Imported | 437 | 414 | 455 | 362 | 288 | 308 | 2,264 |
| Not imported | 268 | 236 | 263 | 276 | 296 | 302 | 1,641 |
| Source: Mintel, 2024 | |||||||
| Year of release | 2018 | 2019 | 2020 | 2021 | 2022 | 2023 | Total |
|---|---|---|---|---|---|---|---|
| Launch type | |||||||
| New variety/Range extension | 116 | 1,036 | 1,103 | 1,070 | 1,104 | 1,191 | 5,620 |
| New packaging | 494 | 523 | 615 | 603 | 680 | 831 | 3,746 |
| New product | 433 | 447 | 480 | 443 | 522 | 473 | 2,798 |
| Relaunch | 91 | 113 | 116 | 120 | 125 | 126 | 691 |
| New formulation | 19 | 15 | 24 | 7 | 4 | 6 | 75 |
| Top 5 package type | |||||||
| Tray | 662 | 639 | 610 | 609 | 589 | 584 | 3,693 |
| Can | 436 | 466 | 555 | 533 | 587 | 686 | 3,263 |
| Skin pack | 301 | 308 | 360 | 389 | 439 | 491 | 2,288 |
| Flexible | 317 | 328 | 316 | 274 | 359 | 381 | 1,975 |
| Jar | 134 | 105 | 167 | 198 | 223 | 228 | 1,055 |
| Top 5 product claim | |||||||
| Ethical - Sustainable (Habitat/Resources) | 792 | 919 | 979 | 958 | 944 | 1,175 | 5,767 |
| Ethical - Environmentally Friendly Product | 793 | 907 | 977 | 940 | 893 | 1,126 | 5,636 |
| Ethical - Environmentally Friendly Package | 285 | 382 | 448 | 487 | 533 | 577 | 2,712 |
| Ethical - Recycling | 227 | 289 | 340 | 392 | 389 | 397 | 2,034 |
| Ease of Use | 284 | 309 | 256 | 260 | 315 | 334 | 1,758 |
| Source: Mintel, 2024 | |||||||
| Year of release | 2018 | 2019 | 2020 | 2021 | 2022 | 2023 | Total |
|---|---|---|---|---|---|---|---|
| Top 20 fish and seafood ingredient | |||||||
| Atlantic salmon | 268 | 233 | 258 | 321 | 295 | 398 | 1,773 |
| Salmon | 175 | 184 | 201 | 179 | 186 | 151 | 1,076 |
| Tuna | 84 | 123 | 150 | 114 | 133 | 138 | 742 |
| Skipjack tuna | 65 | 81 | 114 | 121 | 101 | 121 | 603 |
| Yellowfin tuna | 78 | 85 | 99 | 98 | 120 | 105 | 585 |
| Cod | 95 | 109 | 108 | 82 | 81 | 87 | 562 |
| Herring | 88 | 84 | 78 | 62 | 103 | 97 | 512 |
| Shellfish | 76 | 87 | 71 | 75 | 78 | 124 | 511 |
| Pacific pollack | 73 | 99 | 87 | 77 | 71 | 104 | 511 |
| Sardine | 77 | 83 | 84 | 85 | 75 | 90 | 494 |
| Prawn | 81 | 90 | 105 | 69 | 76 | 57 | 478 |
| White-leg shrimp | 71 | 64 | 64 | 66 | 77 | 96 | 438 |
| Shrimp | 83 | 86 | 61 | 60 | 53 | 73 | 416 |
| Mackerel | 71 | 41 | 49 | 46 | 51 | 72 | 330 |
| Rainbow trout | 32 | 50 | 50 | 71 | 55 | 58 | 316 |
| Squid | 60 | 45 | 48 | 39 | 45 | 61 | 298 |
| Albacore tuna | 31 | 31 | 43 | 65 | 58 | 59 | 287 |
| Mussel | 54 | 44 | 36 | 32 | 42 | 57 | 265 |
| European anchovy | 30 | 12 | 28 | 49 | 62 | 59 | 240 |
| Anchovy | 22 | 34 | 38 | 50 | 46 | 41 | 231 |
| Top 10 flavour | |||||||
| Unflavoured/ plain | 1,187 | 1,157 | 1,339 | 1,268 | 1,456 | 1,559 | 7,966 |
| Smoked | 235 | 221 | 272 | 294 | 272 | 279 | 1,573 |
| Tomato | 44 | 34 | 43 | 25 | 45 | 46 | 237 |
| Smoked (beechwood) | 22 | 28 | 23 | 28 | 45 | 71 | 217 |
| Salt/ salted | 20 | 16 | 28 | 40 | 28 | 35 | 167 |
| Marinade | 22 | 23 | 20 | 29 | 22 | 26 | 142 |
| Spice/ spicy | 19 | 25 | 14 | 13 | 16 | 19 | 106 |
| Escabeche | 16 | 15 | 10 | 15 | 17 | 26 | 99 |
| Lemon | 16 | 13 | 16 | 22 | 13 | 18 | 98 |
| Garlic | 18 | 23 | 18 | 13 | 9 | 16 | 97 |
| Source: Mintel, 2024 | |||||||
Product launch examples
Lobster Pearls (roe)
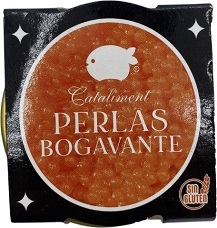
| Company | Cataliment |
|---|---|
| Sub-category | Fish products |
| Market | Spain |
| Launch type | New variety / range extension |
| Price | €4.49 |
Source: Mintel, 2024
Cataliment Perlas de Bogavante (Lobster Pearls) retail in a 100 gram jar. - Free from gluten - Lobster-based processed product - Pasteurized - Ideal to add to sushi, fish, pasta and salads.
Gourmet Deep Sea Scallops
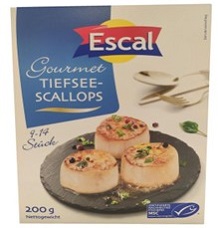
| Company | Escal |
|---|---|
| Sub-category | Fish products |
| Market | Germany |
| Launch type | New variety / range extension |
| Price | €11.99 |
Source: Mintel, 2024
Escal Gourmet Tiefsees-scallops (Gourmet Deep Sea Scallops) are described as raw, glazed and deep-frozen. The manufacturer claims that the product is of high quality and has tender meat with an exceptional taste. It is suitable for preparation of various festive dishes, can be eaten pure as a ceviche, briefly seared in the pan, tossed in butter or as a topping on salads, pasta dishes or as finger food. This premium product originated from MSC Certified Sustainable Fishery and retails in a 200 gram pack containing nine to 14 units, featuring preparation instructions and recipe suggestions.
Smoked Halibut

| Company | Salling Group |
|---|---|
| Sub-category | Fish products |
| Market | Denmark |
| Launch type | New variety / range extension |
| Price | €6.72 |
Source: Mintel, 2024
Salling Røget Hellefisk (Smoked Halibut) features halibut fillets that have been salted and smoked. The product retails in a 140 gram pack.
For more information
The Canadian Trade Commissioner Service:
International Trade Commissioners can provide Canadian industry with on-the-ground expertise regarding market potential, current conditions and local business contacts, and are an excellent point of contact for export advice.
More agri-food market intelligence:
International agri-food market intelligence
Discover global agriculture and food opportunities, the complete library of Global Analysis reports, market trends and forecasts, and information on Canada's free trade agreements.
Agri-food market intelligence service
Canadian agri-food and seafood businesses can take advantage of a customized service of reports and analysis, and join our email subscription service to have the latest reports delivered directly to their inbox.
More on Canada's agriculture and agri-food sectors:
Canada's agriculture sectors
Information on the agriculture industry by sector. Data on international markets. Initiatives to support awareness of the industry in Canada. How the department engages with the industry.
For additional information on Seafood Expo Global 2024, please contact:
Ben Berry, Deputy Director
Trade Show Strategy and Delivery
Agriculture and agri-food Canada
ben.berry@agr.gc.ca
Resources
- Global Trade Tracker, 2024
- Mintel Global New Products Database, 2024
- Facts and figures on the common fisheries policy, European Commission, 2022
Sector Trend Analysis – Fish and seafood trends in the European Union
Global Analysis Report
© His Majesty the King in Right of Canada, represented by the Minister of Agriculture and Agri-Food (2024).
Photo credits
All photographs reproduced in this publication are used by permission of the rights holders.
All images, unless otherwise noted, are copyright His Majesty the King in Right of Canada.
To join our distribution list or to suggest additional report topics or markets, please contact:
Agriculture and Agri-Food Canada, Global Analysis1341 Baseline Rd, Tower 5, 3rd floor
Ottawa ON K1A 0C5
Canada
Email: aafc.mas-sam.aac@agr.gc.ca
The Government of Canada has prepared this report based on primary and secondary sources of information. Although every effort has been made to ensure that the information is accurate, Agriculture and Agri-Food Canada (AAFC) assumes no liability for any actions taken based on the information contained herein.
Reproduction or redistribution of this document, in whole or in part, must include acknowledgement of agriculture and agri-food Canada as the owner of the copyright in the document, through a reference citing AAFC, the title of the document and the year. Where the reproduction or redistribution includes data from this document, it must also include an acknowledgement of the specific data source(s), as noted in this document.
Agriculture and Agri-Food Canada provides this document and other report services to agriculture and food industry clients free of charge.