

Note: This report includes forecasting data that is based on baseline historical data.
Executive summary
Consumers are interested in protein for a variety of reasons, including supporting overall health, muscle mass, energy levels, along with satiety. Consumers are gravitating towards lifestyles that emphasize low-fat, low-carbohydrate diets and 'clean eating', which have helped intensify the role of protein in their dietary choices. In the Europe, Middle East and Africa (EMEA) region, added/high-protein and plant-based claims continue to grow to address such health and environmental concerns - especially for those products that not only offer increased protein levels, but also deliver on "meat-like" taste.
In 2023, Germany imported a total of US$1.2 billion (616.0 thousand tonnes) of plant-based and animal protein ingredients from the world. The top global supplier markets for these protein ingredients to Germany were the Netherlands (25.2%), Denmark (9.2%), and the United States (8.7%) in 2023. Canada was the 20th largest market, supplying US$7.5 million (902 metric tonnes) over the year.
The market size in terms of volume sales for non-animal derived proteins in Germany accounted for 104.9 thousand tonnes (total protein market share: ~65%) in 2023, while animal derived proteins totaled 51.4 thousand tonnes (~32%). Demand for plant-based protein ingredients consisted mainly of gluten (46.1%), soy protein concentrate (23.4%), vegetable proteins (15.4%), pea protein (10.4%), and soy protein isolate (4.7%).
In 2023, plant-based packaged food products in Germany registered total value sales of US$659.5 million. The largest consumed plant-based food segments in terms of highest value sales were mainly within plant-based dairy products and alternatives at a total share of 89.8% (including milk, yogurt, cheese, dairy desserts, cream), plant-based ice cream (3.9%), and plant-based meat and seafood substitutes (3.7%) in the sector in 2023.
Products in Germany with a high source of protein ingredients (animal or non-animal derived) registered total packaged food sales of US$1.6 billion in 2023. Top high in protein food sub-categories that had the highest sales included dairy and plant-based products (including cheese, milk drinks, dairy desserts) at a total share of 33.8%, followed by processed meat, seafood and alternatives to meat (including tofu and derivatives) at 28.3%, and savoury snacks (including salty, nut and seed mixes, meat, seafood snacks) at 22.3% in 2023.
Global market overview and protein trends – focus on the European UnionFootnote 1
Globally, consumers link protein with various health benefits. Although, consuming meat is still the most natural way to obtain the proteins necessary for a balanced nutritional diet: taste, texture and cost are key barriers why consumers are moving towards choosing alternative proteins. The willingness to consume plant-based eating and alternative proteins have seen high growth, however, the category also faces similiar barriers - especially in taste, sensory and nutritional-related factors. The introduction of new technologies is helping to overcome these barriers for alternative proteins, making the category more attractive. Protein produced via precision fermentation is slowly swaying consumers toward the alternative protein category in a positive manner as its sensory and nutritional profiles produce a closer match to that of the equivalent animal product.
Furthermore, plant-based protein offerings are now available beyond the usual soy options, where innovative technologies for the extraction of protein from algae, fungi and insects (fungi-based meat) have also, helped to grow the category in various markets - in China 50% are more attracted to fungus-based meat, 78% of Thai consumers are interested in seaweed instead of meat protein and 21% of UK consumers are willing to try high-protein products made with insect proteins. Between 2013 and 2023, China (23%) had the highest number of granted patents related to alternative protein, followed by the United States (7%), Japan (5%), France (5%), and South Korea (5%).
Consumers also, understand the importance of sustainability. In Germany, 64% of German consumers prefer companies that reduce their CO2 emissions; while in the United States, 83% say they try to act in a way that is not harmful to the environment, and 73% of Indian consumers agree that vegan foods are better for the environment over animal-based food (including meat and dairy). However, in the European markets (2022) surveys suggest that the rising cost of living will make the sustainability of food and drink products less important and will need to become more cost-effective in the near future. Overall, there still is a need to educate consumers about the health, environmental and economic benefits of consuming insect protein, to boost its global interest.
Global consumer protein intake preferences and key consumer health-related trends include the following:Footnote 1
- Globally, 79% of consumers surveyed (n=1,605) who eat plant-based proteins like to eat any beans/legumes that are natural with the highest preference being grains like quinoa and millet (42%), other beans like black or cannellini (40%), lentils (38%), Garbanzo beans (35%), seeds like hemp and chia or soy (30%) and pea protein (22%). Those consumed less often (between 10-15%) were fava beans, algae like spirulina, fungus-based options like mycoprotein in Quorn, Seitan like wheat gluten, leaving none of these options for protein intake at 12%. Soy (38%) remains the most common alternative protein discussed in patents with other options being pea/chickpea (16%), rice (12%), legume (8%), potatoe (3%), oats (3%), maize (2%), rapeseed (2%) and others - including hemp, marine plants, algae, fungi, insects and protein via precision fermentation (17%).
- Almost half of Canadian consumers (40%) surveyed (n=2,000), believe that building/maintaining muscle mass is the most important reason to get enough protein in your diet. Comparably, 42% of German male consumers (n=2,000) agree that high-protein foods help to keep them fuller for longer (satiety), while 53% of consumers surveyed (n=3,000) in India place importance on the fact that protein helps in improving immunity health.
- Proteins from plants, insects and fungi are emerging in a large variety of food and drink launches such as Nu3 Cocoa-Macchiato Flavour Organic Vegan Protein Shake (Germany) made from pea protein isolate, sunflower seed/rice protein concentrate, and hemp protein; along with a pumpkin protein cocoa and maple syrup drink made with 55% plant soy isolate and pumpkin proteins by Chimpanzee - Le Natural (Germany). Chinese consumers (44%) are interested in plant-based protein-rich tea with almond, sesame, soybean ingredients; while UK consumers (31%) agree that high-protein products with plant proteins are more appealing over those made with animal protein and US consumers (16%) who eat plant-based proteins agree that they eat them for animal welfare reasons.
- Mimicking sensory qualities of meat matters: 37% of German meat substitute shoppers are more likely to purchase meat that closely ressembles a meaty texture, while Thai consumers (51%) would be motivated to eat more plant-based meat if they tasted similar to meat, and 55% of US consumers say they would eat more alternatives if they have the same nutritional profile as meat.
In the EMEA, the share of meat-flavoured meat substitute launches has grown in the region, with poultry flavours recording notable activity. Consumers are keen to limit their meat intake, but still enjoy meat flavours. While vegan, plant-based and flexitarian diets are increasingly prevalent and are becoming more mainstream in Europe as more consumers recognize the health and environmental benefits of reducing meat and dairy intake, many consumers (especially flexitarians) are not yet ready to forego the flavour of meat. In Germany, just under a third (30%) of meat substitute buyers say that they would opt for an alternative to meat with a meat-like taste/texture over one that didn't.Footnote 2
Fauna (meat, fish, shellfish) flavours have been growing rapidly in meat substitutes in Europe increasing from a 2% share of total category launches (5 years ago), to 16% in the last 12 months to August 2023. Fauna flavours are now the second most prevalent flavour component group in the meat substitutes category after fruit and vegetables, representing the following number of launch shares in Europe (Sept. 2022- Aug. 2023): meat (6%), poultry - led almost exclusively by chicken flavour (7%), and fish (2%).Footnote 2
Meat alternatives brands are also, moving beyond eco packaging and innovating around more holistic sustainable attributes. The share of ethical and environmental claims (ie; recyclable/compostable packaging, carbon neutral eggs using solar and wind energy, limit greenhouse gas emissions, upcycled barley leftovers from cafés) are growing among meat substitute and egg launches, as European consumers want to be informed about brands' initiatives surrounded around these company commitments - 28% of Italian consumers look for such information.Footnote 2
Trade overview
In 2023, Germany imported a total of US$1.2 billion (616.0 thousand tonnes) of plant-based and animal protein ingredients from the world (consisting of protein concentrates/substances, peptones and their derivatives, milk and egg or other albumins/albuminates - fit for human consumption, flour/meal/powder made from pea/bean/lentil or other dried leguminous vegetables, whey proteins and wheat gluten). The top protein imports were in peptones and other protein substances and its derivatives, n.e.s. (37.8%), whey and modified whey (16.4%) and protein concentrates and textured protein substances (11.9%) in 2023. Germany's protein imports have been increasing at a CAGR (2019-2023) of 7.5%, with the highest growths in dried egg albumin - fit for human consumption (+19.8%), followed by other peptones and other protein substances/derivatives (+14.8%), and albumins other than egg/milk - fit for human consumption (+13.6%); while whey and modified whey declined by a CAGR of 2.7%.
The top global suppliers of plant-based and protein ingredients to Germany were the Netherlands (25.2%), Denmark (9.2%), and the United States (8.7%) in 2023. While, Germany imported a total of US$7.5 million (902 metric tonnes) from Canada over the year at a value share of 0.7%, equivalent to being the 20th largest supplier to the country over the year.
| HS Code | Description | 2019 | 2020 | 2021 | 2022 | 2023 | CAGR* % 2019-2023 |
|---|---|---|---|---|---|---|---|
| Total - imports from the world | 863.2 | 915.2 | 1,121.0 | 1,322.7 | 1,151.9 | 7.5 | |
| 350400 | Peptones and other protein substances and its derivatives, not specified elsewhere | 250.7 | 275.8 | 326.4 | 446.0 | 435.7 | 14.8 |
| 040410 | Whey and modified whey | 211.2 | 206.8 | 257.6 | 276.2 | 189.0 | −2.7 |
| 210610 | Protein concentrates and textured protein substances | 79.6 | 92.7 | 112.8 | 119.0 | 124.6 | 11.9 |
| 35019090 | Caseinates and other casein derivatives (excluding casein glues) | 91.9 | 104.1 | 115.1 | 135.7 | 117.5 | 6.3 |
| 350220 | Milk albumin, >80% proteins by weight (including concentrates of 2 or more whey proteins) | 91.3 | 88.7 | 108.7 | 133.8 | 103.0 | 3.0 |
| 35011090 | Casein for manufacture of foodstuffs and fodder | 61.7 | 69.5 | 95.3 | 111.8 | 69.2 | 2.9 |
| 110900 | Wheat gluten, whether or not dried | 49.3 | 44.1 | 46.9 | 46.6 | 58.9 | 4.5 |
| 35021190 | Egg albumin, dried (for example; sheets, scales, flakes, powders), fit for human consumption | 11.8 | 11.4 | 13.4 | 20.4 | 24.3 | 19.8 |
| 110610 | Flour, meal and powder of peas, beans, lentils and the other dried leguminous vegetables of heading 0713 | 4.8 | 10.5 | 31.2 | 16.0 | 11.7 | 24.9 |
| 35029070 | Albumins, fit for human consumption (excluding egg and milk albumins) | 6.7 | 5.8 | 8.9 | 9.9 | 11.1 | 13.6 |
| 35021990 | Egg albumin, fit for human consumption (excluding dried) | 4.2 | 5.8 | 4.6 | 7.3 | 6.8 | 13.2 |
|
Source: Global trade tracker, 2024 *CAGR: Compound Annual Growth Rate |
|||||||
| HS Code | Description | 2019 | 2020 | 2021 | 2022 | 2023 | CAGR* % 2019-2023 |
|---|---|---|---|---|---|---|---|
| Total - imports from the world | 723,547 | 681,902 | 715,450 | 670,287 | 616,047 | −3.9 | |
| 040410 | Whey and modified whey | 581,195 | 534,574 | 561,926 | 518,219 | 469,575 | −5.2 |
| 350400 | Peptones and other protein substances and its derivatives, not specified elsewhere | 42,334 | 43,786 | 44,731 | 50,247 | 48,840 | 3.6 |
| 210610 | Protein concentrates and textured protein substances | 18,684 | 22,383 | 23,718 | 27,751 | 24,990 | 7.5 |
| 110900 | Wheat gluten, whether or not dried | 31,891 | 30,782 | 29,585 | 24,063 | 21,992 | −8.9 |
| 350220 | Milk albumin, >80% proteins by weight (including concentrates of 2 or more whey proteins) | 15,624 | 14,865 | 15,628 | 14,677 | 19,422 | 5.6 |
| 35019090 | Caseinates and other casein derivatives (excluding casein glues) | 12,029 | 11,865 | 11,490 | 9,873 | 8,447 | −8.5 |
| 110610 | Flour, meal and powder of peas, beans, lentils and the other dried leguminous vegetables of heading 0713 | 3,100 | 4,698 | 10,561 | 8,798 | 8,098 | 27.1 |
| 35011090 | Casein for manufacture of foodstuffs and fodder | 10,367 | 9,387 | 11,079 | 10,028 | 7,756 | −7.0 |
| 35021990 | Egg albumin, dried (eg; sheets, scales, flakes, powders), fit for human consumption | 6,590 | 7,872 | 5,062 | 4,858 | 5,435 | −4.7 |
| 35021190 | Egg albumin, dried (eg; sheets, scales, flakes, powders), fit for human consumption | 1,709 | 1,652 | 1,615 | 1,692 | 1,426 | −4.4 |
| 35029070 | Albumins, fit for human consumption (excluding egg and milk albumins) | 24 | 38 | 55 | 81 | 66 | 28.8 |
|
Source: Global trade tracker, 2024 *CAGR: Compound Annual Growth Rate |
|||||||
| Country | 2019 | 2020 | 2021 | 2022 | 2023 | CAGR* % 2019-2023 | Market share % in 2023 |
|---|---|---|---|---|---|---|---|
| Total - global suppliers | 863.2 | 915.2 | 1,121.0 | 1,322.7 | 1,151.9 | 7.5 | 100.0 |
| 1. Netherlands | 214.1 | 238.2 | 293.4 | 334.0 | 290.2 | 7.9 | 25.2 |
| 2. Denmark | 64.1 | 67.8 | 84.8 | 110.2 | 106.0 | 13.4 | 9.2 |
| 3. United States | 89.6 | 97.8 | 52.7 | 74.7 | 100.5 | 2.9 | 8.7 |
| 4. France | 73.9 | 82.1 | 105.5 | 117.3 | 98.8 | 7.5 | 8.6 |
| 5. Austria | 61.9 | 64.5 | 85.3 | 122.3 | 88.9 | 9.5 | 7.7 |
| 6. Ireland | 62.7 | 58.7 | 89.0 | 92.3 | 80.0 | 6.3 | 6.9 |
| 7. Switzerland | 19.9 | 25.9 | 31.6 | 45.8 | 45.1 | 22.8 | 3.9 |
| 8. Italy | 39.3 | 39.0 | 59.0 | 63.6 | 44.9 | 3.4 | 3.9 |
| 9. Belgium | 43.5 | 37.6 | 46.0 | 40.9 | 43.4 | −0.1 | 3.8 |
| 10. Lituania | 18.1 | 20.4 | 29.6 | 44.6 | 37.8 | 20.2 | 3.3 |
| Subtotal - top 10 suppliers | 686.9 | 732.1 | 877.0 | 1,045.7 | 935.6 | 8.0 | 81.2 |
| European Union 27 | 629.3 | 673.2 | 897.3 | 1,046.2 | 887.5 | 9.0 | 77.0 |
| Canada (20th) | 1.4 | 3.4 | 6.1 | 9.7 | 7.5 | 53.6 | 0.7 |
|
Source: Global trade tracker, 2024 *CAGR: Compound Annual Growth Rate |
|||||||
| Country | 2019 | 2020 | 2021 | 2022 | 2023 | CAGR* % 2019-2023 | Market share % in 2023 |
|---|---|---|---|---|---|---|---|
| Total - global suppliers | 723,550 | 681,901 | 715,448 | 670,286 | 616,048 | −3.9 | 100.0 |
| 1. Austria | 262,945 | 247,574 | 244,150 | 257,813 | 215,394 | −4.9 | 35.0 |
| 2. Netherlands | 137,761 | 128,555 | 156,886 | 131,408 | 129,106 | −1.6 | 21.0 |
| 3. Italy | 94,982 | 75,497 | 68,836 | 64,053 | 53,382 | −13.4 | 8.7 |
| 4. Belgium | 39,767 | 33,344 | 38,031 | 34,110 | 37,735 | −1.3 | 6.1 |
| 5. France | 36,215 | 42,221 | 52,930 | 39,040 | 35,584 | −0.4 | 5.8 |
| 6. Czech Republic | 16,153 | 17,367 | 20,656 | 23,656 | 35,405 | 21.7 | 5.7 |
| 7. Denmark | 34,714 | 34,106 | 32,240 | 18,347 | 19,550 | −13.4 | 3.2 |
| 8. Poland | 32,306 | 28,080 | 29,974 | 24,737 | 18,425 | −13.1 | 3.0 |
| 9. China | 8,241 | 9,086 | 10,154 | 12,164 | 12,126 | 10.1 | 2.0 |
| 10. Ireland | 12,018 | 10,075 | 14,463 | 14,075 | 11,765 | −0.5 | 1.9 |
| Subtotal - top 10 suppliers | 675,102 | 625,905 | 668,320 | 619,403 | 568,472 | −4.2 | 92.3 |
| European Union 27 | 681,365 | 634,582 | 679,896 | 633,836 | 580,541 | −3.9 | 94.2 |
| Canada (25th) | 328 | 497 | 1,003 | 1,161 | 902 | 28.8 | 0.1 |
|
Source: Global trade tracker, 2024 *CAGR: Compound Annual Growth Rate |
|||||||
Canada's performance
According to Germany, the country imported a total of Can$10.2 million (902.3 metric tonnes) plant-based and protein ingredients from Canada in 2023, increasing by a CAGR of 54.4% (2019-2023). The majority of plant-based or protein ingredients that Canada supplied to Germany were peptones and other protein substances and their derivatives (HS:350400) at Can$10,167.1 thousand (CAGR: 58%), followed by smaller amounts of protein concentrates and textured protein substances (HS:210610) at Can$22.0 thousand (CAGR: 11.8%), flour, meal and powder of peas/beans/lentils and other dried leguminous vegetables (HS:110610) at Can$4.6 thousand (CAGR: −27.7%) and whey/modified whey (HS:040410) at Can$2.9 thousand (CAGR: −62.5%) in 2023.
| HS Code | Description | 2019 | 2020 | 2021 | 2022 | 2023 | CAGR* % 2019-2023 |
|---|---|---|---|---|---|---|---|
| Total - imports from Canada | 1,790.8 | 4,552.4 | 7,592.8 | 12,577.9 | 10,196.6 | 54.5 | |
| 350400 | Peptones and other protein substances and their derivatives, not specified elsewhere | 1,631.5 | 4,486.4 | 6,887.4 | 12,417.9 | 10,167.1 | 58.0 |
| 210610 | Protein concentrates and textured protein substances | 14.1 | 23.2 | 21.4 | 132.3 | 22.0 | 11.8 |
| 110610 | Flour, meal and powder of peas, beans, lentils and the other dried leguminous vegetables of heading 0713 | 0.0 | 12.2 | 664.2 | 25.6 | 4.6 | −27.7 |
| 040410 | Whey and modified whey | 145.2 | 29.6 | 19.9 | 0.781 | 2.9 | −62.5 |
| 350220 | Milk albumin, >80% proteins by weight (including concentrates of 2 or more whey proteins) | 0.0 | 0.963 | 0.0 | 0.0 | 0.0 | −100.0 |
| 110900 | Wheat gluten, whether or not dried | 0.006 | 0.0 | 0.0 | 1.4 | 0.0 | −100.0 |
|
Source: Global trade tracker, 2024 *CAGR: Compound Annual Growth Rate |
|||||||
| HS Code | Description | 2019 | 2020 | 2021 | 2022 | 2023 | CAGR* % 2019-2023 |
|---|---|---|---|---|---|---|---|
| Total - imports from Canada | 328,012 | 497,307 | 1,003,489 | 1,160,775 | 902,262 | 28.8 | |
| 350400 | Peptones and other protein substances and their derivatives, not specified elsewhere | 193,220 | 490,196 | 831,568 | 1,147,685 | 899,185 | 46.9 |
| 210610 | Protein concentrates and textured protein substances | 780 | 1,028 | 1,614 | 10,041 | 2,350 | 31.7 |
| 110610 | Flour, meal and powder of peas, beans, lentils and the other dried leguminous vegetables of heading 0713 | 0 | 2,002 | 167,616 | 2,419 | 606 | −32.9 |
| 040410 | Whey and modified whey | 134,012 | 4,070 | 2,691 | 452 | 121 | −82.7 |
| 350220 | Milk albumin, >80% proteins by weight (including concentrates of 2 or more whey proteins) | 0 | 11 | 0 | 0 | 0 | 0 |
| 110900 | Wheat gluten, whether or not dried | 0 | 0 | 0 | 178 | 0 | 0 |
|
Source: Global trade tracker, 2024 *CAGR: Compound Annual Growth Rate |
|||||||
Market sizes
In 2024, the market size of animal derived protein ingredients in Germany registered a volume sales of 51.4 thousand tonnes (total proteins share: 31.7%), equivalent to an historical volume sales CAGR of −0.2% (2019 to 2024) and a forecast CAGR of −0.2% (2024-2029) slightly set to decline to 51.0 thousand tonnes by 2029. In 2024, the majority of the animal derived protein market consisted of 41.8% of caseinates (21.5 thousand tonnes), followed by 39.1% of whey protein concentrate (20.1 thousand tonnes), 12.1% of gelatin (6.2 thousand tonnes), 2.9% of egg whites (1.5 thousand tonnes), 2.7% of milk protein concentrates (1.4 thousand tonnes); with smaller market sizes consisting of 0.6% of whey protein isolate (293.9 tonnes), 0.5% of casein (268.9 tonnes), 0.4% of albumin (194.3 tonnes), and 0.001% of milk protein isolates (0.4 tonnes). Sales of hydrolysed keratins that may contain non-animal derived proteins totaled 275.5 tonnes in 2024.
| Category | 2019 | 2024 | CAGR* % 2019-2024 | 2025 | 2029 | CAGR* % 2024-2029 |
|---|---|---|---|---|---|---|
| Total - proteins | 138,823.4 | 162,232.2 | 3.2 | 165,128.7 | 173,897.0 | 1.4 |
| Subtotal - animal derived proteins | 52,026.1 | 51,410.1 | −0.2 | 51,259.9 | 51,023.8 | −0.2 |
| Albumin | 188.0 | 194.3 | 0.7 | 195.4 | 199.4 | 0.5 |
| Casein | 254.8 | 268.9 | 1.1 | 285.0 | 341.5 | 4.9 |
| Caseinates | 22,243.3 | 21,478.4 | −0.7 | 21,362.0 | 20,901.1 | −0.5 |
| Egg white | 1,263.5 | 1,468.8 | 3.1 | 1,494.8 | 1,585.7 | 1.5 |
| Gelatin | 6,365.9 | 6,239.3 | −0.4 | 6,180.2 | 6,101.5 | −0.4 |
| Milk protein concentrate | 1,261.0 | 1,368.9 | 1.7 | 1,385.6 | 1,459.0 | 1.3 |
| Milk protein isolate | 0.4 | 0.4 | 0.0 | 0.4 | 0.4 | 0.0 |
| Whey protein concentrate | 20,145.6 | 20,097.2 | −0.05 | 20,058.8 | 20,116.6 | 0.02 |
| Whey protein isolate | 303.6 | 293.9 | −0.6 | 297.8 | 318.7 | 1.6 |
| *Hydrolysed keratins[1] | 246.7 | 275.5 | 2.2 | 280.9 | 293.3 | 1.3 |
|
Source: Euromonitor International, 2024 *CAGR: Compound Annual Growth Rate 1: Note that this category is not all inclusive since non-animal derived proteins may be included in this more ambiguous category "Hydrolysed Keratins", (therefore is not included in animal derived volume total). |
||||||
In 2024, packaged food products containing animal derived protein ingredients in Germany totalled a volume sales of 49.4 thousand tonnes, which have been declining by a CAGR of 0.3% (2019 to 2024) and is forecast to decline by 1.5% (2024 to 2029) down to 48.7 thousand tonnes in 2029. Demand in Germany for animal derived protein packaged food in terms of volume sales (containing a total animal derived protein breakdown in ingredients of 96.1%) were highest within the dairy products packaged food category at a protein breakdown of 67.4% (34.6 thousand tonnes), especially for animal protein found in yogurt and sour milk at 40.6% within the packaged food sector in 2024. Snacks were the second highest category in demand for animal derived protein ingredients at sales of 23.7% (12.2 thousand tonnes), mostly within confectionery products at a packaged food share of 15.3% and ice cream and frozen yogurt (7.0%) in 2024. Staple foods were the next in demand over the year at sales of 3.1% (1.6 thousand tonnes) mostly within the baked goods sub-category at 2.2%, followed by the cooking ingredients and meals category at a total of 2.0% share in sales (1.0 thousand tonnes) mostly for ready meals, pizza and soup accounting for 1.5% of animal derived protein ingredients in the packaged food sector in 2024.
Sales of ready-to-drink (RTDs) coffee products and other malt-based hot drinks totalled a volume of 1.2 thousand tonnes in 2024. The overall drink category declined by a volume CAGR of 0.04% (2019 to 2024), which is expected to turn around and grow by a volume CAGR of 2.2% (2024 to 2029) to reach sales of 1.5 thousand tonnes by 2029.
| Category | Data type | 2019 | 2024 | CAGR* % 2019-2024 | 2025 | 2029 | CAGR* % 2024-2029 |
|---|---|---|---|---|---|---|---|
| Total - animal derived protein ingredients | Total volume | 52,026.1 | 51,410.1 | −0.2 | 51,259.9 | 51,023.8 | −0.2 |
| % breakdown | 37.5 | 31.7 | −3.3 | 31.0 | 29.3 | −1.5 | |
| Total - packaged food proteins | Total volume | 50,216.2 | 49,410.9 | −0.3 | 49,195.1 | 48,667.4 | −0.3 |
| % breakdown | 96.5 | 96.1 | −0.1 | 96.0 | 95.4 | −0.1 | |
| Snacks : | Total volume | 12,330.2 | 12,167.8 | −0.3 | 12,137.1 | 12,187.1 | 0.03 |
| % breakdown | 23.7 | 23.7 | 0.0 | 23.7 | 23.9 | 0.2 | |
| Confectionery | Total volume | 7,911.8 | 7,874.5 | −0.1 | 7,823.5 | 7,783.0 | −0.2 |
| % breakdown | 15.2 | 15.3 | 0.1 | 15.3 | 15.3 | 0.0 | |
| Ice cream and frozen yogurt | Total volume | 3,725.1 | 3,612.4 | −0.6 | 3,591.3 | 3,529.7 | −0.5 |
| % breakdown | 7.2 | 7.0 | −0.6 | 7.0 | 6.9 | −0.3 | |
| Savoury snacks: salty, seafood, other | Total volume | 55.3 | 58.7 | 1.2 | 59.1 | 63.2 | 1.5 |
| % breakdown | 0.1 | 0.1 | 0.0 | 0.1 | 0.1 | 0.0 | |
| Protein/energy bars | Total volume | 637.9 | 622.3 | −0.5 | 663.1 | 811.2 | 5.4 |
| % breakdown | 1.2 | 1.2 | 0.0 | 1.3 | 1.6 | 5.9 | |
| Dairy products : | Total volume | 35,465.4 | 34,629.8 | −0.5 | 34,422.2 | 33,722.1 | −0.5 |
| % breakdown | 68.2 | 67.4 | −0.2 | 67.2 | 66.1 | −0.4 | |
| Baby food and milk formula | Total volume | 32.3 | 31.6 | −0.4 | 31.5 | 30.7 | −0.6 |
| % breakdown | 0.1 | 0.1 | 0.0 | 0.1 | 0.1 | 0.0 | |
| Cheese: spreadable, processed | Total volume | 5,020.7 | 5,679.2 | 2.5 | 5,730.9 | 6,170.4 | 1.7 |
| % breakdown | 9.7 | 11.0 | 2.5 | 11.2 | 12.1 | 1.9 | |
| Yogurt and sour milk | Total volume | 22,343.3 | 20,860.9 | −1.4 | 20,576.2 | 19,353.6 | −1.5 |
| % breakdown | 42.9 | 40.6 | −1.1 | 40.1 | 37.9 | −1.4 | |
| Other dairy: desserts, coffee whiteners, condensed/evaporated milk, fresh cheese and quark | Total volume | 8,069.0 | 8,058.1 | 0.0 | 8,083.5 | 8,167.3 | 0.3 |
| % breakdown | 15.5 | 15.7 | 0.3 | 15.8 | 16.0 | 0.4 | |
| Cooking ingredients and meals : | Total volume | 962.5 | 1,026.1 | 1.3 | 1,034.3 | 1,081.4 | 1.1 |
| % breakdown | 1.9 | 2.0 | 1.0 | 2.0 | 2.1 | 1.0 | |
| Ready meals, pizza, soup | Total volume | 706.2 | 758.0 | 1.4 | 764.0 | 801.8 | 1.1 |
| % breakdown | 1.4 | 1.5 | 1.4 | 1.5 | 1.6 | 1.3 | |
| Sauces, dips and other condiments | Total volume | 256.4 | 268.0 | 0.9 | 270.3 | 279.6 | 0.9 |
| % breakdown | 0.5 | 0.5 | 0.0 | 0.5 | 0.5 | 0.0 | |
| Staple foods : | Total volume | 1,458.1 | 1,587.2 | 1.7 | 1,601.5 | 1,676.9 | 1.1 |
| % breakdown | 2.8 | 3.1 | 2.1 | 3.1 | 3.3 | 1.3 | |
| Baked goods; cakes, pastries, sweet/frozen pies and tarts | Total volume | 1,177.1 | 1,142.4 | −0.6 | 1,140.2 | 1,159.7 | 0.3 |
| % breakdown | 2.3 | 2.2 | −0.9 | 2.2 | 2.3 | 0.9 | |
| Frozen processed potatoes | Total volume | 104.4 | 106.7 | 0.4 | 107.5 | 114.1 | 1.4 |
| % breakdown | 0.2 | 0.2 | 0.0 | 0.2 | 0.2 | 0.0 | |
| Processed meat and meat and frozen seafood substitutes | Total volume | 176.7 | 338.1 | 13.9 | 353.8 | 403.1 | 3.6 |
| % breakdown | 0.3 | 0.7 | 18.5 | 0.7 | 0.8 | 2.7 | |
| Ready-to-drink coffee and other malt-based hot drinks : | Total volume | 1,236.4 | 1,233.8 | −0.04 | 1,272.0 | 1,470.5 | 2.2 |
| % breakdown | 2.4 | 2.4 | 0.0 | 2.5 | 2.9 | 3.9 | |
|
Source: Euromonitor, 2024 *CAGR: Compound Annual Growth Rate |
|||||||
In 2024, the market size of plant-based protein ingredients (non-animal derived) in Germany registered sales of 104.9 thousand tonnes (total proteins share: 64.7%), equivalent to an historical volume sales CAGR of 5.2% (2019-2024) and a forecast CAGR of 2.2% (2024-2029) set to reach 116.8 thousand tonnes by 2029. In 2024, 46.1% of non-animal derived protein ingredients consisted of gluten (48.4 thousand tonnes), followed by 23.4% of soy protein concentrate (24.5 thousand tonnes), 15.4% of vegetable proteins (16.1 thousand tonnes), 10.4% pea protein (10.9 thousand tonnes), and 4.7% of soy protein isolate (5.0 thousand tonnes). Noting that protein hydrolysates (694.3 tonnes) and other proteins (4.9 thousand tonnes) were not included in the protein total share since these categories may not necessarily contain all inclusively non-animal derived ingredients. However, typically these proteins do come from plant, pulse or cereal sources.
Historically, volume sales of vegetable proteins and pea protein have been growing by the highest rates at CAGRs of 25.5% and 9.1%, respectively between 2019 and 2024. In the forecast period (2024-2029), vegetable proteins (CAGR: +6.1%) and pea protein (CAGR: +4.3%) are expected to continue to grow the most, yet at a slower rate.
| Category | 2019 | 2024 | CAGR* % 2019-2024 | 2025 | 2029 | CAGR* % 2024-2029 |
|---|---|---|---|---|---|---|
| Total - proteins | 138,823.4 | 162,232.2 | 3.2 | 165,128.7 | 173,897.0 | 1.4 |
| Subtotal - non-animal derived proteins[1] | 81,490.7 | 104,904.8 | 5.2 | 107,904.0 | 116,741.6 | 2.2 |
| Gluten | 45,604.1 | 48,379.0 | 1.2 | 48,658.3 | 49,648.4 | 0.5 |
| Pea protein | 7,045.9 | 10,890.8 | 9.1 | 11,306.3 | 13,467.8 | 4.3 |
| Soy protein concentrate | 18,906.1 | 24,528.9 | 5.3 | 25,133.9 | 26,884.0 | 1.9 |
| Soy protein isolate | 4,748.0 | 4,964.3 | 0.9 | 4,969.9 | 5,018.2 | 0.2 |
| Vegetable proteins | 5,186.7 | 16,141.8 | 25.5 | 17,835.6 | 21,723.2 | 6.1 |
| Protein hydrolysates[1] | 665.7 | 694.3 | 0.8 | 697.6 | 717.1 | 0.6 |
| Other proteins[1] | 4,394.2 | 4,947.6 | 2.4 | 4,986.3 | 5,121.3 | 0.7 |
|
Source: Euromonitor International, 2024 *CAGR: Compound Annual Growth Rate 1: Non-animal derived proteins - Note that this category is not all inclusive since non-animal derived proteins may be used in the more ambiguous categories 'Hydrolysed Keratins,' 'Protein Hydrolysates' and 'Other Proteins' (therefore is not included in total non-animal volume). Typically, however, these proteins come from plant, pulse or cereal sources. |
||||||
In 2024, packaged food products containing plant-based protein ingredients in Germany registered volume sales of 75.6 thousand tonnes, which have been increasing by a CAGR of 6.4% (2019 to 2024) and is forecast to slow down to a CAGR of 2.4% (2024 to 2029) to reach 85.3 thousand tonnes in 2029. In 2024, demand in Germany for non-animal derived protein packaged food products in terms of volume sales (containing a total plant-based derived protein breakdown in ingredients of 72.1%) were highest within the staple food products at a plant-based protein breakdown of 66.2% (69.5 thousand tonnes), especially for plant-based protein found in baked goods (33.2%) and processed meat and seafood substitutes (including tofu and derivatives) at 32.8% within the packaged food sector. Cooking ingredients and meal products were the second highest category in volume demand for non-animal derived protein ingredients at sales of 3.1% (3.2 thousand tonnes), specifically protein found in plant-based ready meals (2.8%) within the packaged food sector in 2024. Dairy products and alternatives were next in demand at sales of 2.5% (2.6 thousand tonnes), mostly for plant-based dairy products such as soy drinks, yoghurt and cheese (1.7%) within the sector over the year. Lastly, was the snacks category at a 0.3% sales volume share (338.4 tonnes) mostly for protein found in plant-based ice cream (0.3%) in 2024.
Asian specialty drink products derived from non-animal protein ingredients totalled a smaller volume of sales in Germany of 22.5 tonnes in 2024. However, this category type of Asian plant-based drinks are forecast to continue to decrease by a CAGR of 1.2% (2024 to 2029) to decline in sales down to 21.2 tonnes by 2029.
| Category | Data type | 2019 | 2024 | CAGR* % 2019-2024 | 2025 | 2029 | CAGR* % 2024-2029 |
|---|---|---|---|---|---|---|---|
| Total - plant-based derived protein ingredients | Total volume | 81,490.7 | 104,904.8 | 5.2 | 107,904.0 | 116,741.6 | 2.2 |
| % breakdown | 58.7 | 64.7 | 2.0 | 65.3 | 67.1 | 0.8 | |
| Total - packaged food proteins | Total volume | 55,498.0 | 75,634.8 | 6.4 | 78,352.0 | 85,324.0 | 2.4 |
| % breakdown | 68.1 | 72.1 | 1.1 | 72.6 | 73.1 | 0.3 | |
| Snacks: | Total volume | 270.6 | 338.4 | 4.6 | 350.0 | 379.0 | 2.3 |
| % breakdown | 0.3 | 0.3 | 0.0 | 0.3 | 0.3 | 0.0 | |
| Ice cream | Total volume | 183.5 | 248.5 | 6.3 | 257.9 | 276.0 | 2.1 |
| % breakdown | 0.2 | 0.2 | 0.0 | 0.2 | 0.2 | 0.0 | |
| Savoury snacks: salty, meat and seafood, other | Total volume | 62.2 | 65.4 | 1.0 | 66.1 | 71.2 | 1.7 |
| % breakdown | 0.1 | 0.1 | 0.0 | 0.1 | 0.1 | 0.0 | |
| Cereal and protein/energy bars | Total volume | 25.0 | 24.5 | −0.4 | 26.0 | 31.7 | 5.3 |
| % breakdown | 0.0 | 0.0 | 0.0 | 0.0 | 0.0 | 0.0 | |
| Dairy products and alternatives: | Total volume | 1,441.5 | 2,611.7 | 12.6 | 2,737.8 | 3,298.9 | 4.8 |
| % breakdown | 1.8 | 2.5 | 6.8 | 2.5 | 2.8 | 2.3 | |
| Baby milk formula | Total volume | 8.7 | 9.4 | 1.6 | 9.5 | 9.6 | 0.4 |
| % breakdown | 0.0 | 0.0 | 0.0 | 0.0 | 0.0 | 0.0 | |
| Yoghurt: drinking, flavoured | Total volume | 447.4 | 543.0 | 3.9 | 531.9 | 491.3 | −2.0 |
| % breakdown | 0.5 | 0.5 | 0.0 | 0.5 | 0.4 | −4.4 | |
| Plant-based dairy - soy drinks, yoghurt and cheese | Total volume | 703.8 | 1,750.6 | 20.0 | 1,883.7 | 2,472.8 | 7.2 |
| % breakdown | 0.9 | 1.7 | 13.6 | 1.7 | 2.1 | 4.3 | |
| Other dairy: chilled snacks | Total volume | 281.5 | 308.8 | 1.9 | 312.7 | 325.2 | 1.0 |
| % breakdown | 0.3 | 0.3 | 0.0 | 0.3 | 0.3 | 0.0 | |
| Cooking ingredients and meals: | Total volume | 2,581.9 | 3,206.4 | 4.4 | 3,319.7 | 3,884.2 | 3.9 |
| % breakdown | 3.2 | 3.1 | −0.6 | 3.1 | 3.3 | 1.3 | |
| Ready meals | Total volume | 2,320.1 | 2,908.1 | 4.6 | 3,014.0 | 3,564.2 | 4.2 |
| % breakdown | 2.8 | 2.8 | 0.0 | 2.8 | 3.1 | 2.1 | |
| Chilled/frozen pizza | Total volume | 261.8 | 298.2 | 2.6 | 305.7 | 320.0 | 1.4 |
| % breakdown | 0.3 | 0.3 | 0.0 | 0.3 | 0.3 | 0.0 | |
| Staple foods: | Total volume | 51,204.0 | 69,478.3 | 6.3 | 71,944.6 | 77,761.9 | 2.3 |
| % breakdown | 62.8 | 66.2 | 1.1 | 66.7 | 66.6 | 0.1 | |
| Baked goods (bread, cakes, dessert pies and tarts) | Total volume | 34,204.1 | 34,814.2 | 0.4 | 34,836.8 | 35,133.3 | 0.2 |
| % breakdown | 42.0 | 33.2 | −4.6 | 32.3 | 30.1 | −1.9 | |
| Ready-to-eat cereals: flakes | Total volume | 175.6 | 175.9 | 0.0 | 176.8 | 183.0 | 0.8 |
| % breakdown | 0.2 | 0.2 | 0.0 | 0.2 | 0.2 | 0.0 | |
| Processed meat and seafood substitutes, tofu and derivatives | Total volume | 16,750.1 | 34,404.1 | 15.5 | 36,844.7 | 42,349.9 | 4.2 |
| % breakdown | 20.6 | 32.8 | 9.7 | 34.1 | 36.3 | 2.0 | |
| Noodles: plain, instant noodle cups | Total volume | 74.3 | 84.1 | 2.5 | 86.3 | 95.8 | 2.6 |
| % breakdown | 0.1 | 0.1 | 0.0 | 0.1 | 0.1 | 0.0 | |
| Asian specialty drinks | Total volume | 22.7 | 22.5 | −0.2 | 22.2 | 21.2 | −1.2 |
| % breakdown | 0.0 | 0.0 | 0.0 | 0.0 | 0.0 | 0.0 | |
|
Source: Euromonitor, 2024 *CAGR: Compound Annual Growth Rate |
|||||||
In 2024, demand in Germany for packaged food products containing pea protein ingredients totalled a sales volume of 6.2 thousand tonnes, which have been increasing by a CAGR of 16.4% (2019-2024) and is forecast to slow down to a CAGR of 4.0% (2024-2029) to reach 7.6 thousand tonnes in 2029. The packaged food category with the highest volume of pea protein ingredients (containing a total pea protein breakdown of 57.2%) was found in staple foods at a pea protein sales breakdown of 42.0% (4.6 thousand tonnes), especially for pea protein found in baked goods (bread) at volume share of 18.6% and processed chilled or frozen meat and seafood substitutes (23.4%) within the sector over the year. Dairy products and alternatives was the second highest category in demand for pea protein ingredient products at a volume sales share of 12.8% (1.4 thousand tonnes), specifically for pea protein found in plant-based dairy, including milk and solid yoghurt (7.8%) and drinking yoghurt (5.0%) within the packaged food sector in 2024. Snacks was the next category in demand at a volume share of 2.4% (259.8 tonnes), especially for pea protein (plant-based) ice cream (2.3%) within the sector. Over the year, there were no sales reported for cooking ingredients and meal products that contained pea protein.
| Category | Data type | 2019 | 2024 | CAGR* % 2019-2024 | 2025 | 2029 | CAGR* % 2024-2029 |
|---|---|---|---|---|---|---|---|
| Total - packaged food containing pea protein | Total volume | 2,917.6 | 6,224.1 | 16.4 | 6,591.5 | 7,588.2 | 4.0 |
| % breakdown | 41.4 | 57.2 | 6.6 | 58.3 | 56.3 | −0.3 | |
| Snacks: | Total volume | 195.6 | 259.8 | 5.8 | 269.9 | 290.8 | 2.3 |
| % breakdown | 2.8 | 2.4 | −3.0 | 2.4 | 2.2 | −1.7 | |
| Ice cream (including plant-based) | Total volume | 183.0 | 247.5 | 6.2 | 256.7 | 274.7 | 2.1 |
| % breakdown | 2.6 | 2.3 | −2.4 | 2.3 | 2.0 | −2.8 | |
| Cereal and protein/energy bars | Total volume | 12.6 | 12.3 | −0.5 | 13.1 | 16.0 | 5.4 |
| % breakdown | 0.2 | 0.1 | −12.9 | 0.1 | 0.1 | 0.0 | |
| Dairy products and alternatives: | Total volume | 731.1 | 1,389.7 | 13.7 | 1,458.1 | 1,783.0 | 5.1 |
| % breakdown | 10.4 | 12.8 | 4.2 | 12.9 | 13.2 | 0.6 | |
| Yoghurt: drinking, flavoured | Total volume | 447.4 | 543.0 | 3.9 | 531.9 | 491.3 | −2.0 |
| % breakdown | 6.4 | 5.0 | −4.8 | 4.7 | 3.6 | −6.4 | |
| Plant-based dairy - milk and yoghurt | Total volume | 283.6 | 846.7 | 24.5 | 926.2 | 1,291.8 | 8.8 |
| % breakdown | 4.0 | 7.8 | 14.3 | 8.2 | 9.6 | 4.2 | |
| Staple foods: | Total volume | 1,991.0 | 4,574.6 | 18.1 | 4,863.6 | 5,514.4 | 3.8 |
| % breakdown | 28.3 | 42.0 | 8.2 | 43.0 | 40.9 | −0.5 | |
| Baked goods: bread | Total volume | 1,936.2 | 2,028.3 | 0.9 | 2,034.3 | 2,064.8 | 0.4 |
| % breakdown | 27.5 | 18.6 | −7.5 | 18.0 | 15.3 | −3.8 | |
| Processed chilled/frozen meat and seafood substitutes | Total volume | 54.8 | 2,546.3 | 115.5 | 2,829.3 | 3,449.6 | 6.3 |
| % breakdown | 0.8 | 23.4 | 96.4 | 25.0 | 25.6 | 1.8 | |
|
Source: Euromonitor, 2024 *CAGR: Compound Annual Growth Rate |
|||||||
Retail sales
The processed meat, seafood and alternatives to meat category in Germany has grown by 8% in current terms in 2023, reaching sales of US$18.8 billion in 2023. Despite this growth, the category remains under pressure in Germany due to the war in Ukraine, which has disrupted trade routes, influencing the cost of animal feed, transportation and other expenses linked to meat production. The rising costs of agricultural commodities and the trade restrictions on Russia due to the war have led to price increases overall for most processed meat products at German retailers in 2023. Furthermore, the aftermath of the pandemic leading to disruptions in supply chains, processing plant closures, labour shortages, and changing consumer demands and preferences as a result of inflation have had a substantial impact on the meat industry for the German market over the year.Footnote 3
In 2023, the per capita consumption of processed meat in Germany recorded a decline in volume terms, continuing the longer-term forecast trend already seen in the previous year. The increasing prices of both poultry and pork, and to some extent beef - previously an affordable option and a staple in the daily diet of most Germans - is now heavily impacting overall meat consumption. Aldi Einkauf GmbH & Company oHG was the leading player in the processed meat, seafood and alternatives to meat sector in 2023, with a retail value share of 25%.Footnote 3
Meat and seafood substitutes was the best performing category in Germany, with retail value sales rising by 15% in current terms to reach US$840.6 million. Amidst heightened awareness of the environmental impact and health concerns associated with meat-rich diets, coupled with a notable surge in costs, a growing number of Germans are reshaping their dietary preferences and embracing a shift towards reducing their daily intake of processed meat. This was especially notable in the pork category, that is commonly perceived as being unhealthier than poultry of beef products.Footnote 3
High in protein food products
In Germany, products with a high source of protein ingredients (animal or non-animal derived) registered total sales of US$1.6 billion in 2023. High protein staple foods registered the largest retail sales at a value total of US$614.0 million (38.5%) mainly for its sales of processed meat, seafood and alternatives to meat, including tofu and its derivitives (73.4%), and baked goods (18.7%) in its category. Dairy products and alternatives was the 2nd largest category at US$504.3 million (31.6%), accounting for 97.4% in sales of high in protein dairy and plant-based products (including cheese, milk drinks, dairy desserts) in 2023. Meanwhile, sales in high protein snacks totalled US$419.0 million (26.3%) - mostly for its sales of high in protein savoury snacks, including salty, nut and seed mixes, meat, seafood snacks (84.8%); followed by high protein cooking ingredients and meals at sales of 56.9 million (3.5%) - mostly for its high protein ready meals, pizza and soups (88.0%) in its category in 2023. High protein non-alcohol hot/cold drinks registered total sales of US$17.7 million over the year, with high protein soft drinks (including concentrates, juices, ready-to-drink/RTD coffee, sports) holding a 93.8% retail share at a value of US$16.6 million.
| Category | 2019 | 2020 | 2021 | 2022 | 2023 |
|---|---|---|---|---|---|
| Total - high protein packaged food products | 742.0 | 974.0 | 1,186.1 | 1,451.0 | 1,594.2 |
| High protein snacks | 280.2 | 312.8 | 326.6 | 393.7 | 419.0 |
| Confectionery | 5.2 | 6.2 | 7.5 | 8.1 | 8.2 |
| Ice cream | 8.4 | 14.9 | 14.3 | 38.9 | 38.7 |
| Savoury snacks: salty, nut and seed mixes, meat, seafood | 255.4 | 278.2 | 291.3 | 331.8 | 355.5 |
| Sweet biscuits, snack bars and fruit snacks | 11.2 | 13.5 | 13.5 | 14.9 | 16.7 |
| High protein dairy products and alternatives | 180.1 | 209.7 | 315.6 | 459.0 | 504.3 |
| Baby food and milk formula | 10.7 | 12.0 | 12.5 | 14.8 | 12.9 |
| Dairy and plant-based products: cheese, milk drinks, desserts | 169.3 | 197.7 | 303.1 | 444.2 | 491.4 |
| High protein cooking ingredients and meals | 29.2 | 33.4 | 41.0 | 58.6 | 56.9 |
| Ready meals, pizza and soups | 26.9 | 29.6 | 36.6 | 52.6 | 50.1 |
| Sauces, dips and condiments | 1.0 | 1.3 | 1.7 | 2.7 | 2.7 |
| Sweet spreads | 1.3 | 2.4 | 2.7 | 3.4 | 4.0 |
| High protein staple foods | 252.5 | 418.1 | 502.9 | 539.7 | 614.0 |
| Baked goods | 59.8 | 83.5 | 85.0 | 96.3 | 114.7 |
| Breakfast cereals | 4.9 | 6.7 | 7.2 | 7.5 | 9.7 |
| Processed fruit and vegetables | 22.0 | 28.2 | 29.7 | 30.9 | 39.1 |
| Processed meat, seafood and alternatives to meat (including tofu and its derivatives) | 165.8 | 299.6 | 381.1 | 405.1 | 450.4 |
| Total - high protein hot/cold drinks (non-alcoholic) | 0.4 | 1.5 | 4.0 | 8.2 | 17.7 |
| High protein hot drinks: coffee, other | 0.2 | 0.5 | 0.9 | 0.7 | 1.1 |
| High protein soft drinks: concentrates, juice, Ready-to-drink coffee, sports | 0.2 | 1.0 | 3.1 | 7.5 | 16.6 |
| Source: Euromonitor International, 2024 | |||||
Over the historical period (2019-2023), high in protein packaged food products in Germany grew by a CAGR of 21.1% - growing by an annual growth of 9.9% in 2023. High protein hot/cold non-alcoholic drinks grew the most at a combined CAGR of 157.9% over the 5-year period, followed by high protein ice cream (46.5%), high protein sweet spreads (32.4%), and high protein dairy and plant-based products (30.5%). Overall, mostly all high in protein food and drink product segments registered higher than average 5-year growths - with CAGRs over 10% other than for high protein baby food and milk formula (+4.8%) and savoury snacks (+8.6%).
| Category | Annual growth % 2023/2022 | CAGR* % 2019-2023 | Total growth % 2019-2023 |
|---|---|---|---|
| Total - high protein packaged food products | 9.9 | 21.1 | 114.9 |
| High protein snacks | 6.4 | 10.6 | 49.5 |
| Confectionery | 1.2 | 12.1 | 57.7 |
| Ice cream | −0.5 | 46.5 | 360.7 |
| Savoury snacks: salty, nut and seed mixes, meat, seafood | 7.1 | 8.6 | 39.2 |
| Sweet biscuits, snack bars and fruit snacks | 12.1 | 10.5 | 49.1 |
| High protein dairy products and alternatives | 9.9 | 29.4 | 180.0 |
| Baby food and milk formula | −12.8 | 4.8 | 20.6 |
| Dairy and plant-based products: cheese, milk drinks, desserts | 10.6 | 30.5 | 190.3 |
| High protein cooking ingredients and meals | −2.9 | 18.1 | 94.9 |
| Ready meals, pizza and soups | −4.8 | 16.8 | 86.2 |
| Sauces, dips and condiments | 0.0 | 28.2 | 170.0 |
| Sweet spreads | 17.6 | 32.4 | 207.7 |
| High protein staple foods | 13.8 | 24.9 | 143.2 |
| Baked goods | 19.1 | 17.7 | 91.8 |
| Breakfast cereals | 29.3 | 18.6 | 98.0 |
| Processed fruit and vegetables | 26.5 | 15.5 | 77.7 |
| Processed meat, seafood and alternatives to meat (including tofu and derivatives) | 11.2 | 28.4 | 171.7 |
| Total - high protein hot/cold drinks (non-alcoholic) | 115.9 | 157.9 | 4,325.0 |
| High protein hot drinks: coffee, other | 57.1 | 53.1 | 450.0 |
| High protein soft drinks: concentrates, juice, Ready-to-drink coffee, sports | 121.3 | 201.8 | 8,200.0 |
|
Source: Euromonitor International, 2024 *CAGR: Compound Annual Growth Rate |
|||
| Category | 2023 | 2024 | 2025 | 2026 | 2027 | 2028 |
|---|---|---|---|---|---|---|
| Total - high protein packaged food products | 1,594.2 | 1,669.5 | 1,788.4 | 1,932.0 | 2,063.7 | 2,192.6 |
| High protein snacks | 419.0 | 441.5 | 466.9 | 494.9 | 524.4 | 555.2 |
| Confectionery | 8.2 | 7.2 | 8.2 | 9.4 | 11.0 | 12.7 |
| Ice cream | 38.7 | 39.8 | 41.1 | 42.6 | 44.1 | 45.6 |
| Savoury snacks: salty, nut and seed mixes, meat, seafood | 355.5 | 376.4 | 397.5 | 421.0 | 445.5 | 471.0 |
| Sweet biscuits, snack bars and fruit snacks | 16.7 | 18.2 | 20.0 | 21.9 | 23.8 | 25.8 |
| High protein dairy products and alternatives | 504.3 | 538.8 | 576.1 | 624.7 | 666.5 | 710.4 |
| Baby food and milk formula | 12.9 | 13.6 | 14.4 | 15.3 | 16.3 | 17.2 |
| Dairy and plant-based products: cheese, milk drinks, desserts | 491.4 | 525.1 | 561.6 | 609.3 | 650.2 | 693.2 |
| High protein cooking ingredients and meals | 56.9 | 63.0 | 70.7 | 79.0 | 87.7 | 96.9 |
| Ready meals, pizza and soups | 50.1 | 55.5 | 62.5 | 70.4 | 78.5 | 87.0 |
| Sauces, dips and condiments | 2.7 | 3.3 | 3.6 | 3.7 | 4.0 | 4.3 |
| Sweet spreads | 4.0 | 4.2 | 4.6 | 4.9 | 5.2 | 5.6 |
| High protein staple foods | 614.0 | 626.2 | 674.7 | 733.4 | 785.1 | 830.1 |
| Baked goods | 114.7 | 118.1 | 130.1 | 141.7 | 152.3 | 162.5 |
| Breakfast cereals | 9.7 | 9.3 | 9.5 | 9.9 | 10.5 | 11.0 |
| Processed fruit and vegetables | 39.1 | 35.5 | 36.2 | 37.9 | 39.6 | 41.4 |
| Processed meat, seafood and alternatives to meat (including tofu and derivatives) | 450.4 | 463.4 | 499.0 | 543.8 | 582.8 | 615.3 |
| Total - high protein hot/cold drinks (non-alcoholic) | 17.7 | 19.4 | 21.2 | 23.0 | 25.0 | 27.1 |
| High protein hot drinks: coffee, other | 1.1 | 0.9 | 0.9 | 0.9 | 1.0 | 1.1 |
| High protein soft drinks: concentrates, juice, Ready-to-drink coffee, sports | 16.6 | 18.5 | 20.3 | 22.1 | 24.0 | 26.0 |
| Source: Euromonitor International, 2024 | ||||||
Over the forecast period in Germany, all high in protein food segments are expected to return to lower to moderate growth rates with high in protein packaged food products growing at an overall total CAGR of 6.6% and high protein hot/cold drinks at 8.9% (2023 to 2028). High in protein foods and drinks that are expected to grow the most over the forecast period, include high protein ready meals/pizza/soups, sauces/dips/condiments, soft drinks - concentrates/juices/ready-to-drink coffees/sports drinks, confectionery, and sweet biscuits/snack bars/fruit snacks.
| Category | Annual growth % 2024/2023 | CAGR % 2023-2028 | Total growth % 2023-2028 |
|---|---|---|---|
| Total - high protein packaged food products | 6.2 | 6.6 | 37.5 |
| High protein snacks | 5.9 | 5.8 | 32.5 |
| Confectionery | 15.5 | 9.1 | 54.9 |
| Ice cream | 3.4 | 3.3 | 17.8 |
| Savoury snacks: salty, nut and seed mixes, meat, seafood | 5.7 | 5.8 | 32.5 |
| Sweet biscuits, snack bars and fruit snacks | 8.4 | 9.1 | 54.5 |
| High protein dairy products and alternatives | 6.6 | 7.1 | 40.9 |
| Baby food and milk formula | 5.5 | 5.9 | 33.3 |
| Dairy and plant-based products: cheese, milk drinks, desserts | 6.6 | 7.1 | 41.1 |
| High protein cooking ingredients and meals | 10.5 | 11.2 | 70.3 |
| Ready meals, pizza and soups | 10.8 | 11.7 | 73.7 |
| Sauces, dips and condiments | 7.5 | 9.8 | 59.3 |
| Sweet spreads | 7.7 | 7.0 | 40.0 |
| High protein staple foods | 5.7 | 6.2 | 35.2 |
| Baked goods | 6.7 | 7.2 | 41.7 |
| Breakfast cereals | 4.8 | 2.5 | 13.4 |
| Processed fruit and vegetables | 4.5 | 1.1 | 5.9 |
| Processed meat, seafood and alternatives to meat (including tofu and derivatives) | 5.6 | 6.4 | 36.6 |
| Total - high protein hot/cold drinks (non-alcoholic) | 8.4 | 8.9 | 53.1 |
| High protein hot drinks: coffee, other | 10.0 | 0.0 | 0.0 |
| High protein soft drinks: concentrates, juice, Ready-to-drink coffee, sports | 8.3 | 9.4 | 56.6 |
|
Source: Euromonitor International, 2024 *CAGR: Compound Annual Growth Rate |
|||
Plant-based food products
Influenced by evolving consumer preferences and rising demand for plant-based products, the diversity of meat alternatives in Germany are continuing to expand, where advancement in food technology has played a pivotal role in propelling the growth of the meat alternatives category. Despite the significant growth in the category, the impact of increasing prices is still noticeable in volume growth being lower in 2023 over previous years. The shelf space of plant-based products in retailers, also did not grow as quickly as in the past. As this lifestyle gains popularity, there is a heightened demand for meat alternatives that can replicate the taste, texture and nutritional value of real meat - of which manufacturers are harnessing innovations that mimic such qualities using ingredients like soy, wheat gluten and, more recently, pea protein.Footnote 3
Although, plant-based sales growth is forecast to slow down, the segment will continue to remain strong in the near future, as German consumers are increasingly conscious of the environmental repercussions of conventional meat production, particularly concerning greenhouse gas emissions and land utilization. Another contributing factor of the category's success has been the ascent of flexitarians, where individuals are adopting a dietary approach that leans towards plant-based foods with a smaller carbon footprint, while allowing some meat consumption.Footnote 3
Plant-based food products registered total sales of US$659.5 million in 2023. Plant-based dairy products was the category that registered the highest sales value in the plant-based segment in Germany at a total of US$592.4 million - mostly consisting of plant-based milk (72.5%), plant-based yoghurt (12.2%), and plant-based cheese (9.6%) in its category. Plant-based staple foods brought in sales of US$31.6 million - mostly for its meat and seafood substitutes (76.6%) food segment in 2023. Plant-based snacks registered the third largest sales at a value of US$28.1 million, mostly for its sales of plant-based ice cream (92.5%) in the snack category; followed by the main category of plant-based cooking ingredients and meals (US$7.4 million) - mostly in the category for its plant-based pizza (56.8%) and plant-based ready meals (29.7%) in 2023. Over the year, non-alcoholic plant-based hot coffee (including RTD coffee), concencentrates, and juices registered sales of US$1.1 million in Germany.
| Category | 2019 | 2020 | 2021 | 2022 | 2023 |
|---|---|---|---|---|---|
| Total - plant-based packaged food products | 249.5 | 403.6 | 465.0 | 538.3 | 659.5 |
| Plant-based snacks | 7.3 | 8.1 | 13.5 | 27.6 | 28.1 |
| Confectionery | 0.8 | 1.1 | 1.2 | 1.2 | 1.6 |
| Ice cream | 5.1 | 5.6 | 11.2 | 25.8 | 26.0 |
| Savoury snacks: salty, nut and seed mixes, meat, seafood | 0.4 | 0.6 | 0.3 | 0.2 | 0.0 |
| Sweet biscuits, snack bars and fruit snacks | 0.9 | 0.9 | 0.9 | 0.3 | 0.5 |
| Plant-based dairy products and alternatives | 232.5 | 372.8 | 420.7 | 474.8 | 592.4 |
| Butter and spreads | 0.1 | 0.2 | 0.1 | 0.1 | |
| Cheese | 60.8 | 66.2 | 61.9 | 47.2 | 56.6 |
| Milk | 102.4 | 218.6 | 278.4 | 341.2 | 429.2 |
| Yogurt | 52.7 | 58.0 | 62.1 | 66.7 | 72.1 |
| Other dairy: chilled/shelf stable desserts, cream | 16.6 | 29.9 | 18.1 | 19.5 | 34.4 |
| Plant-based cooking ingredients and meals | 1.1 | 1.2 | 4.6 | 5.4 | 7.4 |
| Pizza | 3.0 | 2.5 | 4.2 | ||
| Ready meals | 1.0 | 1.2 | 1.4 | 2.1 | 2.2 |
| Sauces, dips and condiments | 0.1 | 0.1 | 0.2 | 0.8 | 1.0 |
| Plant-based staple foods | 8.6 | 21.5 | 26.2 | 30.5 | 31.6 |
| Breakfast cereals | 0.3 | 0.5 | 0.4 | 0.3 | 0.3 |
| Meat and seafood substitutes | 4.5 | 15.3 | 18.1 | 21.0 | 24.2 |
| Pasta | 3.8 | 5.8 | 7.0 | 8.7 | 6.7 |
| Tofu and derivatives | 0.7 | 0.5 | 0.4 | ||
| Total - plant-based hot/cold drinks (non-alcoholic) | 9.1 | 7.1 | 4.9 | 2.1 | 1.1 |
| Plant-based hot drinks: coffee, other | 0.0 | 0.5 | 0.8 | 0.8 | 0.6 |
| Plant-based soft drinks: concentrates, juices, Ready-to-drink coffee | 9.1 | 6.6 | 4.1 | 1.3 | 0.5 |
| Source: Euromonitor International, 2024 | |||||
Over the historical period (2019 to 2023), most plant-based main food categories have been growing at a high rate (CAGR: 8.2% up to 77.8%) with plant-based packaged food products growing at an overall total CAGR of 27.5%. Just over the 2023/2022 period, other plant-based dairy products such as chilled/shelf stable dairy desserts and cream have increased by a CAGR as high as 76.4%, with other notable increasing segments over the year being plant-based pizza (+68%) and plant-based sweet biscuits, snack bars and fruit snacks (+66.7%). Over the longer 5-year period, the main segment with the highest growth in food sales was within the plant-based cooking ingredients and meal category at a CAGR of 61% (mostly for plant-based sauces, dips and condiments); followed by other plant-based snacks (+40.1%) - highest growth in plant-based ice cream, plant-based staple foods (+38.5%) - highest growth in meat and seafood substitutes, and plant-based dairy products and alternatives (+26.3%) - highest growth in plant-based milk. Plant-based soft drinks (including concentrates, juices and RTD coffee) decreased by a CAGR of 51.6% between 2019 and 2023. Other categories that declined over the same period, were plant-based savoury snacks, tofu and derivatives, plant-based sweet biscuits/snack bars/fruit snacks, and plant-based cheese.
| Category | Annual growth % 2023/2022 | CAGR % 2019-2023 | Total growth % 2019-2023 |
|---|---|---|---|
| Total - plant-based packaged food products | 22.5 | 27.5 | 164.3 |
| Plant-based snacks | 1.8 | 40.1 | 284.9 |
| Confectionery | 33.3 | 18.9 | 100.0 |
| Ice cream | 0.8 | 50.3 | 409.8 |
| Savoury snacks: salty, nut and seed mixes, meat, seafood | −100.0 | −100.0 | −100.0 |
| Sweet biscuits, snack bars and fruit snacks | 66.7 | −13.7 | −44.4 |
| Plant-based dairy products and alternatives | 24.8 | 26.3 | 154.8 |
| Butter and spreads | 0.0 | 0.0 | 0.0 |
| Cheese | 19.9 | −1.8 | −6.9 |
| Milk | 25.8 | 43.1 | 319.1 |
| Yogurt | 8.1 | 8.2 | 36.8 |
| Other dairy: chilled/shelf stable desserts, cream | 76.4 | 20.0 | 107.2 |
| Plant-based cooking ingredients and meals | 37.0 | 61.0 | 572.7 |
| Pizza | 68.0 | 18.3 | 40.0 |
| Ready meals | 4.8 | 21.8 | 120.0 |
| Sauces, dips and condiments | 25.0 | 77.8 | 900.0 |
| Plant-based staple foods | 3.6 | 38.5 | 267.4 |
| Breakfast cereals | 0.0 | 0.0 | 0.0 |
| Meat and seafood substitutes | 15.2 | 52.3 | 437.8 |
| Pasta | −23.0 | 15.2 | 76.3 |
| Tofu and derivatives | −20.0 | −24.4 | −42.9 |
| Total - plant-based hot/cold drinks (non-alcoholic) | −47.6 | −41.0 | −87.9 |
| Plant-based hot drinks: coffee, other | −25.0 | 6.3 | 20.0 |
| Plant-based soft drinks: concentrates, juices, Ready-to-drink coffee | −61.5 | −51.6 | −94.5 |
|
Source: Euromonitor International, 2024 *CAGR: Compound Annual Growth Rate |
|||
| Category | 2023 | 2024 | 2025 | 2026 | 2027 | 2028 |
|---|---|---|---|---|---|---|
| Total - plant-based packaged food products | 659.5 | 749.4 | 831.9 | 937.0 | 1,025.1 | 1,115.3 |
| Plant-based snacks | 28.1 | 28.7 | 30.7 | 33.1 | 35.3 | 37.6 |
| Confectionery | 1.6 | 1.9 | 2.7 | 3.5 | 4.3 | 5.0 |
| Ice cream | 26.0 | 26.5 | 27.4 | 28.6 | 29.7 | 30.8 |
| Savoury snacks: salty, nut and seed mixes, meat, seafood | 0.0 | 0.0 | 0.0 | 0.1 | 0.1 | 0.2 |
| Sweet biscuits, snack bars and fruit snacks | 0.5 | 0.3 | 0.6 | 0.9 | 1.2 | 1.6 |
| Plant-based dairy products and alternatives | 592.4 | 680.3 | 751.3 | 842.7 | 918.1 | 995.5 |
| Butter and spreads | 0.1 | 0.1 | 0.1 | 0.1 | 0.1 | 0.1 |
| Cheese | 56.6 | 60.7 | 63.7 | 66.6 | 69.3 | 72.0 |
| Milk | 429.2 | 509.3 | 572.7 | 656.4 | 725.0 | 795.5 |
| Yogurt | 72.1 | 75.6 | 78.8 | 81.8 | 84.6 | 87.2 |
| Other dairy: chilled/shelf stable desserts, cream | 34.4 | 34.5 | 36.0 | 37.7 | 39.1 | 40.8 |
| Plant-based cooking ingredients and meals | 7.4 | 7.3 | 13.0 | 19.2 | 25.2 | 31.6 |
| Pizza | 4.2 | 3.3 | 4.4 | 5.4 | 6.3 | 7.2 |
| Ready meals | 2.2 | 3.0 | 7.2 | 12.0 | 16.7 | 21.8 |
| Sauces, dips and condiments | 1.0 | 1.0 | 1.4 | 1.8 | 2.2 | 2.5 |
| Plant-based staple foods | 31.6 | 33.1 | 36.9 | 42.0 | 46.5 | 50.6 |
| Breakfast cereals | 0.3 | 0.3 | 0.4 | 0.5 | 0.6 | 0.7 |
| Meat and seafood substitutes | 24.2 | 26.6 | 30.3 | 35.0 | 39.0 | 42.6 |
| Pasta | 6.7 | 6.0 | 6.2 | 6.4 | 6.7 | 7.1 |
| Tofu and derivatives | 0.4 | 0.2 | 0.1 | 0.1 | 0.2 | 0.2 |
| Total - plant-based hot/cold drinks (non-alcoholic) | 1.1 | 1.7 | 2.2 | 3.2 | 3.8 | 4.6 |
| Plant-based hot drinks: coffee, other | 0.6 | 0.8 | 0.7 | 0.8 | 0.8 | 0.9 |
| Plant-based soft drinks: concentrates, juices, Ready-to-drink coffee | 0.5 | 0.9 | 1.5 | 2.4 | 3.0 | 3.7 |
| Source: Euromonitor International, 2024 | ||||||
Over the forecast period in Germany, mostly all plant-based food segments are expected to return to lower to moderate growth rates with plant-based packaged food products growing at an overall total CAGR of 11.1% (2023-2028). Plant-based foods that are expected to grow more significantly over the forecast period, include plant-based ready meals (+58.2%), soft drinks (+49.2%), plant-based savoury snacks (+41.4%), and plant-based sweet biscuits/snack bars/fruit snacks (+26.2%). Plant-based tofu and derivatives is the only category expected to continue to decline over the forecast period by a negative CAGR of 12.9%.
| Category | Annual growth % 2024/2023 | CAGR* % 2023-2028 | Total growth % 2023-2028 |
|---|---|---|---|
| Total - plant-based packaged food products | 8.8 | 11.1 | 69.1 |
| Plant-based snacks | 6.5 | 6.0 | 33.8 |
| Confectionery | 16.3 | 25.6 | 212.5 |
| Ice cream | 3.7 | 3.4 | 18.5 |
| Savoury snacks: salty, nut and seed mixes, meat, seafood | 100.0 | 41.4 | 100.0 |
| Sweet biscuits, snack bars and fruit snacks | 33.3 | 26.2 | 220.0 |
| Plant-based dairy products and alternatives | 8.4 | 10.9 | 68.0 |
| Butter and spreads | 0.0 | 0.0 | 0.0 |
| Cheese | 3.9 | 4.9 | 27.2 |
| Milk | 9.7 | 13.1 | 85.3 |
| Yogurt | 3.1 | 3.9 | 20.9 |
| Other dairy: chilled/shelf stable desserts, cream | 4.3 | 3.5 | 18.6 |
| Plant-based cooking ingredients and meals | 25.4 | 33.7 | 327.0 |
| Pizza | 14.3 | 11.4 | 71.4 |
| Ready meals | 30.5 | 58.2 | 890.9 |
| Sauces, dips and condiments | 13.6 | 20.1 | 150.0 |
| Plant-based staple foods | 8.8 | 9.9 | 60.1 |
| Breakfast cereals | 16.7 | 18.5 | 133.3 |
| Meat and seafood substitutes | 9.2 | 12.0 | 76.0 |
| Pasta | 6.0 | 1.2 | 6.0 |
| Tofu and derivatives | 0.0 | −12.9 | −50.0 |
| Total - plant-based hot/cold drinks (non-alcohol) | 21.1 | 33.1 | 318.2 |
| Plant-based hot drinks: coffee, other | 12.5 | 8.4 | 50.0 |
| Plant-based soft drinks: concentrates, juice, Ready-to-drink coffee | 23.3 | 49.2 | 640.0 |
|
Source: Euromonitor International, 2024 *CAGR: Compound Annual Growth Rate |
|||
Competitive landscape
In 2023, top packaged food companies (brands) per main food category for animal/non-animal derived high in protein ingredients products in Germany included the Intersnack Group GmbH & Company KG (Ültje, Funny Frisch) at a market share of 66.2% (US$277.4 million) in the snacks category; Groupe Danone (Alpro) at 24% (US$121.2 million) in the dairy products and alternatives category; WW International Inc. (Weight Watchers) at 33.7% (US$19.1 million) in the cooking ingredients and meals category; and Rügenwalder Wurstfabrik Carl Müller GmbH & Co KG (Rügenwalder Mühle) at 11.9% (US$72.9 million) in the staple foods category. The leading company (brand) with the highest high-protein hot drink sales at a share of 10.9% (US$0.1 million) was the KoRo Handels GmbH (KoRo) and for high-protein soft drinks at a share of 22.5% (US$3.7 million) was the Emmi Group (Emmi) in 2023.
| Category | Company | Top brand(s) | Retail sales (US$ million) | Market share % in 2023 |
|---|---|---|---|---|
| Snacks | Intersnack Group GmbH & Co KG | Ültje, Funny Frisch | 277.4 | 66.2 |
| Seeberger GmbH | See berger | 31.7 | 7.6 | |
| Vitamin Well AB | Barebells | 7.3 | 1.7 | |
| Private label | Private label | 0.9 | 0.2 | |
| Total - high protein snacks | 419.0 | 100.0 | ||
| Dairy products and alternatives | Groupe Danone | Alpro | 121.2 | 24.0 |
| Ehrmann SE | Ehrmann | 120.3 | 23.9 | |
| Unternehmensgruppe Theo Müller Secs | Müller | 27.6 | 5.5 | |
| Private label | Private label | 3.0 | 0.6 | |
| Total - high protein dairy products and alternatives | 504.3 | 100.0 | ||
| Cooking ingredients and meals | WW International Inc. | Weight Watchers | 19.1 | 33.7 |
| Nestlé SA | Garden Gourmet/Hälsans Kök | 5.4 | 9.5 | |
| Ecotone | Little Lunch, Allos | 2.1 | 3.7 | |
| Private label | Private label | 0.6 | 1.1 | |
| Total -high protein cooking ingredients and meals | 56.9 | 100.0 | ||
| Staple foods | Rügenwalder Wurstfabrik Carl Müller GmbH & Co KG | Rügenwalder Mühle | 72.9 | 11.9 |
| The Bolton Group | Saupiquet, Rio Mare | 52.3 | 8.5 | |
| Mestemacher GmbH | Mestemacher | 44.3 | 7.2 | |
| Private label | Private label | 2.0 | 0.3 | |
| Total - high protein staple foods | 614.0 | 100.0 | ||
| Hot drinks | KoRo Handels GmbH | KoRo | 0.1 | 10.9 |
| Alois Dallmayr KG | Dallmayr | 0.1 | 6.4 | |
| Health Embassy Ltd. | Health Embassy | 0.0 | 3.2 | |
| Total - high protein hot drinks | 1.1 | 100.0 | ||
| Soft drinks | Emmi Group | Emmi | 3.7 | 22.5 |
| Oetker-Gruppe | Dr Oetker | 3.3 | 19.8 | |
| Ehrmann SE | Ehrmann | 3.1 | 18.8 | |
| Total - high protein soft drinks | 16.6 | 100.0 | ||
| Source: Euromonitor International, 2024 | ||||
In 2023, top packaged food companies (brands) for plant-based products in Germany included Cereal Base CEBA AB (Oatly) at a market share of 65.4% (US$18.3 million) both in the snacks category and in the dairy products and alternatives category at 44.8% (US$265.3 million); Nestlé SA (Garden Gourmet/Hälsans Kök, Original Wagner) at 56.7% (US$4.2 million) both in the cooking ingredients and meals category and in the staple foods category at 31.9% (US$10.1 million). The leading company (brand) with the highest plant-based hot drink sales at a share of 75.4% (US$0.5 million) was the Nestlé SA GmbH (Nescafé) and for plant-based soft drinks at a share of 34% (US$0.2 million) was Giffard SA (Giffard) in 2023.
| Category | Company | Top brand(s) | Retail sales (US$ million) | Market share % in 2023 |
|---|---|---|---|---|
| Snacks | Cereal Base CEBA AB | Oatly | 18.3 | 65.4 |
| Unilever Group | Ben & Jerry's, Breyers | 7.8 | 27.7 | |
| Candy Kittens Ltd. | Cnady Kittens | 0.3 | 1.0 | |
| Private label | Private label | 0.0 | 0.1 | |
| Total - plant-based snacks | 28.1 | 100.0 | ||
| Dairy products and alternatives | Cereal Base CEBA AB | Oatly | 265.3 | 44.8 |
| Groupe Danone | Alpro, Provamel | 256.9 | 43.4 | |
| EVA GmbH | Simply V | 47.4 | 8.0 | |
| Total - plant-based dairy products and alternatives | 592.4 | 100.0 | ||
| Cooking ingredients and meals | Nestlé SA | Garden Gourmet/Hälsans Kök | 4.2 | 56.7 |
| JBS SA | Vivera | 1.4 | 18.6 | |
| Unilever Group | Best Foods/Hellmann's | 0.7 | 10.1 | |
| Total -plant-based cooking ingredients and meals | 7.4 | 100.0 | ||
| Staple foods | Nestlé SA | Garden Gourmet/Hälsans Kök, Original Wagner | 10.1 | 31.9 |
| Foods United Inc. | LikeMeat | 8.4 | 26.5 | |
| Barilla Holding SpA | Barilla | 6.5 | 20.7 | |
| Private label | Private label | 0.1 | 0.3 | |
| Total - plant-based staple foods | 31.6 | 100.0 | ||
| Hot drinks | Nestlé SA | Nescafé | 0.5 | 75.4 |
| El Horeia Food Industries Co. | Saula | 0.1 | 8.2 | |
| Krüger GmbH & Co KG | Drinking Chocolate | 0.0 | 5.5 | |
| Total - plant-based hot drinks | 0.6 | 100.0 | ||
| Soft drinks | Giffard SA | Giffard | 0.2 | 34.0 |
| Orior AG | Biotta | 0.2 | 31.5 | |
| Dabur India Ltd. | Réal | 0.2 | 29.5 | |
| Total - plant-based soft drinks | 0.5 | 100.0 | ||
| Source: Euromonitor International, 2024 | ||||
New product launches
Mintel indicated that there were 1,939 of new plant-based food (1,743) and drink (196) products launched in Germany's grocery retailer outlets (including new variety/range extension, packaging, formulation or relaunched) between the period of January 2019 and September 19th, 2024. Notably, there have been no new launches in Germany of plant-based products seen on the grocery shelves, since as early as December 2023.
During this same period (January 2019 to September 19, 2024), Germany launched 3,210 of new high/added protein food (2,450), drink (712), and health (48) products (excluding pet food) in it's grocery retailer outlets.
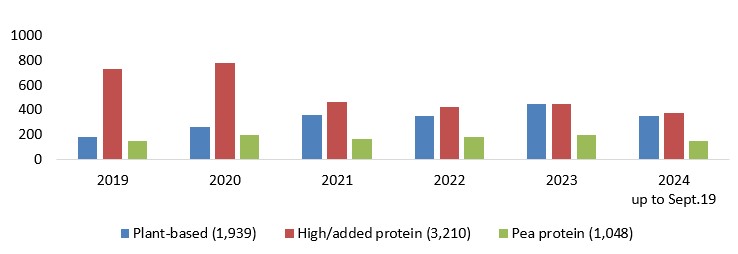
Description of above image
| 2019 | 2020 | 2021 | 2022 | 2023 | 2024 (up to September 19) | Total | |
|---|---|---|---|---|---|---|---|
| Plant-based | 179 | 260 | 358 | 347 | 448 | 347 | 1,939 |
| High/added protein | 727 | 778 | 459 | 421 | 450 | 375 | 3,210 |
| Pea protein | 152 | 198 | 165 | 184 | 199 | 150 | 1,048 |
Note: each product can contain more than one of these claims
Source: Mintel, 2024
Leading parent companies launching plant-based and/or high/added protein food and drink products (1,051) in Germany between Q3-2023 and Q3-2024 were Aldi Group (52), Lidl (43), REWE Group (37), Kaufland (27), and Mars (26). New related brands appearing for the first time launched in the German market within the last 6 months, included Lifefood Life Bar High Protein (organic strawberry protein bar), Ice Cream United (plant-based crunchy vanilla with peach-passionfruit sauce ice cream sticks), DM Bio Vetzgerei (plant-based organic vegan gyros), and VeLike! (plant-based organic mango oat yogurt).
Top categories for plant-based and/or high/added protein claims in Germany were savoury spreads (+75%), snacks (+50%), processed fish, meat and egg products (+18.8%), dairy (+16.7%), and nutritional drinks and other beverages (+2.7%) between Q3-2023 and Q3-2024. While declining categories included meals and meal centers (−72.7%), desserts and ice cream (−33.3%), snacks (−21.2%), breakfast cereals (−20%), and sauces and seasonings (−12.5%). New food ingredients appearing within the last 12 months included sugar snap peas, baby corn, Albacore tuna, oat biscuit, beef bone, garlic seasoning, chicken heart/liver, and strawberry/raspberry extract. The fastest growing flavours in these products were smoke (+1,100%), cocoa/cacao (+400%), chicken (+300%), and cherry, barbecue/BBQ/barbacoa, nougat/Turron (each at +200%) between Q3-2022 and Q3-2024.
Top claims and claim combinations used most often in the last three months for high/added and/or plant-based protein food, health and beverages product launches included vegan/no animal ingredients (63%), high/added protein (59.8%), plant-based (54.2%), low/no/reduced allergen (39.4%), environmental friendly package (34.7%), organic (31.9%), and ethical - sustainable habitat/resources (25.9%). Top growing plant-based and high in protein claims were low/no/reduced saturated fat (+600%), low/no/reduced carb (+350%), functional - energy (+325%), female (+300%), and palm oil free (+200%) between Q2-2023 and Q2-2024. Meanwhile during the same period, declining claims by were anti-ageing (−100%), functional - skin, nails and hair (−100%), low/no/reduced sodium (−87.5%), microwaveable (−86.4%), and functional - other (−62.5%).
Between the historic period (2019-2024), there were 1,048 new food (856), drink (188), and health (4) products launched in the German grocery market that contained pea protein ingredients. These products consisted of the following pea protein ingredients: 75.9% were labelled as being a pea protein food, followed by pea protein isolate (16.5%), pea protein hydrolysate (4.9%), textured pea protein (3.9%), pea protein concentrate (2.7%), and rehydrated pea protein (1.6%).
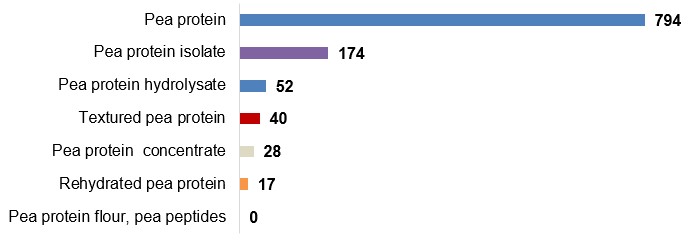
Description of above image
- Pea protein: 794
- Pea protein isolate: 174
- Pea protein hydrolysate: 52
- Textured pea protein: 40
- Pea protein concentrate: 28
- Rehydrated pea protein: 17
- Pea protein flour, pea peptides: 0
Note: each product can contain more than one of these ingredients
Total item count:1,048
Source: Mintel, 2024
In the EMEA, added/high protein claims in yogurt continue to grow as consumers seek recipes that not only offer increased protein levels but also deliver on taste. Particularly, in Europe the share of yogurt launches bearing a high-protein claim reached a record high of 20% over the past year, while added calcium, fibre, and plant sterol claims remain niche. Since high protein content in yogurt can sometimes tarnish the taste and texture appeal, as a result, brands are introducing high-protein yogurt varieties that boast smooth and rich textures such as blueberry flavoured protein yogurt by Bakoma Men (Poland), Ehrmann High Protein Mango Yogurt (UK), and Milko High Protein Super White Fat Free Yogurt (Czech Republic). However, consumers are often motivated to purchase natural and clean products, where 52% of German adults say that they like to avoid processed ingredients (eg; coconut oil, emulsifiers) in dairy alternatives. In fact, plant-based yogurt launches with no added flavouring or plain yogurt over a specific flavour, like strawberry, have recorded a notable increase in Europe. Europeans overall, are becoming more health-conscious and attaching more value to products that are natural and nutritious, and their concerns about artificial ingredients have impacted decision-making around plant-based yogurts. Footnote 4
Plant-based and vegan launches of spreads in the EMEA remains niche but has returned to positive growth over the past year. Extreme weather and other environmental challenges has heightened consumer awareness of the climate crisis and has prompted European shoppers to seek brands that address sustainability issues, including those reducing palm oil. Palm oil-free claims continue to emerge and inspire innovation in the region, with Upfield and Arla butter/spread brands like Flora and Becel, working towards being more transparent about their use of sustainable palm oil and advocating towards positive change in this area. Other global eco trends that are gaining profile in environmentally-friendly butters/spreads are those innovating products developed around flavours and chilled formats, with ghee thriving especially in India's ghee industry. Launches with eco claims referring to habitats and resources in terms of on-pack certifications and messaging about sustainable agriculture (also, in the minority), are once again, increasing - including Eat Plants Free of Palm Shea Butter by The Flower Farm (UK) and Keiju Levittää Hyvää Lactose Free Rapeseed Oil and Vegetable Fat Spread that is pink (owing to beetroot concentrate) and palm oil-free, which ties with a breast cancer charity initiative (Findland).Footnote 5
| Product attributes | Yearly launch - item count | ||||||
|---|---|---|---|---|---|---|---|
| 2019 | 2020 | 2021 | 2022 | 2023 | 2024 | Total | |
| Yearly product launches | 179 | 260 | 358 | 347 | 448 | 347 | 1,939 |
| Top launch types | |||||||
| New variety/range extension | 68 | 76 | 121 | 149 | 193 | 147 | 754 |
| New product | 65 | 119 | 142 | 117 | 109 | 94 | 646 |
| New packaging | 33 | 45 | 68 | 56 | 120 | 76 | 398 |
| Relaunch | 13 | 17 | 25 | 24 | 24 | 26 | 129 |
| New formulation | 0 | 3 | 2 | 1 | 2 | 4 | 12 |
| Top sub-categories | |||||||
| Meat substitutes | 20 | 54 | 47 | 41 | 61 | 89 | 312 |
| Plant based drinks (dairy alternatives) | 23 | 27 | 31 | 45 | 42 | 29 | 197 |
| Nutritional and meal replacement drinks | 27 | 24 | 23 | 14 | 23 | 21 | 132 |
| Savoury vegetable pastes/spreads | 6 | 18 | 21 | 18 | 35 | 17 | 115 |
| Processed cheese | 13 | 9 | 19 | 14 | 26 | 14 | 95 |
| Top five companies / parent | |||||||
| Penny Markt | 1 | 22 | 24 | 37 | 14 | 12 | 110 |
| Allos Hof-Manufaktur | 2 | 13 | 14 | 13 | 13 | 12 | 67 |
| Alpro | 22 | 16 | 12 | 7 | 3 | 1 | 61 |
| Lidl | 0 | 0 | 17 | 7 | 9 | 3 | 36 |
| Dirk Rossmann | 1 | 1 | 2 | 3 | 23 | 4 | 34 |
| Top five brands | |||||||
| Food for Future by Penny. | 0 | 19 | 24 | 34 | 14 | 11 | 102 |
| Alpro | 13 | 7 | 8 | 7 | 10 | 8 | 53 |
| K Take It Veggie | 0 | 1 | 2 | 2 | 22 | 13 | 40 |
| Rossmann enerBiO | 0 | 0 | 2 | 2 | 22 | 2 | 28 |
| My Vay | 0 | 0 | 0 | 0 | 2 | 22 | 24 |
| Import status (if reported) | |||||||
| Not imported | 33 | 39 | 48 | 30 | 50 | 34 | 234 |
| Imported | 26 | 13 | 23 | 28 | 50 | 24 | 164 |
| Location of manufacture | |||||||
| Germany | 33 | 39 | 48 | 30 | 50 | 34 | 234 |
| Austria | 3 | 1 | 2 | 8 | 18 | 2 | 34 |
| Italy | 7 | 5 | 2 | 4 | 3 | 2 | 23 |
| Switzerland | 3 | 0 | 5 | 3 | 5 | 6 | 22 |
| Belgium | 1 | 1 | 5 | 2 | 1 | 2 | 12 |
| Canada (21st) | 0 | 0 | 0 | 0 | 1 | 0 | 1 |
| Top five flavours (including blend) | |||||||
| Unflavoured/plain | 78 | 81 | 118 | 117 | 133 | 97 | 624 |
| Chocolate | 5 | 19 | 8 | 7 | 13 | 7 | 59 |
| Vanilla/vanilla Bourbon/vanilla Madagascar | 7 | 6 | 6 | 9 | 5 | 3 | 36 |
| Strawberry | 5 | 3 | 5 | 2 | 3 | 5 | 23 |
| Herbs/herbal | 2 | 3 | 3 | 6 | 4 | 3 | 21 |
| Top claim category | |||||||
| Suitable for | 179 | 260 | 358 | 347 | 448 | 347 | 1,939 |
| Natural | 126 | 166 | 208 | 212 | 273 | 183 | 1,168 |
| Ethical and environmental | 60 | 131 | 176 | 206 | 234 | 188 | 995 |
| Plus | 78 | 107 | 121 | 71 | 112 | 93 | 582 |
| Positioning | 65 | 88 | 115 | 70 | 104 | 74 | 516 |
| Source: Mintel; Global New Product Database, 2024 | |||||||
| Product attributes | Yearly launch - item count | ||||||
|---|---|---|---|---|---|---|---|
| 2019 | 2020 | 2021 | 2022 | 2023 | 2024 | Total | |
| Yearly product launches | 727 | 778 | 459 | 421 | 450 | 375 | 3,210 |
| Top launch types | |||||||
| New variety/range extension | 280 | 287 | 199 | 186 | 179 | 172 | 1,303 |
| New product | 340 | 360 | 135 | 126 | 114 | 81 | 1,156 |
| New packaging | 73 | 91 | 98 | 80 | 132 | 88 | 562 |
| Relaunch | 27 | 34 | 27 | 25 | 23 | 30 | 166 |
| New formulation | 7 | 6 | 0 | 4 | 2 | 4 | 23 |
| Top sub-categories | |||||||
| Nutritional and meal replacement drinks | 167 | 134 | 100 | 67 | 94 | 106 | 668 |
| Snack/cereal/energy bars | 123 | 145 | 40 | 60 | 33 | 35 | 436 |
| Meat substitutes | 37 | 59 | 42 | 40 | 46 | 59 | 283 |
| Fish products | 5 | 8 | 31 | 26 | 32 | 23 | 125 |
| Spoonable yogurt | 30 | 26 | 9 | 25 | 9 | 5 | 104 |
| Top five companies | |||||||
| Lidl | 5 | 19 | 28 | 41 | 39 | 21 | 153 |
| Prozis | 24 | 41 | 22 | 2 | 14 | 12 | 115 |
| DM Drogerie Markt | 10 | 11 | 11 | 13 | 14 | 14 | 73 |
| Dirk Rossmann | 15 | 12 | 8 | 7 | 12 | 12 | 66 |
| Foodspring | 20 | 11 | 3 | 4 | 10 | 17 | 65 |
| Top five brands | |||||||
| Prozis | 11 | 30 | 10 | 2 | 9 | 8 | 70 |
| Foodspring | 20 | 11 | 1 | 3 | 7 | 11 | 53 |
| DM Sportness | 4 | 8 | 5 | 6 | 9 | 9 | 41 |
| Rossmann enerBiO | 7 | 7 | 3 | 5 | 8 | 5 | 35 |
| Ehrmann High Protein | 11 | 6 | 0 | 3 | 4 | 7 | 31 |
| Import status (if reported) | |||||||
| Not imported | 172 | 126 | 63 | 53 | 65 | 54 | 533 |
| Imported | 99 | 66 | 37 | 38 | 35 | 25 | 300 |
| Location of manufacture | |||||||
| Germany | 172 | 126 | 63 | 53 | 65 | 54 | 533 |
| Austria | 18 | 19 | 6 | 11 | 5 | 4 | 63 |
| United Kingdom | 20 | 9 | 3 | 3 | 3 | 2 | 40 |
| Italy | 14 | 5 | 10 | 2 | 4 | 2 | 37 |
| Netherlands | 6 | 7 | 5 | 3 | 5 | 0 | 26 |
| Canada (19th) | 1 | 0 | 0 | 0 | 1 | 0 | 2 |
| Top five flavours (including blend) | |||||||
| Unflavoured/plain | 176 | 196 | 141 | 123 | 144 | 89 | 869 |
| Chocolate | 48 | 63 | 34 | 28 | 25 | 26 | 224 |
| Vanilla - Bourbon/Madagascar | 45 | 50 | 21 | 16 | 19 | 17 | 168 |
| Strawberry | 24 | 12 | 7 | 9 | 11 | 14 | 77 |
| Hazelnut | 7 | 16 | 7 | 5 | 3 | 1 | 39 |
| Top claim category | |||||||
| Plus | 727 | 778 | 459 | 421 | 450 | 375 | 3,210 |
| Suitable for | 403 | 454 | 269 | 244 | 277 | 240 | 1,887 |
| Minus | 388 | 420 | 208 | 213 | 189 | 183 | 1,601 |
| Natural | 330 | 334 | 205 | 157 | 215 | 152 | 1,393 |
| Ethical and environmental | 168 | 202 | 161 | 162 | 165 | 150 | 1,008 |
| Source: Mintel; Global New Product Database, 2024 | |||||||
| Product attributes | Yearly launch - item count | ||||||
|---|---|---|---|---|---|---|---|
| 2019 | 2020 | 2021 | 2022 | 2023 | 2024 | Total | |
| Yearly product launches | 152 | 198 | 165 | 184 | 199 | 150 | 1,048 |
| Top launch types | |||||||
| New variety/range extension | 49 | 51 | 77 | 92 | 98 | 86 | 453 |
| New product | 74 | 116 | 56 | 63 | 54 | 24 | 387 |
| New packaging | 18 | 12 | 24 | 18 | 28 | 27 | 127 |
| Relaunch | 10 | 16 | 8 | 9 | 15 | 9 | 67 |
| New formulation | 1 | 3 | 0 | 2 | 4 | 4 | 14 |
| Top sub-categories | |||||||
| Meat substitutes | 23 | 38 | 37 | 39 | 40 | 51 | 228 |
| Nutritional and meal replacement drinks | 37 | 33 | 36 | 18 | 29 | 28 | 181 |
| Snack/cereal/energy bars | 17 | 28 | 9 | 10 | 9 | 9 | 82 |
| Plant based drinks (dairy alternatives) | 8 | 11 | 9 | 6 | 10 | 8 | 52 |
| Bread and bread products | 6 | 9 | 5 | 8 | 10 | 12 | 50 |
| Top five companies | |||||||
| Lidl | 5 | 8 | 13 | 9 | 13 | 4 | 52 |
| Penny Markt | 0 | 12 | 7 | 8 | 6 | 5 | 38 |
| Aldi Süd | 5 | 7 | 6 | 4 | 2 | 1 | 25 |
| DM Drogerie Markt | 2 | 2 | 2 | 3 | 5 | 6 | 20 |
| Nestlé Wagner | 2 | 5 | 0 | 3 | 6 | 1 | 17 |
| Top five brands | |||||||
| Food for Future by Penny. | 0 | 9 | 4 | 9 | 4 | 4 | 30 |
| Vemondo | 0 | 0 | 11 | 3 | 7 | 1 | 22 |
| Endori | 0 | 0 | 1 | 1 | 1 | 11 | 14 |
| K Take It Veggie | 1 | 4 | 0 | 0 | 5 | 4 | 14 |
| Greenforce | 0 | 0 | 4 | 4 | 1 | 4 | 13 |
| Import status (if reported) | |||||||
| Not imported | 37 | 30 | 28 | 20 | 21 | 35 | 171 |
| Imported | 21 | 11 | 8 | 15 | 18 | 10 | 83 |
| Location of manufacture | |||||||
| Germany | 37 | 30 | 28 | 20 | 21 | 35 | 171 |
| Austria | 5 | 4 | 0 | 0 | 2 | 1 | 12 |
| Netherlands | 3 | 1 | 0 | 3 | 4 | 1 | 12 |
| Belgium | 1 | 2 | 0 | 5 | 1 | 2 | 11 |
| Spain | 2 | 1 | 1 | 1 | 4 | 0 | 9 |
| Canada (17th) | 1 | 0 | 0 | 0 | 0 | 0 | 1 |
| Top five flavours (including blend) | |||||||
| Unflavoured/plain | 37 | 51 | 49 | 50 | 50 | 45 | 282 |
| Chocolate | 11 | 21 | 8 | 6 | 8 | 7 | 61 |
| Vanilla/bourbon/Madagascar | 8 | 12 | 10 | 2 | 4 | 3 | 39 |
| Strawberry | 6 | 2 | 4 | 4 | 4 | 1 | 21 |
| Herbs/herbal | 1 | 2 | 2 | 4 | 3 | 3 | 15 |
| Top claim category | |||||||
| Suitable for | 123 | 177 | 154 | 154 | 171 | 134 | 913 |
| Plus | 83 | 111 | 95 | 79 | 85 | 80 | 533 |
| Ethical and environmental | 43 | 87 | 79 | 88 | 87 | 71 | 455 |
| Natural | 66 | 91 | 76 | 81 | 80 | 53 | 447 |
| Positioning | 37 | 62 | 54 | 44 | 52 | 47 | 296 |
| Source: Mintel; Global New Product Database, 2024 | |||||||
Examples of new products
Real Green Burger
Source: Mintel, 2024
| Company | No Meat |
|---|---|
| Brand | NOM Eat! |
| Sub-category | Meat substitutes |
| Market | Germany |
| Related claims | Vegetarian, ethical – environmentally friendly package/product, vegan/no animal, plant based |
| Related ingredients | Broccoli, white bean, peas, spinach, quinoa, zucchini, chickpea flour, rolled oats, green pepper |
| Store name/location | Kaufland, Waldheim 04736 |
| Store type | Mass merchandise / hypermarket |
| Date published | December 2023 |
| Launch type | New product |
| Price in US dollars | 1.82 |
This product retails in a 227 gram pack containing two units.Thick vegetable burger. Naturally without meat- 100% plant-based. Delicious flavour. Masterfully prepared burger with garden peas, broccoli and beans. Scores an A on the Nutri-Score. 100% plant source of protein. Vegan. 10% of profits are donated to sustainable causes. Simply real veggies. Vegetable burger with spices and herbs. Suitable for vegetarians- also available as a Real Orange Burger with beans, sweet potatoes and carrots. Logos and certifications: Vegan V-Label from the European Vegetarian Union, FSC Mix, QR code
Wacky Wasabi Crunchy Coated Pea Snack
Source: Mintel, 2024
| Company | TTP Snacks |
|---|---|
| Brand | Taking the Pea |
| Category | Vegetable snacks |
| Market | Germany |
| Related claims | High/added fibre, ethical – environmentally friendly package/product/recycling/sustainable, high/added protein, vegan/no animal ingredients, plant based |
| Store name | Piccantino |
| Store type | Internet / mail order |
| Date published | December 2023 |
| Launch type | New product |
| Price in US dollars | 4.40 |
This product retails in a 125 gram pack. High in fibre. Vegan friendly. 108 calories per portion. British peas. Plant protein. Roasted peas, coated in some of the nation's favourite flavours. Crunchy. Great source of plant protein. Sustainably sourced palm oil. Recyclable pack. Logos and certifications: Facebook, Instagram
Vegan Poultry-Style Meat Sausage
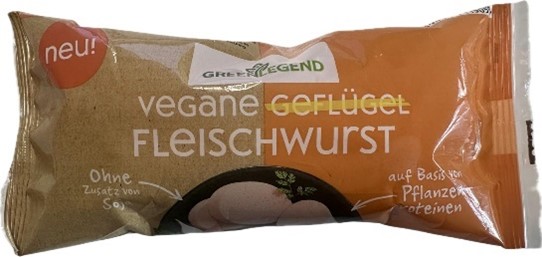
Source: Mintel, 2024
| Company | Wiesenhof |
|---|---|
| Brand | Green Legend |
| Category | Meat substitutes |
| Market | Germany |
| Related claims | Low/no/reduced allergen, vegan/no animal ingredients, plant based |
| Related ingredients | Vegetable protein (pea protein, broad bean protein) |
| Store name/location | HIT, Berlin 12107 |
| Store type | Supermarket |
| Date published | December 2023 |
| Launch type | New variety / range extension |
| Price in US dollars | 3.22 |
This product retails in a 175 gram pack. Vegetable protein-based product. Without added soy. Logos and certifications: Vegan V-Label seal from the European Vegetarian Union
Chocolate Mint Protein Bar
Source: Mintel, 2024
| Company / distributor | Clif Bar & Company |
|---|---|
| Importer | Clif Bar Europe |
| Brand | Clif Builders Protein |
| Category | Snacks/cereal/energy bars |
| Market | Germany, made in Canada |
| Related claims | Kosher, low/no/reduced Glycemic, gluten free, low/no/reduced allergen, high/added protein, plant based, functional – energy, weight and muscle gain |
| Store name/location | EDEKA center, Filderstadt 70794 |
| Store type | Mass merchandise / hypermarket |
| Date published | February 2023 |
| Launch type | New packaging |
| Price in US dollars | 2.69 |
This product has been repackaged, and retails in a newly designed 68 gram pack. Contains 20 grams protein per bar. Since forming In Good Company in 2008 to unite like-minded businesses to help build healthy communities across the country, the manufacturer has completed dozens of projects, from replanting forests in California to building community gardens in New York. Low glycemic foods digest slowly for prolonged levels of energy. Non- GMO. Complete plant protein. Gluten free. The strength of 20 muscle-building grams of protein. Logos and certifications: Kosher, Clif Bar Family Foundation
Chocolate Flavour Meal Replacement
Source: Mintel, 2024
| Company/manufacturer | Foodspring |
|---|---|
| Brand | Foodspring Vegan Shape Shake |
| Sub-category | Nutritional and meal replacement drinks |
| Market | Germany |
| Related claims | High/added fibre andprotein, gluten free, low / no / reduced allergen, vegan/no animal ingredients, low/reduced sugar, functional – slimming, plant based |
| Related ingredients | Fava bean protein isolate, chickpea protein concentrate |
| Store name/location | Foodspring |
| Store type | Internet/mail order |
| Date published | December 2023 |
| Launch type | New product |
| Price in US dollars | 38.20 |
This product retails in a 900 gram pack. Plant powered. Low in sugars. High in fibre and protein. Free from gluten. Chocolate flavour meal replacement for weight control. With sweeteners. Vegan. Preparation instructions.
Stracciatella Flavoured Yoghurt Alternative from Coconut Milk
Source: Mintel, 2024
| Company | Andros |
|---|---|
| Manufacturer | ODW Frishpodukte |
| Brand | Andros So Good So Veggie |
| Category | Dairy alternatives, plant based spoonable yogurts |
| Market | Germany |
| Related claims | No additives/preservatives, added calcium, vitamin/mineral fortified, low/no/reduced allergen/lactose, vegan/no animal ingredients, plant based |
| Related ingredients | Pea protein |
| Store name/location | REWE, Frankfurt 60486 |
| Store type | Supermarket |
| Date published | December 2023 |
| Launch type | New variety / range extension |
| Price in US dollars | 2.18 |
This product retails in a 350 gram pack. Naturally free from lactose; free from preservatives, according to law, and free from colouring and flavouring. Source of calcium. Unbelievably tasty, surprisingly vegan. Logos and certifications: International Vegan V-Label, Facebook, Instagram
Opportunities in Germany
As the demand for plant-based and alternative proteins continues its upward trajectory in Germany, the potential for a variety of new meat alternatives to emerge in the coming years is considerable. Cultured meat, generated by cultivating animal cells in a lab, is one noteworthy alternative that holds promise as a more sustainable and ethical option compared to traditional meat. Although, it has yet to reach German consumers with legalisation still needed in the country, it is likely Germany will follow suit at some point to some of its neighbouring countries who have recently gave permission for retail sales of such products.Footnote 3
Note: Singapore was the first to allow human consumption of lab-grown meat - December 2020; followed by US in June 2023 and Israel approved cultured meat in January 2024; and now in a small way, the UK became the first country in Europe to approve the use of lab-grown chicken in dog food in July 2024.Footnote 6
Insect-based alternatives, on the other hand, are gaining wider availability and is considered as a potential protein source in Germany. Their high nutritional content and lower environmental impact make them an attractive option, along with a rise in the utilization of plant-based proteins such as legumes, mushrooms or seaweed in meat substitutes. Seaweed, particularly in the context of fish replacement, is gaining traction as a sustainable and cost-effective alternative to traditional meat. In response to changing dietary preferences and environmental impact considerations, the trajectory of meat alternatives in Germany look towards a broad array of diverse options and innovative alternatives that reflect closely next to traditional meat in both texture and taste. The presence of new alternatives for salmon and tuna increasingly seen on retailer's shelves, is also, gaining growing interest for the innovation of sustainable alternatives that align with broader shifts toward conscientious and health-oriented eating habits. While traditional seafood consumption remains robust in Germany as a healthier protein source, there is a gradual emergence for new plant-based seafood product options - that address concerns about overfishing and appeal to individuals seeking sustainable and cruelty-free choices.Footnote 3
For more information
The Canadian Trade Commissioner Service:
International Trade Commissioners can provide Canadian industry with on-the-ground expertise regarding market potential, current conditions and local business contacts, and are an excellent point of contact for export advice.
More agri-food market intelligence:
International agri-food market intelligence
Discover global agriculture and food opportunities, the complete library of Global Analysis reports, market trends and forecasts, and information on Canada's free trade agreements.
Agri-food market intelligence service
Canadian agri-food and seafood businesses can take advantage of a customized service of reports and analysis, and join our email subscription service to have the latest reports delivered directly to their inbox.
More on Canada's agriculture and agri-food sectors:
Canada's agriculture sectors
Information on the agriculture industry by sector. Data on international markets. Initiatives to support awareness of the industry in Canada. How the department engages with the industry.
For additional information on the SIAL 2024 food trade show held in Paris, please contact:
Ben Berry, Deputy Director
Trade Show Strategy and Delivery
Agriculture and agri-food Canada
ben.berry@agr.gc.ca
Resources
- Beckett, Alex. Mintel | June 2024. A year of innovation in butter, dairy and plant-based spreads, 2024
- Euromonitor International | November 2023. Country Report: Processed meat, seafood and alternatives to meat in Germany
- Fusaro, Dave. Food Processing | July 2024. In a Small Way, UK Is First European Country To Approve Cultured Meat
- Kaczorowski, Miolaj. Mintel | October 2023. A year of innovation in meat substitutes and eggs: EMEA
- Mintel Global New Products Database, 2024
- Srivastava, Neha. Mintel | August 8, 2023. Patent insights: alternative proteins for the future
- Srivastava, Neha. Mintel | March 2024. A year of innovation in dairy and plant-based yogurt, 2024
Sector Trend Analysis – Plant-based protein food and drink trends in Germany
Global Analysis Report
Prepared by: Erin-Ann Chauvin, Senior Market Analyst
© His Majesty the King in Right of Canada, represented by the Minister of Agriculture and Agri-Food (2025).
Photo credits
All photographs reproduced in this publication are used by permission of the rights holders.
All images, unless otherwise noted, are copyright His Majesty the King in Right of Canada.
To join our distribution list or to suggest additional report topics or markets, please contact:
Agriculture and Agri-Food Canada, Global Analysis1341 Baseline Rd, Tower 5, 3rd floor
Ottawa ON K1A 0C5
Canada
Email: aafc.mas-sam.aac@agr.gc.ca
The Government of Canada has prepared this report based on primary and secondary sources of information. Although every effort has been made to ensure that the information is accurate, Agriculture and Agri-Food Canada (AAFC) assumes no liability for any actions taken based on the information contained herein.
Reproduction or redistribution of this document, in whole or in part, must include acknowledgement of agriculture and agri-food Canada as the owner of the copyright in the document, through a reference citing AAFC, the title of the document and the year. Where the reproduction or redistribution includes data from this document, it must also include an acknowledgement of the specific data source(s), as noted in this document.
Agriculture and Agri-Food Canada provides this document and other report services to agriculture and food industry clients free of charge.