

Note: This report includes forecasting data that is based on baseline historical data.
Executive summary
The Philippines was the twenty-second largest market for meat in the world with imports valued at US$1.9 billion (1.1% market share), 1.2 billion kg in 2023, representing a moderate increase in compound annual growth rate (CAGR) of 7.8% from US$1.3 billion, 884.4 million kilograms in 2018.
The Philippines is a net importer of meat products. In 2023, the Philippines imported US$1,932.7 million of meat products from global markets (+7.8% in annual growth from US$1,329.5 million in 2018) and exported US$23.2 million, recording a trade deficit of US$1,909.5 million.
The top three suppliers of meat products to the Philippines were Brazil with values of US$597.6 million (30.9% market share), the U. S with values of US$343.8 million (17.8% market share) and Canada with values of US$199.7 million (10.3% market share) in 2023.
Canada's top three meat products exported to the Philippines were frozen pork, bone in with values of US$126.3 million (52.4% market share), followed by frozen hams, bone in with values of US$69.8 million (28.9% market share), increasing significantly by 68.1% annually from US$5.2 million in 2018 and edible offal pork, frozen with US$19.6 million (8.1% market share) in 2023, increasing 23.7% in annual growth from US$6.8 million supplied in 2018.
The Philippines was the twenty-second largest global retail sales market for fresh meat, after Saudi Arabia and Egypt, with retail sales of US$8.4 billion (0.9% market share) in 2023. Pork was largest category of fresh meat with retail sales of US$4.4 billion (51.9% market share), followed by beef and veal with retail sales of US$2.2 billion (26.3% market share) and poultry with retail sales of US$1.6 billion (19.3% market share) in 2023.
The Philippines was the sixteenth largest global market for processed meats with retail value sales of US$2.1 billion (1.1% market share) in 2023, representing the largest increase in CAGR (12.1%) of the top markets identified, from retail sales of US$1.2 billion in 2018. Chilled processed meat was the largest category of processed meat in the Filipino market with retail sales of US$811.5 million (37.8% market share, followed by frozen processed meat with retail sales of US$808.9 million (37.6% market share) and shelf stable with retail sales of US$528.8 million (24.6% market share) in 2023.
Market and consumer overview
In 2023, the Philippines was positioned as thirteenth among 22 Asia Pacific countries in terms of average per capita gross income, which amounted to US$3,044. A growing middle class, sustained remittance inflows from workers abroad, growing sector exports and the continued recovery of the tourism sector are all expected to support economic and, consequently, income growth in 2024 and beyond. The highest income earners per capita in 2028 are forecast to be the population segment aged 30 to 34 years, while the consumer group aged 35 to 39 years is predicted to dominate the top income band (those with an annual gross income over US$250,000), presenting new opportunities for businesses focusing on premium goods and services. (Euromonitor International; Income and Expenditure: The Philippines, July 2024).
The Philippines' real gross domestic product (GDP) growth declined to 5.2% in 2023, following a robust expansion of 7.6% in 2022. The country's economic performance is predicted to accelerate in 2024, with real GDP projected to grow by 5.7%, and between 2023-2028, the country's economy is forecast to expand at a compound annual growth rate (CAGR) of 6.1% in real terms, supported by expanding domestic consumption and the central bank's proactive monetary policy. Moreover, tourism arrivals are predicted to bring additional support, given the country's affordable tourism offerings, low level entry requirements and strong transport links. (Euromonitor International; Economy, Finance and Trade: The Philippines, May 2024).
Inflation increased to 6.0% in 2023 from 5.8% recorded in 2022 as the transportation, food and non-alcoholic beverages sector and the hospitality sector witnessed the most significant price increases. During 2024, inflation was projected to decelerate to 3.7%, guided by the central bank's monetary policy (the policy rate increased from 2.0% in 2022 to 6.5% in 2023), implemented to curb inflation and stabilize the economy. (Euromonitor International; Economy, Finance and Trade: The Philippines, May 2024).
The Philippine's population reached 114.9 million in 2023 with Generation Z representing the largest generation cohort. The country's birth rates have declined from 17.0 (per '000 population) recorded in 2020 to 16.0 in 2023, attributed in part, to the Family Planning initiative implemented by the government in 2012 and extended in 2020, with plans spanning until 2030. The population is expected to increase to 129.5 million by 2040, with Generation Alpha emerging as the largest segment, projected to wield significant influence in consumer markets (Euromonitor International; Philippines: Consumer Profile, page 10, July 21, 2023.)
Females represented 50.1% of the population (57.6 million) and attained a median age of 26.8 years, while males represented 49.9% (57.3 million), and attained a median age of 25.8 years in 2023. By 2040, the female population is anticipated to reach 65.1 million (50.3%) with a median age of 33.9 years, while males are forecast to represent 64.4 million (49.7%) of the population, and a median age of 32.1 years.
The urban population in the Philippines is experiencing significant growth, primarily due to the ongoing development of infrastructure and the presence of a more favorable economic environment in the cities. Consequently, it is anticipated that the government will augment its investments in urban areas, further enhancing their appeal for residents. In terms of rural and urban population, 54.9% of the population (as of 2023) resided in urban areas, which is anticipated to grow to 62.4% of the population by 2040.
Manila, the Philippine capital, is anticipated to maintain its position as the most populous city, attracting prospective citizens with abundant career and education opportunities, while Davao City, as a significant contributor to the country's agricultural export industry, is forecast to experience the fastest growth in per capita disposable income, reaching US$6.665.8 by 2040. (Euromonitor International; Philippines: Consumer Profile, page 14, July 21, 2023.)
The average Filipino household size was 4.1 persons in 2023, anticipated to decline to 3.5 persons by 2040. Of the 28.4 million households in 2023, couples with children were the predominant (55.9%) household type mainly due to the prevalence of traditional family lifestyles and strong cultural emphasis on family, while single person households and couples without children represented (11.1%) respectively. (Euromonitor International; Philippines: Consumer Profile, page 13, July 21, 2023.) By 2040, the number of households will reach 37.4 million, and couples with children will remain prevalent, representing 51.7%, while single person households will represent 17.0% and households (other) will represent 12.9% of the country's household types.
The Filipino consumer exhibits brand loyalty based on trust and are willing to invest time in researching products and services before making a purchase. Further, when seeking information, a significant majority (81.8%) rely on recommendations from friends and family, while nearly three-quarters consider independent customer reviews, and over half analyze brand websites. Notably, these behaviors are consistent across all generations in the Philippines (Euromonitor International; Philippines: Consumer Profile, page 11, July 21, 2023.) Relatedly, as inflationary pressure continues to result in rising food prices, 31.0% of respondents said they regularly seek private label and low-cost products when they shop (Consumer Lifestyles in the Philippines, page 23, May 2024). In terms of generations, Millennials are expected to increase their money saving intentions the most over the next 12 months (Consumer Values and Behaviour in the Philippines, page 48, June 11, 2024).
Consumers report that they are more focused on improving their diets: 55.0% of respondents said they would pay more for food with additional health and nutritional benefits (Consumer Lifestyles in the Philippines, page 27, May 2024). For a variety of reasons, including personal health, high prices and sustainability, it is reported that consumers continue to reduce the proportion of meat in their diets, as 26% indicated they are trying to reduce their meat consumption, while 12.0% stated they now eat meat (and fish) only occasionally (Consumer Lifestyles in the Philippines, page 23, May 2024)
Meat and livestock production in the Philippines
The Philippine's primary meat produced was chicken increasing in volume growth by 0.4% annually from 1,414,231 tonnes in 2018 to 1,437,322 tonnes in 2022, while pork (with bone) was the second largest meat produced despite declining 7.0% annually from 1.6 million tonnes to 1.2 million produced, during the same period. Pork, edible offal also experienced declines in growth (7.0%) decreasing from 324,767 tonnes to 243,197 between 2018 to 2022.
Meat | 2018 | 2019 | 2020 | 2021 | 2022 | CAGR* % 2018-2022 |
|---|---|---|---|---|---|---|
Chicken | 1,414,231 | 1,484,109 | 1,393,586 | 1,343,496 | 1,437,322 | 0.4 |
Pork (with bone) | 1,623,835 | 1,607,656 | 1,499,853 | 1,187,305 | 1,215,983 | −7.0 |
Pork, edible offal | 324,767 | 321,531 | 299,971 | 237,461 | 243,197 | −7.0 |
Beef (with bone) | 131,655 | 130,312 | 114,563 | 118,053 | 118,324 | −2.6 |
Buffalo | 71,572 | 70,331 | 60,205 | 64,672 | 65,136 | −2.3 |
Source: FAOSTAT Crops and livestock products, 2024 *CAGR: Compound Annual Growth Rate | ||||||
Chickens and ducks were the Philippine's primary livestock producing 185.1 million and 12.0 million animals respectively in 2022. Swine/pigs experienced the largest decline in annual growth rate (7.0%) as the number of animals decreased from 12.6 million in 2018 to 9.4 million in 2022.
Livestock | 2018 | 2019 | 2020 | 2021 | 2022 | CAGR* % 2018-2022 |
|---|---|---|---|---|---|---|
Chickens | 175,772,000 | 186,370,000 | 178,265,000 | 176,820,000 | 185,102,000 | 1.3 |
Ducks | 11,220,000 | 11,577,000 | 11,794,000 | 12,512,000 | 12,000,000 | 1.7 |
Swine/Pigs | 12,604,441 | 12,709,248 | 12,795,721 | 9,943,119 | 9,426,092 | −7.0 |
Goats | 3,724,808 | 3,755,879 | 3,813,454 | 3,868,337 | 3,908,131 | 1.2 |
Buffalo | 2,882,655 | 2,873,561 | 2,865,715 | 2,849,006 | 2,774,471 | −1.0 |
Source: FAOSTAT Crops and livestock products, 2024 *CAGR: Compound Annual Growth Rate | ||||||
Global trade overview
The global market for meat has experienced positive value growth and increased at a CAGR of 4.7% as imports have increased from US$144.2 billion, 46.4 billion kg in 2018 to US$181.8 billion, 47.4 billion kg in 2023. In 2023, China was the largest market for meat with imports valued at US$26.9 billion (15.8% market share), experiencing the largest increase in value growth (19.4%) of the top markets, from US$11.1 billion reported in 2018, followed by the United States with meat imports of US$13.9 billion (7.7% market share) and Japan, with imports valued at US$13.1 billion (7.2% market share) in 2023.
The Philippines was the twenty-second largest market for meat in the world with imports valued at US$1.9 billion (1.1% market share), 1.2 billion kg in 2023, representing a moderate increase in CAGR of 7.8% from US$1.3 billion, 884.4 million kilograms in 2018. Of interest, the Philippines experienced the largest increase in CAGR (87.2%) as the countrys' imports of meat increased from US$1.0 billion in 2020 to US$2.0 billion in 2021. The Philippines has imported US$1.2 billion, 818.4 million kilograms of meat products year-to-date (January to July 2024).
Canada in comparison, was the eleventh largest market with meat imports of US$3.6 billion (2.0% market share), 696.3 million kilograms in 2023, registering an increase in CAGR of 5.1% from meat imports of US$2.8 billion, 622.1 million kilograms in 2018. Canada has imported US$2.2 billion, 402.3 million kilograms of meat products year-to-date (January to July 2024).
County | 2018 | 2019 | 2020 | 2021 | 2022 | 2023 | CAGR* % 2018-2023 |
|---|---|---|---|---|---|---|---|
Global total | 144,232.7 | 153,335.8 | 155,298.4 | 172,843.5 | 188,761.5 | 181,750.1 | 4.7 |
China | 11,095.2 | 18,888.9 | 30,332.2 | 31,631.7 | 30,891.1 | 26,877.0 | 19.4 |
United States | 9,411.4 | 9,836.3 | 10,543.8 | 13,397.8 | 14,572.1 | 13,998.0 | 8.3 |
Japan | 13,781.1 | 14,198.5 | 13,488.4 | 14,194.2 | 14,700.1 | 13,100.5 | −1.0 |
Germany | 9,789.5 | 9,355.1 | 8,776.0 | 9,191.1 | 10,035.4 | 10,752.2 | 1.9 |
United Kingdom | 8,982.5 | 8,465.3 | 7,966.3 | 7,867.5 | 9,597.7 | 10,205.6 | 2.6 |
France | 6,184.4 | 6,017.4 | 5,661.6 | 6,806.5 | 8,042.9 | 8,744.2 | 7.2 |
Netherlands | 6,122.5 | 5,906.0 | 5,549.0 | 6,148.5 | 7,460.2 | 7,698.6 | 4.7 |
Italy | 5,466.1 | 5,553.7 | 5,032.5 | 5,354.4 | 6,201.9 | 7,297.5 | 6.0 |
Canada (11) | 2,770.6 | 2,684.4 | 2,934.6 | 3,270.8 | 3,621.4 | 3,557.5 | 5.1 |
Philippines (22) | 1,329.5 | 1,303.4 | 1,041.9 | 1,950.6 | 2,359.4 | 1,932.7 | 7.8 |
Source: Global trade tracker, 2024 1: defined by HS codes 02 (meat and edible meat offal), 1602 (prepared or preserved meat, offal or blood) and 1601 (sausages and similar products, of meat, offal or blood) *CAGR: Compound Annual Growth Rate | |||||||
Country | 2018 | 2019 | 2020 | 2021 | 2022 | 2023 | CAGR* % 2018-2023 |
|---|---|---|---|---|---|---|---|
Global total | 46,432.0 | 50,078.9 | 49,713.1 | 51,279.0 | 50,226.0 | 47,384.5 | 0.4 |
China | 4,098.3 | 6,052.9 | 9,765.9 | 9,215.9 | 7,215.7 | 7,234.8 | 12.0 |
Japan | 3,055.5 | 3,088.7 | 2,921.8 | 2,962.1 | 3,063.7 | 2,915.0 | −0.9 |
Mexico | 2,421.9 | 3,841.6 | 2,328.7 | 2,656.6 | 2,685.4 | 2,904.1 | 3.7 |
Germany | 2,791.6 | 2,733.6 | 2,515.1 | 2,467.8 | 2,458.7 | 2,421.9 | −2.8 |
Netherlands | 1,850.4 | 1,939.6 | 1,858.7 | 1,987.6 | 2,188.5 | 2,215.1 | 3.7 |
United States | 1,833.9 | 1,811.0 | 1,899.8 | 2,102.4 | 2,258.2 | 2,187.0 | 3.6 |
United Kingdom | 2,371.5 | 2,249.8 | 2,052.5 | 1,918.8 | 2,158.8 | 2,155.1 | −1.9 |
France | 1,538.5 | 1,519.4 | 1,414.3 | 1,605.0 | 1,748.7 | 1,726.8 | 2.3 |
Philippines (11) | 884.4 | 875.1 | 680.5 | 1,201.3 | 1,433.4 | 1,237.8 | 7.0 |
Canada (17) | 622.1 | 616.8 | 689.5 | 652.0 | 644.8 | 696.3 | 2.3 |
Source: Global trade tracker, 2024 *CAGR: Compound Annual Growth Rate | |||||||
Philippine's trade (import) summary
The Philippines is a net importer of meat products. In 2023, the Philippines imported US$1,932.7 million of meat products from global markets (+7.8% in annual growth from US$1,329.5 million in 2018) and exported US$23.2 million, recording a trade deficit of US$1,909.5 million. Of note, recently (June 20, 2024), President Ferdinand Marcos issued Executive Order (EO) 62, extending the tariff reductions for corn, pork, and mechanically deboned meat through to 2028. The EO took effect 30 days after publication (United States Department of Agriculture (USDA); Livestock and Products Annual, August 2024).
The top three suppliers of meat products to the Philippines were Brazil with values of US$597.6 million (30.9% market share), 406.2 million kilograms, followed by the United States (U.S.) with values of US$343.8 million (17.8% market share), 237.6 million kilograms and Canada with values of US$199.7 million (10.3% market share), 128.7 million kilograms in 2023. Canada's supply of meat products to the Philippines has increased significantly by 11.1% in CAGR from US$117.9 million in 2018. Of the top supplying countries, Brazil and Denmark experienced the largest increases in annual value growth (36.4% and 23.8% respectively) from 2018 to 2023, while Australia declined 5.8% annually, decreasing their product supply from US$165.8 million to US$123.1 million during the same period.
Country | 2018 | 2019 | 2020 | 2021 | 2022 | 2023 | CAGR* % 2018-2023 |
|---|---|---|---|---|---|---|---|
Global total | 1,329.5 | 1,303.4 | 1,041.9 | 1,950.6 | 2,359.4 | 1,932.7 | 7.8 |
Brazil | 126.7 | 169.6 | 177.3 | 385.8 | 658.8 | 597.6 | 36.4 |
United States | 252.1 | 253.5 | 216.8 | 359.4 | 357.0 | 343.8 | 6.4 |
Canada (3) | 117.9 | 115.7 | 83.2 | 220.1 | 224.6 | 199.7 | 11.1 |
Spain | 96.9 | 112.9 | 79.7 | 201.6 | 306.5 | 192.6 | 14.7 |
Australia | 165.8 | 120.8 | 90.6 | 132.3 | 159.5 | 123.1 | −5.8 |
India | 131.5 | 92.0 | 83.0 | 139.2 | 138.2 | 105.9 | −4.2 |
Netherlands | 91.7 | 127.9 | 124.4 | 103.2 | 121.7 | 80.8 | −2.5 |
France | 58.8 | 62.3 | 39.0 | 66.0 | 74.8 | 64.6 | 1.9 |
Denmark | 13.5 | 15.0 | 11.5 | 34.9 | 49.2 | 39.1 | 23.8 |
Ireland | 40.1 | 49.9 | 46.1 | 61.4 | 60.9 | 38.6 | −0.8 |
Source: Global trade tracker, 2024 *CAGR: Compound Annual Growth Rate | |||||||
Country | 2018 | 2019 | 2020 | 2021 | 2022 | 2023 | CAGR* % 2018-2023 |
|---|---|---|---|---|---|---|---|
Global total | 884.4 | 875.1 | 680.5 | 1,201.3 | 1,433.4 | 1,237.8 | 7.0 |
Brazil | 81.7 | 103.1 | 107.4 | 232.5 | 399.1 | 406.2 | 37.8 |
United States | 171.1 | 157.1 | 136.3 | 246.3 | 217.5 | 237.6 | 6.8 |
Spain | 83.6 | 95.7 | 62.3 | 146.8 | 232.9 | 148.8 | 12.2 |
Canada | 81.6 | 82.8 | 59.9 | 150.1 | 148.6 | 128.7 | 9.5 |
Netherlands | 92.0 | 133.6 | 132.0 | 71.2 | 84.3 | 58.9 | −8.5 |
France | 43.5 | 48.8 | 30.8 | 49.5 | 53.2 | 44.0 | 0.2 |
Australia | 52.3 | 35.3 | 24.6 | 38.1 | 48.6 | 40.8 | −4.9 |
India | 46.4 | 33.6 | 29.4 | 44.6 | 49.1 | 38.7 | −3.6 |
Denmark | 10.2 | 9.6 | 7.4 | 24.1 | 36.0 | 26.7 | 21.1 |
United Kingdom | 24.0 | 25.7 | 21.5 | 33.0 | 37.1 | 21.4 | −2.3 |
Source: Global trade tracker, 2024 *CAGR: Compound Annual Growth Rate | |||||||
Brazil, the U.S. and Canada were the top three suppliers of meat products to the Philippine market in 2023, representing market shares of 30.9%, 17.8% and 10.3%, respectively.
The Philippine's top imported meat products included frozen cuts and edible offal of fowls (HS code 020714) valued at US$456.2 million (23.6% market share), 421.4 million kilograms, supplied primarily by Brazil (52.3% market share) and the U.S. (40.4% market share), followed by frozen pork, bone in (HS code 020329) valued at US$438.8 million (22.7% market share), 268.9 million kilograms, supplied mainly by Brazil and Canada representing a combined market share of 61.7%, and frozen boneless beef (HS code 020230) valued at US$438.2 million (22.7% market share), million 137.3kg, supplied mainly by Brazil and India in 2023. Of note, Canada has attained measurable market representation in most of the Philippine's meat product imports, particularly in supplying frozen pork, bone in (25.6% market share) and hams (65.5% market share) in 2023.
HS Code | Description | Import value (US$) | Import volume (kilograms) | Top suppliers and market value share % | Canada's value share % | ||
|---|---|---|---|---|---|---|---|
1 | 2 | 3 | |||||
Meat total | 1,932.7 | 1,237.8 | Brazil: 30.9 | United States: 17.8 | Canada: 10.3 | 10.3 | |
020714 | Frozen cuts and edible offal of fowls | 456.2 | 421.4 | Brazil: 52.3 | United States: 40.4 | Canada: 3.6 | 3.6 |
020329 | Frozen meat of pork, (bone in) | 438.8 | 268.9 | Brazil: 36.1 | Canada: 25.6 | Spain: 8.2 | 25.6 |
020230 | Frozen, boneless beef | 438.2 | 137.3 | Brazil: 39.4 | India: 24.2 | Australia: 18.7 | 0.6 |
020649 | Edible offal, pork (frozen) | 278.1 | 215.6 | Spain: 34.9 | United States: 11.6 | Canada: 10.7 | 10.7 |
020910 | Pig fat, fresh, chilled or frozen | 81.1 | 65.8 | Spain: 50.9 | France: 13.1 | Netherlands: 9.8 | 8.7 |
160232 | Meat or offal of fowls, prepared or preserved | 46.6 | 22.6 | China: 46.2 | Thailand: 41.7 | Brazil: 7.6 | |
020322 | Frozen hams, bone in | 36.4 | 24.1 | Canada: 65.5 | United States: 10.7 | Spain: 8.5 | 65.5 |
160249 | Prepared or preserved meat and offal of pork | 32.4 | 7.8 | United States: 96.8 | China: 1.2 | Denmark: 1.0 | 0.1 |
020641 | Frozen edible livers (pork) | 28.0 | 31.8 | Spain: 27.2 | Brazil: 23.4 | Netherlands: 15.9 | 9.7 |
020220 | Frozen beef cuts (bone in) | 27.2 | 9.1 | Ireland: 39.4 | United States: 17.1 | Netherlands: 11.6 | 0.1 |
Source: Global trade tracker, 2024 | |||||||
Canada's performance
Canada's export market
Canada is a net global exporter of meat products. In 2023, Canada enjoyed a meat product global trade surplus of US$4.2 billion with imports of US$3.6 billion, and exports valued at US$7.8 billion (+7.2% from exports of US$5.5 billion in 2018). Of interest, Canada was the eighth largest (after Germany and Poland) global exporter of meat products in 2023.
Top export markets for Canadian meat products in 2023 were the United States (62.1% market share), followed by Japan (12.2% market share) and Mexico (6.8% market share). The Philippine's in comparison, was Canada's sixth largest export market for meat products with values of US$241.2 million (3.1% market share) in 2023, representing a significant increase in annual growth of 18.6% from US$102.7 million in 2018 (+169.2% annually from exports of US$105.6 million in 2020 to US$284.3 million in 2021).
Canada's top three meat products exported to the Philippines were frozen pork, bone in (HS code: 020329) with values of US$126.3 million (52.4% market share), followed by frozen hams, bone in (HS code: 020322) with values of US$69.8 million (28.9% market share), increasing significantly by 68.1% annually from US$5.2 million in 2018 and edible offal pork, frozen (HS code: 020649) with US$19.6 million (8.1% market share) in 2023, increasing 23.7% in annual growth from US$6.8 million supplied in 2018. Of note, Canada's supply of frozen pork carcasses (HS code 020321) and salted hams (HS code 021011) experienced the greatest annual growth performance, increasing 82.4% (from US$0.1 million to US$1.2 million) and 90.5% (from US$39,590 to US$993,561) respectively, during the historic period. Canada has exported US$155.4 million, 84.9 million kilograms of meat products to the Philippines year-to-date (January to July 2024).
HS Code | Description | 2018 | 2019 | 2020 | 2021 | 2022 | 2023 | CAGR* % 2018-2023 | Market share % in 2023 |
|---|---|---|---|---|---|---|---|---|---|
Meat total | 102.7 | 110.2 | 105.6 | 284.3 | 261.1 | 241.2 | 18.6 | 100.0 | |
020329 | Frozen meat of pork (bone in) | 62.3 | 63.6 | 59.0 | 141.7 | 145.8 | 126.3 | 15.2 | 52.4 |
020322 | Frozen hams, with bone in | 5.2 | 7.1 | 12.1 | 59.4 | 54.3 | 69.8 | 68.1 | 28.9 |
020649 | Edible offal pork, (frozen) | 6.8 | 9.8 | 9.0 | 28.9 | 27.6 | 19.6 | 23.7 | 8.1 |
020714 | Frozen cuts and edible offal of fowls | 12.5 | 15.5 | 14.3 | 27.5 | 10.9 | 9.1 | −6.2 | 3.8 |
020910 | Pig fat, fresh, chilled or frozen | 1.4 | 4.0 | 4.0 | 7.2 | 67 | 5.6 | 31.5 | 2.3 |
020629 | Frozen edible beef offal | 6.7 | 3.1 | 1.8 | 7.2 | 6.3 | 4.5 | −7.8 | 1.9 |
020641 | Frozen edible livers (pork) | 0.5 | 0.6 | 0.5 | 0.7 | 0.8 | 1.6 | 27.0 | 0.7 |
020321 | Frozen carcasses/half carcasses, pork | 0.1 | 0.6 | 0.2 | 0.3 | 1.0 | 1.2 | 82.4 | 0.5 |
021011 | Hams, salted, in brine, dried or smoked, with bone in | 0.0 | 0.1 | 0.0 | 0.0 | 0.5 | 1.0 | 90.5 | 0.4 |
020319 | Fresh or chilled pork (bone in) | 1.2 | 2.1 | 1.4 | 3.9 | 2.4 | 0.8 | −8.2 | 0.3 |
Source: Global trade tracker, 2024 *CAGR: Compound Annual Growth Rate | |||||||||
Québec was predominant in supplying meat products to the Philippines, occupying a 61.0% market share, followed by Manitoba with a 15.3% market share and Ontario, representing an 9.6% market share in 2023.
Canada's largest meat export to the Philippines was frozen meat of pork, bone in (HS code: 020329), supplied mainly by Québec and Manitoba, providing 58.9% and 22.8% respectively, while frozen hams with bone in (HS code 020322) as the second largest meat export segment, was provided primarily by Québec, occupying a 74.7% market share in 2023.
HS Code | Description | Export value (US$) | Export volume (kg) | Top provincial suppliers and market value share % | ||
|---|---|---|---|---|---|---|
Meat total | 241,156,621 | 125,511,005 | Québec: 61.0 | Manitoba: 15.3 | Ontario: 9.6 | |
020329 | Frozen meat of pork (bone in) | 126,285,593 | 58,322,690 | Québec: 58.9 | Manitoba: 22.8 | Ontario: 8.6 |
020322 | Frozen hams, with bone in | 69,803,176 | 33,467,373 | Québec: 74.7 | Alberta: 8.0 | Ontario: 6.9 |
020649 | Edible offal pork, (frozen) | 19,647,006 | 10,107,562 | Québec: 59.5 | Ontario: 23.1 | Manitoba: 15.0 |
020714 | Frozen cuts and edible offal of fowls | 9,086,912 | 13,969,966 | Alberta: 23.4 | Québec: 21.6 | British Columbia: 19.8 |
020910 | Pig fat, fresh, chilled or frozen | 5,555,198 | 3,776,475 | Québec: 64.3 | Ontario: 12.8 | Manitoba: 11.5 |
020629 | Frozen edible beef offal | 4,488,259 | 1,671,062 | Alberta: 100.0 | ||
020641 | Frozen edible livers (pork) | 1,597,151 | 1,737,342 | Ontario: 33.1 | Alberta: 28.3 | British Columbia: 19.7 |
020321 | Frozen carcasses/half carcasses, pork | 1,150,781 | 456,294 | Québec: 100.0 | ||
021011 | Hams, salted, dried or smoked, with bone in | 993,561 | 360,860 | Québec: 93.3 | Ontario: 6.7 | |
020319 | Fresh or chilled pork (bone in) | 796,045 | 338,972 | Québec: 59.3 | Ontario: 30.3 | Manitoba: 10.3 |
Source: Global trade tracker, 2024 | ||||||
Market size (per capita) of fresh and processed meat
The Philippine's per capita fresh meat retail sales were the larger of the fresh and processed meats, equivalent to US$73.1 in 2023, increasing 9.6% in annual growth from US46.3 in 2018, while per capita processed meat retail sales in comparison, reached US$18.7 in 2023, increasing 11.0% annually from US$11.1 in 2018.
In the fresh meat category, per capita pork sales were the largest with US$38.0 (52.0% market share) in 2023, increasing 6.6% from US$27.6 in 2018, followed by per capita retail sales of beef and veal, which experienced the greatest growth performance of the segments, increasing 16.4% annually, as per capita retail sales grew from US$9.0 in 2018 to US$19.2 in 2023. In the processed meat category, chilled and frozen processed meat represented the majority of the Philippine's per capita retail sales with values of US$7.1 and US$7.0 respectively in 2023, attaining a combined market share of 75.4% in 2023.
In the forecast period, the Philippine's per capita fresh and processed meat retail sales will remain positive, albeit at lower rates, with the exception of the poultry segment, which is expected to decline in growth by 1.2%, as per capita retail sales decrease from US$14.1 in 2023 to US$13.3 in 2028. Of interest, per capita retail sales of other meat are expected to experience the largest increase in annual growth (8.4%), as retail sales grow from US$0.2 in in 2023 to US$0.3 in 2028.
Category | 2018 | 2023 | CAGR* % 2018-2023 | 2024 | 2028 | CAGR* % 2023-2028 | Market share % in 2023 |
|---|---|---|---|---|---|---|---|
Fresh meat (total) | 46.3 | 73.1 | 9.6 | 70.9 | 76.4 | 0.9 | 100.0 |
Beef and Veal | 9.0 | 19.2 | 16.4 | 18.8 | 22.1 | 2.9 | 26.3 |
Lamb, Mutton and Goat | 1.1 | 1.6 | 7.8 | 1.5 | 1.7 | 1.2 | 2.2 |
Pork | 27.6 | 38.0 | 6.6 | 37.1 | 39.0 | 0.5 | 52.0 |
Poultry | 8.4 | 14.1 | 10.9 | 13.2 | 13.3 | −1.2 | 19.3 |
Other Meat | 0.2 | 0.2 | 0.0 | 0.3 | 0.3 | 8.4 | 0.3 |
Processed meat (total) | 11.1 | 18.7 | 11.0 | 19.9 | 24.6 | 5.6 | 100.0 |
Shelf Stable Meat | 2.6 | 4.6 | 12.1 | 4.9 | 6.1 | 5.8 | 24.6 |
Chilled Processed Meat | 4.2 | 7.1 | 11.1 | 7.4 | 9.2 | 5.3 | 38.0 |
Frozen Processed Meat | 4.2 | 7.0 | 10.8 | 7.5 | 9.3 | 5.8 | 37.4 |
Source: Euromonitor International, 2024 *CAGR: Compound Annual Growth Rate | |||||||
In comparison, Canada's per capita fresh and processed meat retail sales were greater than that of the Filipino consumer, with fresh meat also attaining larger retail sales (US$313.2) in comparison to processed meat per capita retail sales of US$110.1 in 2023.
In the fresh meat category, per capita meat retail sales were the highest within the pork and poultry segments (US$113.4 and US$104.4 respectively, in 2023) representing a combined market share of 69.5%, while per capita retail sales in the chilled processed meat segment were greater than both frozen and shelf-stable meat, with values of US$95.6 (86.8% market share) in 2023.
In the forecast period, Canadian per capita retail sales of fresh and processed meats will remain positive, with lower annual growth rates, with the exception of the beef and veal segment, which is expected to decline slightly in growth by 1.1% as per capita retail sales decrease from US$92.4 in 2023 to US$87.6 by 2028, while in the processed meat category, per capita retail sales of shelf stable meat are anticipated to slightly decline in annual growth also by 1.1% from US$1.8 to US$1.7 during the same period.
Category | 2018 | 2023 | CAGR* % 2018-2023 | 2024 | 2028 | CAGR* % 2023-2028 | Market share % in 2023 |
|---|---|---|---|---|---|---|---|
Fresh meat (total) | 270.3 | 313.2 | 3.0 | 312.6 | 344.7 | 1.9 | 100.0 |
Beef and Veal | 88.3 | 92.4 | 0.9 | 88.2 | 87.6 | −1.1 | 29.5 |
Lamb, Mutton and Goat | 2.2 | 2.6 | 3.4 | 2.6 | 2.8 | 1.5 | 0.8 |
Pork | 92.6 | 113.4 | 4.1 | 115.6 | 129.0 | 2.6 | 36.2 |
Poultry | 86.7 | 104.4 | 3.8 | 105.7 | 124.8 | 3.6 | 33.3 |
Other Meat | 0.5 | 0.5 | 0.0 | 0.5 | 0.5 | 0.0 | 0.2 |
Processed meat (total) | 95.6 | 110.1 | 2.9 | 108.4 | 118.7 | 1.5 | 100.0 |
Shelf Stable Meat | 1.7 | 1.8 | 1.1 | 1.7 | 1.7 | −1.1 | 1.6 |
Chilled Processed Meat | 83.0 | 95.6 | 2.9 | 94.2 | 103.4 | 1.6 | 86.8 |
Frozen Processed Meat | 10.9 | 12.7 | 3.1 | 12.5 | 13.6 | 1.4 | 11.5 |
Source: Euromonitor International, 2024 *CAGR: Compound Annual Growth Rate | |||||||
Retail sales of fresh meat
Global retail sales of fresh meat
Global retail sales of fresh meat (fresh, raw, uncooked and unprocessed meat [beef & veal, lamb, mutton & goat, pork, poultry and other meat] whether packaged or unpackaged, chilled or frozen) have increased 7.9% in CAGR from US$638.5 billion in 2018 to US$934.5 billion in 2023 and are expected to increase in CAGR by an additional 6.6% as retail sales attain US$1.3 trillion by 2028.
China was the largest global market with retail sales of US$212.4 billion (22.7% market share), followed by the U.S. with retail sales of US$108.9 billion (11.6% market share) and Brazil with retail sales of US$88.0 billion (9.4% market share) in 2023, representing an increase in CAGR of 13.3%, as the country's retail sales of fresh meat grew from US$47.0 billion in 2018.
The Philippines was the twenty-second largest global retail sales market for fresh meat, after Saudi Arabia and Egypt, with retail sales of US$8.4 billion (0.9% market share) in 2023. The country has experienced a moderate increase in CAGR of 10.6% from retail sales of US$5.1 billion in 2018 and is expected to grow an additional 1.7% in the forecast period to US$9.1 billion by 2028.
Canada in comparison, was the sixteenth largest retail sales market for fresh meat, accounting for a 1.3% retail sale market share with values of US$12.6 billion in 2023. Similarly, Canada is also expected to achieve positive growth with an increase in CAGR of 3.2% as retail sales are anticipated to increase to US$14.7 billion by 2028.
Country | 2018 | 2023 | CAGR* % 2018-2023 | 2024 | 2028 | CAGR* % 2023-2028 |
|---|---|---|---|---|---|---|
Global retail sales of fresh meat (total) | 638,542.7 | 934,464.6 | 7.9 | 992,350.5 | 1,288,011.7 | 6.6 |
China | 133,578.2 | 212,393.5 | 9.7 | 216,728.6 | 248,062.1 | 3.2 |
United States | 77,624.7 | 108,855.6 | 7.0 | 113,978.1 | 135,133.8 | 4.4 |
Brazil | 47,045.2 | 88,026.0 | 13.3 | 97,933.4 | 139,678.0 | 9.7 |
India | 28,973.2 | 36,196.5 | 4.6 | 39,280.4 | 52,123.3 | 7.6 |
Japan | 32,817.8 | 35,981.8 | 1.9 | 36,993.2 | 40,466.2 | 2.4 |
Italy | 25,779.4 | 32,588.1 | 4.8 | 34,104.0 | 38,475.4 | 3.4 |
France | 24,551.7 | 32,076.5 | 5.5 | 33,573.9 | 36,793.4 | 2.8 |
Mexico | 20,221.6 | 31,590.5 | 9.3 | 34,078.4 | 45,238.1 | 7.4 |
Canada (16) | 10,021.6 | 12,557.1 | 4.6 | 12,936.0 | 14,729.2 | 3.2 |
Philippines (22) | 5,069.8 | 8,401.8 | 10.6 | 8,218.7 | 9,136.5 | 1.7 |
Source: Euromonitor International, 2024 1: the aggregation of beef and veal, lamb, mutton and goat, pork, poultry and other meat. Only includes fresh, raw, uncooked and unprocessed meat whether packaged or unpackaged, chilled or frozen. *CAGR: Compound Annual Growth Rate | ||||||
Association of Southeast Asian Nations retail sales of fresh meat
Association of Southeast Asian Nations (ASEAN) retail sales of fresh meat have increased 7.9% annually from US$27.0 billion in 2018 to US$39.6 billion in 2023 and are expected to increase a further 4.7% annually as retail sales attain US$49.8 billion by 2028.
Vietnam was the largest ASEAN market for fresh meat with retail sales of US$13.7 billion (34.7% market share), followed by the Philippines with retail sales of US$8.4 billion (21.2% market share) and Indonesia with retail sales of US$7.1 billion (17.9% market share) in 2023 (+13.1% from US$3.8 billion in 2018).
Geography | 2018 | 2023 | CAGR* % 2018-2023 | 2024 | 2028 | CAGR* % 2023-2028 |
|---|---|---|---|---|---|---|
ASEAN retail sales of fresh meat (reporting country total) | 27,045.6 | 39,599.7 | 7.9 | 40,422.2 | 49,769.3 | 4.7 |
Indonesia | 3,830.4 | 7,084.3 | 13.1 | 6,898.0 | 7,814.4 | 2.0 |
Malaysia | 2,247.0 | 3,521.8 | 9.4 | 3,344.3 | 3,465.4 | −0.3 |
Philippines | 5,069.8 | 8,401.8 | 10.6 | 8,218.7 | 9,136.5 | 1.7 |
Singapore | 719.0 | 1,065.7 | 8.2 | 1,046.0 | 1,123.3 | 1.1 |
Thailand | 4,582.9 | 5,789.1 | 4.8 | 6,264.7 | 8,070.5 | 6.9 |
Vietnam | 10,596.5 | 13,737.0 | 5.3 | 14,650.5 | 20,159.2 | 8.0 |
Source: Euromonitor International, 2024 1: countries include the Philippines, Malaysia, Singapore, Indonesia, Thailand, Brunei Darussalam, Lao, Cambodia Myanmar and Vietnam (fresh meat data available only for listed [reported] countries). *CAGR: Compound Annual Growth Rate | ||||||
Retail sales of fresh meat in the Philippines
Pork was the largest category of fresh meat with retail sales of US$4.4 billion (51.9% market share), followed by beef and veal with retail sales of US$2.2 billion (26.3% market share) and poultry with retail sales of US$1.6 billion (19.3% market share) in 2023. Of note, all categories of fresh meat experienced moderate increases in growth performance during the historic period. The beef and veal category experienced the largest increase in annual growth (17.5%) as retail sales increased from US$985.3 million in 2018 (to US$2.2 billion in 2023), and recently increased 12.8% annually from retail sales of US$1.9 billion in 2022. Poultry also experienced an increase of 12.0% in annual growth from US$917.9 million in 2018 to US$1.6 billion in 2023 (+9.0% from US$1.5 billion in 2022.
Category | 2018 | 2019 | 2020 | 2021 | 2022 | 2023 |
|---|---|---|---|---|---|---|
Fresh meat (total) | 5,069.8 | 5,290.7 | 6,387.0 | 7,085.4 | 7,643.7 | 8,401.8 |
Beef and Veal | 985.3 | 1,132.3 | 1,502.5 | 1,635.9 | 1,960.2 | 2,210.5 |
Lamb, Mutton and Goat | 123.9 | 138.7 | 167.7 | 152.0 | 171.6 | 183.2 |
Pork | 3,023.8 | 2,896.3 | 3,124.7 | 3,967.0 | 4,001.3 | 4,361.5 |
Poultry | 917.9 | 1,104.7 | 1,572.3 | 1,308.1 | 1,485.4 | 1,619.2 |
Other Meat | 18.9 | 18.8 | 19.9 | 22.4 | 25.0 | 27.4 |
Source: Euromonitor International, 2024 | ||||||
Category | Annual growth % 2022-2023 | CAGR* % 2018-2023 | Total growth % 2018-2023 |
|---|---|---|---|
Fresh meat (total) | 9.9 | 10.6 | 65.7 |
Beef and Veal | 12.8 | 17.5 | 124.3 |
Lamb, Mutton and Goat | 6.8 | 8.1 | 47.9 |
Pork | 9.0 | 7.6 | 44.2 |
Poultry | 9.0 | 12.0 | 76.4 |
Other Meat | 9.6 | 7.7 | 45.0 |
Source: Euromonitor International, 2024 *CAGR: Compound Annual Growth Rate | |||
In the forecast period, the fresh meat market is expected to remain positive, albeit at a lower growth rate of 1.7% overall between 2023 to 2028, with the exception of poultry, which is expected to decline slightly by 0.3% from US$1,619.2 million in 2023 to US$1,595.0 million by 2028 (−5.3% in annual growth between 2023 to 2024). Of interest, the other meat category are anticipated to experience the greatest performance, increasing 5.4% annually from US$27.4 million in 2023 to US$35.7 million in 2028.
Category | 2024 | 2025 | 2026 | 2027 | 2028 |
|---|---|---|---|---|---|
Fresh meat (total) | 8,218.7 | 8,461.3 | 8,698.1 | 8,941.6 | 9,136.5 |
Beef and Veal | 2,180.8 | 2,304.2 | 2,430.9 | 2,563.2 | 2,648.4 |
Lamb, Mutton and Goat | 178.4 | 184.1 | 188.5 | 192.9 | 197.4 |
Pork | 4,297.1 | 4,385.4 | 4,472.1 | 4,565.3 | 4,660.1 |
Poultry | 1,533.3 | 1,557.0 | 1,574.4 | 1,586.3 | 1,595.0 |
Other Meat | 29.1 | 30.7 | 32.3 | 33.9 | 35.7 |
Source: Euromonitor International, 2024 | |||||
Category | Annual growth % 2023-2024 | CAGR* % 2023-2028 | Total growth % 2023-2028 |
|---|---|---|---|
Fresh meat (total) | −2.2 | 1.7 | 8.7 |
Beef and Veal | −1.3 | 3.7 | 19.8 |
Lamb, Mutton and Goat | −2.6 | 1.5 | 7.8 |
Pork | −1.5 | 1.3 | 6.8 |
Poultry | −5.3 | −0.3 | −1.5 |
Other Meat | 6.2 | 5.4 | 30.3 |
Source: Euromonitor International, 2024 *CAGR: Compound Annual Growth Rate | |||
Volume sales of fresh meat in the Philippines
Total volume sales (retail, foodservice and institutional) of fresh meat in the Philippines was equivalent to 3.5 million tonnes in 2023, increasing 2.9% in annual growth from 3.0 million tonnes in 2018. Pork was the largest category of fresh meat with volume sales of 1.6 million tonnes (45.3% market share), followed by poultry with volume sales of 1.3 million tonnes (38.8% market share) and beef and veal with volume sales of 481.5 thousand tonnes (13.9% market share) in 2023. Of interest, beef and veal experienced the greatest volume sales performance increasing 5.9% annually from 360.9 thousand tonnes in 2018, and more recently, 3.0% annually from 467.7 thousand tonnes in 2022.
Category | 2018 | 2019 | 2020 | 2021 | 2022 | 2023 |
|---|---|---|---|---|---|---|
Meat (total) | 3,008.3 | 2,746.2 | 2,953.9 | 3,338.5 | 3,402.0 | 3,473.0 |
Beef and Veal | 360.9 | 396.6 | 421.2 | 443.4 | 467.7 | 481.5 |
Lamb, Mutton and Goat | 48.4 | 50.0 | 49.4 | 51.1 | 51.5 | 51.8 |
Pork | 1,557.1 | 1,145.8 | 1,228.0 | 1,554.8 | 1,557.6 | 1,573.8 |
Poultry | 1,026.0 | 1,137.5 | 1,240.7 | 1,272.5 | 1,307.2 | 1,347.3 |
Other Meat | 15.9 | 16.3 | 14.6 | 16.8 | 18.0 | 18.6 |
Source: Euromonitor International, 2024 1: encompasses not only retail sales, but also fresh meat sales to foodservice and institutional (military, prisons, work/school canteens, hospitals, etc.) channels. | ||||||
Category | Annual growth % 2022-2023 | CAGR* % 2018-2023 | Total growth % 2018-2023 |
|---|---|---|---|
Meat (total) | 2.1 | 2.9 | 15.4 |
Beef and Veal | 3.0 | 5.9 | 33.4 |
Lamb, Mutton and Goat | 0.6 | 1.4 | 7.0 |
Pork | 1.0 | 0.2 | 1.1 |
Poultry | 3.1 | 5.6 | 31.3 |
Other Meat | 3.3 | 3.2 | 17.0 |
Source: Euromonitor International, 2024 *CAGR: Compound Annual Growth Rate | |||
In the forecast period, total volume sales of fresh meat are anticipated to increase in CAGR by 1.3% to attain 3.7 million tonnes by 2028. All segments of fresh meat will experience measured growth in volume sales in the forecast period with the exception of the pork category, which is anticipated to decline slightly in annual growth by 0.1% from 1,573.4 thousand tonnes in 2023 to 1,566.4 thousand tonnes by 2028.
Category | 2024 | 2025 | 2026 | 2027 | 2028 |
|---|---|---|---|---|---|
Meat (total) | 3,520.2 | 3,566.8 | 3,611.7 | 3,656.4 | 3,697.7 |
Beef and Veal | 492.2 | 503.3 | 513.8 | 522.5 | 528.6 |
Lamb, Mutton and Goat | 52.1 | 52.5 | 52.9 | 53.2 | 53.4 |
Pork | 1,573.4 | 1,571.4 | 1,569.1 | 1,568.0 | 1,566.4 |
Poultry | 1,383.4 | 1,420.0 | 1,455.7 | 1,491.9 | 1,528.0 |
Other Meat | 19.2 | 19.7 | 20.2 | 20.7 | 21.3 |
Source: Euromonitor International, 2024 | |||||
Category | Annual growth % 2023-2024 | CAGR* % 2023-2028 | Total growth % 2023-2028 |
|---|---|---|---|
Meat (total) | 1.4 | 1.3 | 6.5 |
Beef and Veal | 2.2 | 1.9 | 9.8 |
Lamb, Mutton and Goat | 0.6 | 0.6 | 3.1 |
Pork | 0.0 | −0.1 | −0.5 |
Poultry | 2.7 | 2.5 | 13.4 |
Other Meat | 3.2 | 2.7 | 14.5 |
Source: Euromonitor International, 2024 *CAGR: Compound Annual Growth Rate | |||
Processed meat retail sales
Global retail sales of processed meat
Global retail sales of processed meat (shelf stable meat, chilled processed meat and frozen processed meat) have increased 7.3% in CAGR from US$141.2 billion in 2018 to US$201.2 billion in 2023 and are expected to increase in CAGR by an additional 6.0% as retail sales attain US$268.7 billion by 2028.
The U.S. was the largest global market for processed meat with retail sales of US$46.8 billion (23.3% market share), followed by China with retail sales of US$14.8 billion (7.3% market share) and Germany with retail sales of US$13.0 billion (6.5% market share) in 2023. Russia experienced the second largest increase in CAGR, as the country's retail sales grew 10.1% from US$5.7 billion in 2018 to US$9.3 billion in 2023 and is forecast to increase 7.2% annually to reach US$13.1 billion by 2028.
The Philippines was the sixteenth largest global market for processed meats with retail value sales of US$2.1 billion (1.1% market share) in 2023, representing the largest increase in CAGR (12.1%) of the top markets identified, from retail sales of US$1.2 billion in 2018. The country is expected to continue to increase at a growth rate of 6.5% annually as retail sales attain US$2.9 billion by 2028. Canada in comparison, was the tenth largest global retail sales market for processed meat, accounting for a 2.2% market share with values of US$4.4 billion in 2023. Similarly, Canada is also expected to increase in annual growth (2.8%) in the forecast period to reach retail sales of US$5.1 billion by 2028.
Country | 2018 | 2023 | CAGR* % 2018-2023 | 2024 | 2028 | CAGR* % 2023-2028 |
|---|---|---|---|---|---|---|
Global retail sales of processed meat (total) | 141,229.7 | 201,216.0 | 7.3 | 212,937.5 | 268,724.4 | 6.0 |
United States | 30,390.5 | 46,793.1 | 9.0 | 49,366.3 | 55,771.4 | 3.6 |
China | 11,485.0 | 14,782.8 | 5.2 | 15,395.5 | 17,831.2 | 3.8 |
Germany | 10,852.6 | 13,034.6 | 3.7 | 12,438.2 | 12,819.4 | −0.3 |
Italy | 9,647.1 | 13,017.6 | 6.2 | 13,485.6 | 15,635.1 | 3.7 |
France | 10,118.7 | 12,610.8 | 4.5 | 12,982.3 | 13,958.6 | 2.1 |
Japan | 8,763.7 | 9,984.2 | 2.6 | 10,115.2 | 10,620.8 | 1.2 |
Russia | 5,730.1 | 9,260.8 | 10.1 | 9,975.1 | 13,088.0 | 7.2 |
United Kingdom | 6,611.9 | 8,131.4 | 4.2 | 8,400.1 | 9,483.9 | 3.1 |
Canada (10) | 3,543.5 | 4,414.3 | 4.5 | 4,485.7 | 5,072.5 | 2.8 |
Philippines (16) | 1,213.0 | 2,149.1 | 12.1 | 2,303.7 | 2,938.6 | 6.5 |
Source: Euromonitor International, 2024 1: includes shelf stable meat, chilled processed meat and frozen processed meat. Typically, an additional ingredient or characteristic must also be added during processing, such as seasoning, sauce, marinade, breading, etc. The product may also be cooked, meaning that it must only be defrosted and/or reheated before consumption, and sold via retail and foodservice outlets as a pre-packaged product. *CAGR: Compound Annual Growth Rate | ||||||
Association of Southeast Asian Nations retail sales of processed meat
ASEAN retail sales of processed meat have increased 10.3% annually from US$3.1 billion in 2018 to US$5.1 billion in 2023 and is expected to increase in CAGR by an additional 10.2% to reach US$8.2 billion by 2028.
The Philippines was the largest ASEAN market for processed meat with retail sales of US$2.1 billion (42.4% market share), followed by Indonesia with US$1.6 billion (31.5% market share) and Malaysia with US$434.0 million (8.6% market share) in 2023. Of interest, Myanmar experienced the largest increase in CAGR as the country's retail sales grew 21.9% from US$28.4 million in 2018 to US$76.5 million in 2023, while in the forecast period, Indonesia is anticipated to increase 16.3% in annual growth from US$1.6 billion in 2023 to US$3.4 billion by 2028.
Country | 2018 | 2023 | CAGR* % 2018-2023 | 2024 | 2028 | CAGR* % 2023-2028 |
|---|---|---|---|---|---|---|
ASEAN retail sales of processed meat (total) | 3,102.6 | 5,063.4 | 10.3 | 5,586.2 | 8,219.9 | 10.2 |
Brunei Darussalam-modelled | 20.6 | 25.1 | 4.0 | 25.7 | 28.0 | 2.2 |
Cambodia-modelled | 9.4 | 12.7 | 6.2 | 12.7 | 14.8 | 3.1 |
Indonesia | 961.0 | 1,595.3 | 10.7 | 1,872.4 | 3,392.6 | 16.3 |
Laos-modelled | 2.1 | 3.8 | 12.6 | 3.7 | 3.9 | 0.5 |
Malaysia | 351.8 | 434.0 | 4.3 | 447.0 | 537.3 | 4.4 |
Myanmar-modelled | 28.4 | 76.5 | 21.9 | 76.3 | 102.4 | 6.0 |
Philippines | 1,213.0 | 2,149.1 | 12.1 | 2,303.7 | 2,938.6 | 6.5 |
Singapore | 116.2 | 158.3 | 6.4 | 167.9 | 200.0 | 4.8 |
Thailand | 248.0 | 399.2 | 10.0 | 443.6 | 649.7 | 10.2 |
Vietnam | 152.1 | 209.4 | 6.6 | 233.2 | 352.6 | 11.0 |
Source: Euromonitor International, 2024 *CAGR: Compound Annual Growth Rate | ||||||
Retail sales of processed meat in the Philippines
Retail sales of processed meat in the Philippines was valued at US$2.1 billion in 2023. During the 2018-2023 period, this market grew significantly at a CAGR of 12.1% from US$1.2 billion in 2018 (+18.9% between 2019-2020) and most recently, retail sales of processed meat have increased 11.2% annually from US$1.9 billion in 2022. Of note, all categories of processed meat (shelf stable, chilled and frozen) retail sales experienced significant annual growth within the historic period ranging from 11.3% to 12.9%.
Chilled processed meat was the largest category of processed meat in the Filipino market with retail sales of US$811.5 million (37.8% market share. Frozen processed meat was the second largest category of processed meats with retail sales of US$808.9 million (37.6% market share), followed by the shelf stable category with retail sales of US$528.8 million (24.6% market share) in 2023.
Segment retail sales within chilled processed meat were led by red meat with values of US$798.4 million (98.4% market share) in 2023 (+12.0% in annual growth from US$453.1 million in 2018), while retail sales of chilled poultry, despite lower retail sales of US$13.1 million (1.6% market share) in 2023, also experienced significant annual growth (12.4%),from US$7.3 million in 2018.
In the frozen processed meat category, red meat was again leading sales, increasing 11.9% annually from US$332.2 million in 2018 to US$583.4 million in 2023 (+12.0% annually from US$520.9 million in 2022), while frozen poultry with lower retail sales of US$225.4 million in 2023, also performed well, increasing 11.3% annually from US$131.9 million in 2018. Primary frozen poultry products in 2023 included nuggets with retail sales of US$145.4 million (64.5% frozen poultry market share), increasing 11.8% annually from US$83.1 million in 2018, sausages with retail sales of US$35.4 million (15.7% frozen poultry market share), increasing 12.1% annually from US$20.0 million in 2018, and barbeque chicken with retail sales of US$23.2 million (10.3% frozen poultry market share) in 2023.
Shelf stable processed meat, similar to the chilled and frozen categories, were also led by the red meat segment, as retail sales grew 12.9% annually from US$286.5 million in 2018 to US$525.5 million (99.4% of the shelf stable market share) in 2023, while shelf stable poultry increased 10.5% annually from US$2.0 million to US$3.3 million, during the same period.
Category | 2018 | 2019 | 2020 | 2021 | 2022 | 2023 |
|---|---|---|---|---|---|---|
Processed Meat (Total) | 1,213.0 | 1,314.2 | 1,562.6 | 1,728.6 | 1,933.1 | 2,149.1 |
Shelf Stable Meat | 288.5 | 307.3 | 377.2 | 418.6 | 476.4 | 528.8 |
Shelf Stable Processed Red Meat | 286.5 | 305.1 | 374.7 | 415.9 | 473.4 | 525.5 |
Shelf Stable Processed Poultry | 2.0 | 2.2 | 2.5 | 2.7 | 3.0 | 3.3 |
Chilled Processed Meat | 460.4 | 500.9 | 596.1 | 658.7 | 734.2 | 811.5 |
Chilled Processed Red Meat | 453.1 | 492.9 | 586.5 | 648.1 | 722.5 | 798.4 |
Chilled Processed Poultry | 7.3 | 7.9 | 9.6 | 10.6 | 11.7 | 13.1 |
Frozen Processed Meat | 464.1 | 506.0 | 589.2 | 651.3 | 722.5 | 808.9 |
Frozen Processed Red Meat | 332.2 | 363.1 | 423.8 | 469.0 | 520.9 | 583.4 |
Frozen Processed Poultry | 131.9 | 142.9 | 165.4 | 182.2 | 201.5 | 225.4 |
Source: Euromonitor International, 2024 | ||||||
Category | Annual growth % 2022-2023 | CAGR* % 2018-2023 | Total growth % 2018-2023 |
|---|---|---|---|
Processed Meat (Total) | 11.2 | 12.1 | 77.2 |
Shelf Stable Meat | 11.0 | 12.9 | 83.3 |
Shelf Stable Processed Red Meat | 11.0 | 12.9 | 83.4 |
Shelf Stable Processed Poultry | 10.0 | 10.5 | 65.0 |
Chilled Processed Meat | 10.5 | 12.0 | 76.3 |
Chilled Processed Red Meat | 10.5 | 12.0 | 76.2 |
Chilled Processed Poultry | 12.0 | 12.4 | 79.5 |
Frozen Processed Meat | 12.0 | 11.8 | 74.3 |
Frozen Processed Red Meat | 12.0 | 11.9 | 75.6 |
Frozen Processed Poultry | 11.9 | 11.3 | 70.9 |
Source: Euromonitor International, 2024 *CAGR: Compound Annual Growth Rate | |||
In the forecast period, the processed meat market is expected to remain positive, with a lower growth rate of 6.5%, as retail sales in the category continue to increase from US$2.1 billion in 2023 to US$2.9 billion by 2028. Similar to the historic period, all categories of processed meat (shelf stable, chilled and frozen) retail sales will experience continued growth, albeit at lower rates, in the forecast period.
Euromonitor International also notes that as more Filipinos seek to follow healthier lifestyles, the consumption of shelf stable seafood, and the exploration of alternatives to meat (plant-based diets), will likely grow in the forecast period (Euromonitor International; Processed Meat, Seafood and Alternatives to Meat in the Philippines, November 2023).
Category | 2024 | 2025 | 2026 | 2027 | 2028 |
|---|---|---|---|---|---|
Processed Meat (Total) | 2,303.7 | 2,466.8 | 2,624.7 | 2,783.0 | 2,938.6 |
Shelf Stable Meat | 568.6 | 605.5 | 642.8 | 684.9 | 726.0 |
Shelf Stable Processed Red Meat | 565.1 | 601.9 | 638.9 | 680.8 | 721.7 |
Shelf Stable Processed Poultry | 3.5 | 3.7 | 3.9 | 4.1 | 4.4 |
Chilled Processed Meat | 862.4 | 923.1 | 984.5 | 1,042.5 | 1,100.1 |
Chilled Processed Red Meat | 848.4 | 908.1 | 968.5 | 1,025.6 | 1,082.3 |
Chilled Processed Poultry | 14.0 | 15.0 | 15.9 | 16.9 | 17.8 |
Frozen Processed Meat | 872.7 | 938.2 | 997.5 | 1,055.6 | 1,112.5 |
Frozen Processed Red Meat | 628.3 | 675.0 | 714.8 | 752.6 | 788.6 |
Frozen Processed Poultry | 244.4 | 263.2 | 282.6 | 303.0 | 323.9 |
Source: Euromonitor International, 2024 | |||||
Category | Annual growth % 2023-2024 | CAGR* % 2023-2028 | Total growth % 2023-2028 |
|---|---|---|---|
Processed Meat (Total) | 7.2 | 6.5 | 36.7 |
Shelf Stable Meat | 7.5 | 6.5 | 37.3 |
Shelf Stable Processed Red Meat | 7.5 | 6.6 | 37.3 |
Shelf Stable Processed Poultry | 6.1 | 5.9 | 33.3 |
Chilled Processed Meat | 6.3 | 6.3 | 35.6 |
Chilled Processed Red Meat | 6.3 | 6.3 | 35.6 |
Chilled Processed Poultry | 6.9 | 6.3 | 35.9 |
Frozen Processed Meat | 7.9 | 6.6 | 37.5 |
Frozen Processed Red Meat | 7.7 | 6.2 | 35.2 |
Frozen Processed Poultry | 8.4 | 7.5 | 43.7 |
Source: Euromonitor International, 2024 *CAGR: Compound Annual Growth Rate | |||
Volume sales of processed meat in the Philippines
Total volume sales (retail and foodservice) of processed meat in the Philippines was 547.4 thousand tonnes in 2023, increasing 5.8% in annual growth from 412.0 thousand tonnes recorded in 2018, as foodservice recovery continued, and retail offerings (of convenient meal options) increased, as the channel responded to the resumption of busier lifestyle and working patterns, post-pandemic. (Euromonitor International; Staple Foods in the Philippines, November 2023).
Of the processed meat volume sales, chilled meat was the largest category recording 214.2 thousand tonnes (39.1% market share) in 2023, increasing 6.9% annually from 153.2 thousand tonnes in 2018, followed by frozen meat with 197.3 thousand tonnes (36.0% market share) and shelf stable meat with retail sale volumes of 136.0 thousand tonnes (24.8% market share) in 2023 (+7.7% from volume sales of 93.8 thousand in 2018), due to its relatively low production cost. In addition, shelf stable red meat is a popular ingredient in traditional meals, such as adobo (marinated meat stew) and commonly served in carinderia (local eateries). (Euromonitor International; Processed Meat, Seafood and Alternatives to Meat in the Philippines, November 2023). Relatedly, frozen poultry recently experienced the greatest annual increase (8.1%) as volume sales grew from 65.5 thousand tonnes in 2022 to 70.8 thousand tonnes in 2023.
Category | 2018 | 2019 | 2020 | 2021 | 2022 | 2023 |
|---|---|---|---|---|---|---|
Processed Meat (Total) | 412.0 | 433.7 | 444.4 | 480.6 | 519.0 | 547.4 |
Shelf Stable Meat | 93.8 | 97.6 | 111.1 | 120.6 | 128.8 | 136.0 |
Shelf Stable Processed Red Meat | 93.3 | 97.0 | 110.5 | 120.0 | 128.1 | 135.3 |
Shelf Stable Processed Poultry | 0.5 | 0.6 | 0.6 | 0.6 | 0.7 | 0.7 |
Chilled Processed Meat | 153.2 | 163.0 | 176.4 | 191.4 | 206.2 | 214.2 |
Chilled Processed Red Meat | 150.2 | 159.9 | 173.4 | 188.2 | 202.7 | 210.5 |
Chilled Processed Poultry | 3.0 | 3.1 | 3.0 | 3.2 | 3.5 | 3.7 |
Frozen Processed Meat | 165.0 | 173.1 | 156.9 | 168.6 | 184.1 | 197.3 |
Frozen Processed Red Meat | 97.9 | 102.3 | 101.1 | 109.4 | 118.6 | 126.5 |
Frozen Processed Poultry | 67.2 | 70.8 | 55.8 | 59.2 | 65.5 | 70.8 |
Source: Euromonitor International, 2024 1: encompasses retail and foodservice channels. | ||||||
Category | Annual growth % 2022-2023 | CAGR* % 2018-2023 | Total growth % 2018-2023 |
|---|---|---|---|
Processed Meat (Total) | 5.5 | 5.8 | 32.9 |
Shelf Stable Meat | 5.6 | 7.7 | 45.0 |
Shelf Stable Processed Red Meat | 5.6 | 7.7 | 45.0 |
Shelf Stable Processed Poultry | 0.0 | 7.0 | 40.0 |
Chilled Processed Meat | 3.9 | 6.9 | 39.8 |
Chilled Processed Red Meat | 3.8 | 7.0 | 40.1 |
Chilled Processed Poultry | 5.7 | 4.3 | 23.3 |
Frozen Processed Meat | 7.2 | 3.6 | 19.6 |
Frozen Processed Red Meat | 6.7 | 5.3 | 29.2 |
Frozen Processed Poultry | 8.1 | 1.0 | 5.4 |
Source: Euromonitor International, 2024 *CAGR: Compound Annual Growth Rate | |||
In the forecast period, total volume sales of processed meat are anticipated to increase in CAGR by 3.5% to attain 650.3 thousand tonnes by 2028, reflecting the stabilization of both the foodservice and retail channels post-pandemic (Euromonitor International; Processed Meat, Seafood and Alternatives to Meat in the Philippines, November 2023).
Chilled and frozen poultry are expected to experience the largest increases in annual growth (4.5%) respectively, as volume sales of chilled poultry increase from 3.7 thousand tonnes in 2023 to 4.6 thousand tonnes by 2028, while volume sales of frozen poultry are expected to grow from 70.8 thousand tonnes to 88.3 thousand tonnes during the same period.
Category | 2024 | 2025 | 2026 | 2027 | 2028 |
|---|---|---|---|---|---|
Processed Meat (Total) | 571.2 | 593.9 | 614.5 | 633.2 | 650.3 |
Shelf Stable Meat | 141.5 | 146.6 | 151.3 | 155.7 | 159.6 |
Shelf Stable Processed Red Meat | 140.8 | 145.8 | 150.6 | 155.0 | 158.8 |
Shelf Stable Processed Poultry | 0.7 | 0.7 | 0.8 | 0.8 | 0.8 |
Chilled Processed Meat | 221.8 | 229.8 | 237.5 | 244.7 | 251.4 |
Chilled Processed Red Meat | 217.9 | 225.8 | 233.2 | 240.3 | 246.8 |
Chilled Processed Poultry | 3.9 | 4.1 | 4.2 | 4.4 | 4.6 |
Frozen Processed Meat | 208.0 | 217.5 | 225.7 | 232.8 | 239.3 |
Frozen Processed Red Meat | 132.9 | 139.0 | 143.8 | 147.6 | 151.0 |
Frozen Processed Poultry | 75.0 | 78.6 | 81.9 | 85.1 | 88.3 |
Source: Euromonitor International, 2024 | |||||
Category | Annual growth % 2023-2024 | CAGR* % 2023-2028 | Total growth % 2023-2028 |
|---|---|---|---|
Processed Meat (Total) | 4.3 | 3.5 | 18.8 |
Shelf Stable Meat | 4.0 | 3.3 | 17.4 |
Shelf Stable Processed Red Meat | 4.1 | 3.3 | 17.4 |
Shelf Stable Processed Poultry | 0.0 | 2.7 | 14.3 |
Chilled Processed Meat | 3.5 | 3.3 | 17.4 |
Chilled Processed Red Meat | 3.5 | 3.2 | 17.2 |
Chilled Processed Poultry | 5.4 | 4.5 | 24.3 |
Frozen Processed Meat | 5.4 | 3.9 | 21.3 |
Frozen Processed Red Meat | 5.1 | 3.6 | 19.4 |
Frozen Processed Poultry | 5.9 | 4.5 | 24.7 |
Source: Euromonitor International, 2024 *CAGR: Compound Annual Growth Rate | |||
Competitive landscape
The top three processed meat companies in the Philippines were San Miguel Corp, CDO Foodsphere Inc and Century Pacific Food Inc, representing a combined market share of 74.0% in 2023.
In terms of retail sales, San Miguel Corp (Brand names: Purefoods and Monterey) was the largest processed meat company with values of US$953.4 million (44.4% market share), followed by CDO Foodsphere Inc (Brand name: CDO) with retail values of US$374.7 million (17.4% market share) and Century Pacific Food Inc (Brand names: Argentina and Swift) with values of US$262.1 million (12.2% market share) in 2023.
Private label companies in comparison, continue to show a measured presence in the processed meat market with retail sales of US$70.8 million (3.3% market share) in 2023, increasing in CAGR by 9.1% from retail sales of US$45.8 million in 2018.
Category | Company | Brand | Retail sales (US$ millions) | Market share % |
|---|---|---|---|---|
Processed meat (total) | 2,149.1 | 100.0 | ||
Processed meat | San Miguel Corp | Purefoods, Monterey | 953.4 | 44.4 |
CDO Foodsphere Inc | CDO | 374.7 | 17.4 | |
Century Pacific Food Inc | Argentina, Swift | 262.1 | 12.2 | |
King Sue Ham & Sausage Co Inc | King Sue | 48.8 | 2.3 | |
Phillips Foods Inc | Phillips | 6.3 | 0.3 | |
Private Label | Private Label | 70.8 | 3.3 | |
Others | Others | 433.1 | 20.2 | |
Source: Euromonitor International, 2024 | ||||
Distribution channels
The majority of Philippine's processed meat, seafood and alternatives to meat are distributed through grocery retailers versus non-grocery retailers. Grocery retailers (offline) distribution of processed meat, seafood and alternatives to meat accounted for an 97.7% market share in 2023, while grocery retailing (online, e-commerce) has increased significantly from retail sales of US$10.9 million (0.5% market share) first reported in 2019 to US$74.9 million (2.3% market share) in 2023, as major retailers established their own online shopping platforms in order to adapt to a growing consumer demand for shopping convenience and greater product selection and price points offered via e-commerce channels (Euromonitor International; Staple Foods in the Philippines, November 2023). Further, within grocery retailers (offline), supermarkets were the predominant distribution channel for processed meat, seafood and alternatives to meat representing US$2.2 billion (67.7% market share), while small local grocers and hypermarkets occupied an 15.5% and 12.8% market share respectively, in 2023.
Outlet type | 2018 | 2023 | ||
|---|---|---|---|---|
Actual | Share % | Actual | Share % | |
Retail Channels (Total) | 1,875.8 | 100.0 | 3,257.6 | 100.0 |
Retail Offline | 1,875.8 | 100.0 | 3,182.6 | 97.7 |
Grocery Retailers | 1,875.8 | 100.0 | 3,182.6 | 97.7 |
Convenience Retailers | 49.4 | 2.6 | 56.0 | 1.7 |
Convenience Stores | 48.8 | 2.6 | 55.4 | 1.7 |
Forecourt Retailers | 0.6 | 0.0 | 0.7 | 0.0 |
Supermarkets | 1,238.0 | 66.0 | 2,204.7 | 67.7 |
Hypermarkets | 225.1 | 12.0 | 417.0 | 12.8 |
Small Local Grocers | 363.3 | 19.4 | 504.9 | 15.5 |
Retail E-Commerce | N/C | 74.9 | 2.3 | |
Source: Euromonitor International, 2024 N/C: Not calculable | ||||
New product launch analysis
According to Mintel, economic uncertainty and the recent cost-of-living crisis has prompted many consumers within the Asia Pacific (APAC) region to look for more affordable options when shopping for food and beverages. For cost-conscious consumers, poultry is an increasingly attractive protein option owing to an average price equivalent to almost half that of red meat (Mintel; A year of innovation in meat and poultry, Asia Pacific, 2024).
Poultry as an ingredient, has been steadily increasing in product launches over the past five years (2018 to 2023). Frozen and chilled poultry products remain the most popular storage format, while shelf-stable products are growing, accounting for a 12.0% market share of product launches between December 2022 and November 2023. Further, poultry brands are developing their product lines, providing more shelf-stable options, which eliminate the need for refrigeration, help to minimize food waste, and are practical options for stockpiling, particularly during sales (Mintel; A year of innovation in meat and poultry, Asia Pacific, 2024).
Social media and video platforms have become increasingly relevant in establishing and promoting brand awareness for both meat and poultry products, as well as cooking and recipe inspiration for consumers looking to infuse variety and personality into home-prepared meals. Facebook for example, was the most popular social media link on meat and poultry launches in Asia within the last 12 months, featuring on 70% of those products launched with a social media claim (Mintel; A year of innovation in meat and poultry, Asia Pacific, 2024).
According to Mintel's Global New Products Database (GNPD), there were 1,483 new meat and meat products (food) (searched as an ingredient) launched in the Philippines from January 2018 to December 2023. There have been 136 new meat and meat (food) products launched year-to-date, January to September 2024. The number of yearly new product launches has decreased in growth by a CAGR of 4.2% from a launch of 238 products in 2018, to its most recent launch of 192 products in 2023 (−37.3% from 306 products in 2022). Product growth was the highest between 2021 to 2022, when launches increased 25.4% from 244 products to 306 products.
The predominant sub-categories of new meat and meat products released were meat products (661 products), poultry products (228 products), prepared meals (217 products), hors d'oeuvres (82 products) and instant noodles (51 products). The most popular product claims were ease of use (381 products), microwaveable with (343 products) and social media claims with (214 products).
The companies with the highest number of new product launches were Purefoods-Hormel with (131 products), followed by CDO Foodsphere (112 products) and The Pacific Meat Co. with (58 products) released during the prescribed period. Under half (47.9%) of the new product launches were new variety/range extension (710 products), whereas 24.5% were new packaging products (363 products) and 19.4% were launched as new products (287 products). Top ingredients included pork (558 products), chicken meat with (350 products) and beef with (335 products), while main flavours were unflavoured/plain (539 products), cheese (66 products) and pork (57 products) between 2018 to 2023. Primary packaging types included flexible packaging (504 products), skinpack (292 products), can (209 products), tub (167 products) and trays (128 products). The Philippines was the leading Location of manufacture for new product launches with (493 products), followed by the U.S. with (25 products) and Thailand with (17 products) launched during the prescribed time.
Product attributes | Number of new products by year | Total | |||||
|---|---|---|---|---|---|---|---|
2018 | 2019 | 2020 | 2021 | 2022 | 2023 | ||
Yearly product launches | 238 | 275 | 228 | 244 | 306 | 192 | 1,483 |
Top sub-categories | |||||||
Meat products | 124 | 133 | 96 | 99 | 119 | 90 | 661 |
Poultry products | 31 | 34 | 28 | 28 | 63 | 44 | 228 |
Prepared meals | 25 | 42 | 39 | 42 | 62 | 7 | 217 |
Hors d'oeuvres | 15 | 4 | 24 | 6 | 29 | 4 | 82 |
Instant noodles | 5 | 10 | 11 | 11 | 3 | 11 | 51 |
Sandwiches/wraps | 10 | 13 | 1 | 12 | 8 | 1 | 45 |
Meat snacks | 5 | 4 | 2 | 3 | 2 | 4 | 20 |
Stocks | 3 | 1 | 1 | 4 | 4 | 6 | 19 |
Pasta sauces | 2 | 2 | 3 | 6 | 2 | 2 | 17 |
Meal kits | 2 | 7 | 0 | 3 | 1 | 3 | 16 |
Top claims | |||||||
Ease of use | 54 | 46 | 37 | 70 | 121 | 53 | 381 |
Microwaveable | 47 | 60 | 69 | 52 | 91 | 24 | 343 |
Social media | 23 | 41 | 43 | 31 | 31 | 45 | 214 |
No additives/preservatives | 21 | 40 | 33 | 22 | 51 | 31 | 198 |
Premium | 25 | 26 | 28 | 11 | 39 | 222 | 351 |
Top companies | |||||||
Purefoods-Hormel | 20 | 26 | 13 | 13 | 42 | 17 | 131 |
CDO Foodsphere | 23 | 21 | 13 | 28 | 13 | 14 | 112 |
The Pacific Meat Co. | 8 | 13 | 9 | 17 | 8 | 3 | 58 |
Virginia Food | 5 | 13 | 5 | 10 | 16 | 8 | 57 |
7-Eleven | 15 | 1 | 2 | 16 | 12 | 5 | 51 |
Top product launches | |||||||
New variety/range extension | 131 | 143 | 108 | 104 | 142 | 82 | 710 |
New packaging | 50 | 86 | 49 | 60 | 56 | 62 | 363 |
New product | 25 | 28 | 65 | 62 | 78 | 29 | 287 |
Relaunch | 28 | 17 | 6 | 18 | 27 | 18 | 114 |
New formulation | 4 | 1 | 0 | 0 | 3 | 1 | 9 |
Top 5 flavours (including blend) | |||||||
Unflavoured/plain | 92 | 100 | 85 | 78 | 97 | 87 | 539 |
Cheese | 10 | 19 | 6 | 7 | 11 | 13 | 66 |
Pork | 10 | 9 | 7 | 9 | 18 | 4 | 57 |
Chicken | 6 | 10 | 5 | 12 | 11 | 5 | 49 |
Beef | 8 | 5 | 5 | 8 | 9 | 4 | 39 |
Top ingredients | |||||||
Pork | 114 | 121 | 88 | 68 | 114 | 53 | 558 |
Chicken meat | 51 | 59 | 44 | 45 | 90 | 61 | 350 |
Beef | 54 | 59 | 47 | 74 | 57 | 44 | 335 |
Rendered bacon fat | 17 | 18 | 17 | 8 | 13 | 8 | 81 |
Poultry meats | 8 | 16 | 9 | 18 | 11 | 13 | 75 |
Top package types | |||||||
Flexible | 61 | 87 | 84 | 71 | 141 | 60 | 504 |
Skinpack | 54 | 60 | 39 | 53 | 51 | 35 | 292 |
Can | 26 | 34 | 25 | 43 | 33 | 48 | 209 |
Tub | 17 | 29 | 42 | 33 | 29 | 17 | 167 |
Tray | 28 | 33 | 21 | 14 | 25 | 7 | 128 |
Location of manufacture | |||||||
Philippines | 116 | 113 | 80 | 90 | 11 | 83 | 493 |
United States | 7 | 4 | 1 | 4 | 4 | 5 | 25 |
Thailand | 2 | 0 | 0 | 3 | 7 | 5 | 17 |
South Korea | 3 | 0 | 0 | 3 | 1 | 4 | 11 |
China | 3 | 1 | 0 | 1 | 1 | 2 | 8 |
Source: Mintel Global New Product Database (GNPD), 2024 | |||||||
Sub-category | Number of products | Average price per product (in US$) |
|---|---|---|
Meat products | 661 | 4.07 |
Poultry products | 228 | 3.37 |
Prepared meals | 217 | 5.09 |
Hors d'oeuvres/canapes | 82 | 4.48 |
Instant noodles | 51 | 1.52 |
Other | 244 | 2.45 |
Source: Mintel Global New Product Database (GNPD), 2024 | ||
Examples of new products
Chopped Ham

Source: Mintel Global New Products Database, 2024
Company | Dak Meat Packers |
|---|---|
Distributor | Gymboree Marketing Int. Inc. |
Brand | Dak |
Category | Processed fish, meat and egg products |
Sub-category | Meat products |
Market | Philippines |
Location of manufacture | Demark |
Import status | Imported product |
Store type | Supermarket |
Date published | December 2023 |
Launch type | New packaging |
Price in US dollars | 6.39 |
Dak Chopped Ham has been repackaged, and retails in a newly designed 680 gram pack containing two 340 gram units. - Recipe suggestion
Ingredients (On Pack): ham (41%), pork (14%), pork fat, water, pork rind, mechanically separated pork (8%), potato starch, salt, milk protein, stabiliser (E451), antioxidant (E301), preservative (E250)
Premium Chicken Tocino
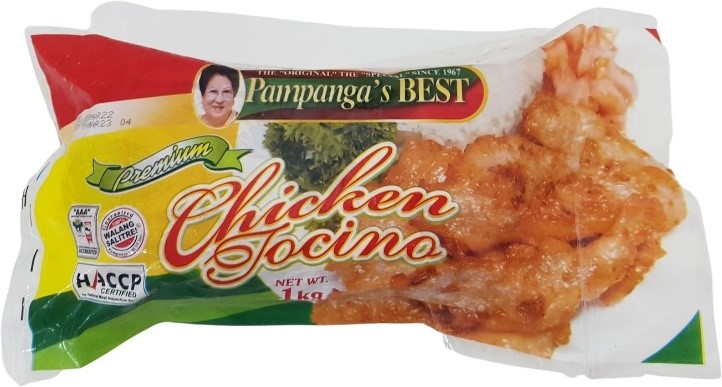
Source: Mintel Global New Products Database, 2024
Company | Pampanga's Best |
|---|---|
Brand | Pampanga's Best |
Category | Processed fish, meat and egg products |
Sub-category | Poultry products |
Market | Philippines |
Location of manufacture | Philippines |
Import status | Not imported |
Store type | Mass merchandise / hypermarket |
Date published | June 2022 |
Launch type | New packaging |
Price in US dollars | 6.33 |
Pampanga's Best Premium Chicken Tocino has been repackaged and is now available in a newly designed 1 kilogram pack featuring cooking instructions. This HACCP certified product is guaranteed to be 100% curing and salt free.
Ingredients (On Pack): chicken, water, sugar, salt, flavours, stabilizer, phosphate, antioxidant, sodium nitrite, artificial colour
Tonkotsu Ramen
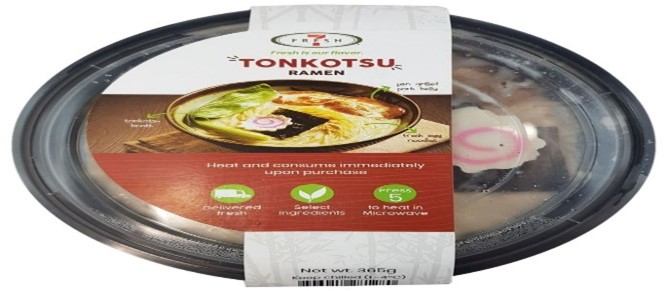
Source: Mintel Global New Products Database, 2024
Company | Philippine Seven Corporation |
|---|---|
Brand | 7-Fresh |
Category | Meals and meal centers |
Sub-category | Prepared meals |
Market | Philippines |
Store type | Convenience store |
Date published | July 2021 |
Launch type | New variety / range extension |
Price in US dollars | 2.04 |
7-Fresh Tonkotsu Ramen comprises pan-grilled pork belly and fresh egg noodles in a tonkotsu broth. The microwavable product is said to be delivered fresh, is made from select ingredients, and retails in a 365 gram pack.
Ingredients (On Pack): Tonkotsu soup: ramen paste, meat extract flavouring, water, soy sauce, pork oil, salt, flavour enhancer (contains MSG), protein hydrolysate, sugar, natural spices, thickener, natural caramel colour, vitamin E, acidulant, water, gelatin, potassium sorbate, sodium benzoate
Sharks Fin Dumplings
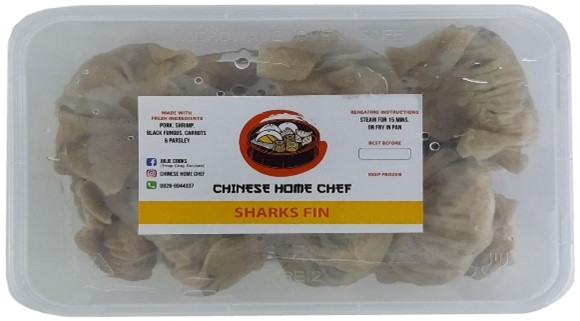
Source: Mintel Global New Products Database, 2024
Company | Chinese Home Chef (Thiap Chay Services) |
|---|---|
Brand | Chinese Home Chef |
Category | Snacks |
Sub-category | Hors d'oeuvres/ canapes |
Market | Philippines |
Store type | Traditional retail outlet |
Date published | October 2020 |
Launch type | New variety / range extension |
Price in US dollars | 4.96 |
Chinese Home Chef Sharks Fin Dumplings are said to be made with fresh ingredients and can be steamed or fried. The microwavable product retails in a pack with an unspecified weight, and bearing the Facebook, Instagram and WhatsApp logos and reheating instructions.
Ingredients (On Pack): pork, shrimp, black fungus, carrots, parsley
Curry Ramen

Source: Mintel Global New Products Database, 2024
Company | Ottogi |
|---|---|
Distributor | JSUT International |
Brand | Ottogi |
Category | Meals and meal centers |
Sub-category | Instant noodles |
Market | Philippines |
Location of manufacture | South Korea |
Import status | Imported product |
Store type | Supermarket |
Date published | September 2018 |
Launch type | New variety / range extension |
Price in US dollars | 0.89 |
Ottogi Curry Ramen is now available. The product retails in a 110 gram pack featuring the HACCP logo and a QR code. The company is an official sponsor of the Pyeong Chang 2018 Winter Olympics.
Ingredients (standard form): noodle: Flour, Palm Oil, Modified Starches (Modified), Potato Starch, Salt (Purified), emulsifier, Sodium Carboxymethyl Cellulose, Sodium Alginate, Guar Gum, Turmeric, green tea flavoured oil soup seasoning: Salt (Purified), White Sugar, Glucose, curry flavoured powder, Curry (Powdered), Beef, Onion Powder (Powdered), Vegetables (Vegetable Based), Chicken Stock (Powdered), Curry (Powdered), beef onion fried powder, vegetable chicken broth powder, Curry (Powdered), beef flavoured powder, Onion Powder (Fried, Powdered), Onion Powder (Powdered, Dry), Onion Powder (Roasted, Powdered), Modified Starches (Modified), Turmeric, taste enhancer and flavour enhancer, tasty base, Potato Powder (Powdered), Chutney (Condiment, Powdered), Beef Powder (Spicy, Powdered), mixed condiment powder, Peppers (Powdered), rich tasty powder, Ottogi tuna soy sauce powder, Xanthan Gum, acidity regulators, Chilli Extract (Spicy), Chilli Sauce (Concentrate), seasoning, Curry Flavour (Flakes), Carrot (Dry), Potato (Freeze Dried), Broccoli (Dry), Spring Onion (Green, Dry), Curry (Base) (Turmeric, Coriander)
Opportunities for Canada
Fresh and processed meat is a measurable and expansive sector within the Philippine market, driven by an increasing population and growing middle class. The demand for fresh and processed meat as a predominant staple food is anticipated to remain and evolve as Filipinos look for more convenient and affordable products to accommodate busier lifestyles and incorporate more health and wellness attributes into their diets, post pandemic.
The Philippines was the twenty-second largest global market for meat with imports valued at US$1.9 billion (1.1% market share) in 2023, representing a moderate increase in CAGR of 7.8% from US$1.3 billion, in 2018. Brazil, the U.S and Canada were key suppliers of meat products to the Philippine's, with Canada exporting US$241.2 million (3.1% market share) in 2023, representing a significant increase in annual growth of 18.6% from US$102.7 million in 2018 (+169.2% annually from exports of US$105.6 million in 2020 to US$284.3 million in 2021).
Retail sales of processed meat (seafood and alternatives to meat) in the Philippine market are supported by an established network of distribution channels including supermarkets, small local grocers, and hypermarkets. In 2023, retail sales of processed meat were valued at US$2.1 billion (+12.1% annually from retail sales of US$1.2 billion in 2018) and are forecast to increase 6.5% annually to reach US$2.9 billion by 2028. Fresh meat in comparison, is more popular and in demand by the Filipino consumer with retail value sales of US$8.4 billion in 2023, representing a significant increase of 10.6% annually from US$5.1 billion in 2018. The market is projected to grow an additional 1.7% in the forecast period to reach US$9.1 billion by 2028.
Given the expected and continued growth of the fresh and processed meat market, Canadian suppliers have the opportunity to enter, and expand their exports of products to the Philippine market. Canada's brand and reputation for high quality and safe products remain significant and appealing to the Filipino consumer. That said, it is important for Canadian exporters to work closely with their importing partners and Trade Commissioners to understand and ensure that the Philippine's import requirements for their specific products are met.
The Canadian Food Inspection Agency (CFIA) recommends that before exporting, verification for changes to regulatory or commercial requirements are required to ensure that potential exports comply with applicable Canadian requirements and those of the importing country, noting that importing country requirements may relate to public health as well as animal and plant protection. Canadian suppliers interested in exporting meat and meat products to the Philippine market are therefore encouraged to review the Philippines - Export requirements for meat and poultry products provided by the Canadian Food Inspection Agency (CFIA).
Canada and the Philippines are currently negotiating a free trade agreement in the context of the Canada-Association of Southeast Asian Nations (ASEAN) FTA negotiation (Global Affairs Canada; Canada-Philippines Relations). Since Canada is presently not a free trade agreement partner of the Philippines, Canadian products are subject to the Most Favoured Nation (MFN) tariff duties.
Canada is establishing an Indo-Pacific Agriculture and Agri-Food Office (IPAAO) in Manila, Philippines. This new office is a sign of our long-term commitment in the Indo-Pacific, along with the importance we place on building upon Canada's reputation as a stable and trusted supplier for agriculture, agri-food and seafood products. The office will enhance market access, advance technical cooperation, identify new business opportunities for Canadian exporters to diversify their exports and support investment attraction efforts into Canada (Agriculture and agri-food in the Indo-Pacific region). Canadian exporters are also encouraged to leverage the following programs and services in order to enter and expand their products within the Philippine market:
- Canada Brand
- AgriMarketing Program
- Trade Commissioner Service
- Agriculture and Food Trade Show Service
- Single Window for Agri-Food Trade Services
- Agri-food International Market Intelligence Service
- Funding Programs (Global Affairs Canada)
- Solutions for Canadian exporters (Export Development Canada)
For more information
The Canadian Trade Commissioner Service:
International Trade Commissioners can provide Canadian industry with on-the-ground expertise regarding market potential, current conditions and local business contacts, and are an excellent point of contact for export advice.
More agri-food market intelligence:
Agri-food market intelligence service
Canadian agri-food and seafood businesses can take advantage of a customized service of reports and analysis, and join our email subscription service to have the latest reports delivered directly to their inbox.
More on Canada's agriculture and agri-food sectors:
Canada's agriculture sectors
Information on the agriculture industry by sector. Data on international markets. Initiatives to support awareness of the industry in Canada. How the department engages with the industry.
Resources
- Euromonitor International, 2024
- Country Report; Economy, Finance and Trade: The Philippines, May 21, 2024
- Country Report; Income and Expenditure: The Philippines, July 4, 2024
- Country Report; Processed Meat, Seafood and Alternatives to Meat in the Philippines, November 2023
- Country Report; Philippines: Consumer Profile, July 21, 2023
- Country Report; Staple Foods in the Philippines, November 2023
- Gaz, C. & Ward, M. (2024). Livestock and Products Annual. United States Department of Agriculture (USDA), 10.
- Global Trade Tracker, 2024
- Mintel Global New Products Database, 2024
Sector Trend Analysis – Meat trends in the Philippines
Global Analysis Report
Prepared by: Laurie Bernardi, International Market Research Analyst
© His Majesty the King in Right of Canada, represented by the Minister of Agriculture and Agri-Food (2025).
Photo credits
All photographs reproduced in this publication are used by permission of the rights holders.
All images, unless otherwise noted, are copyright His Majesty the King in Right of Canada.
To join our distribution list or to suggest additional report topics or markets, please contact:
Agriculture and Agri-Food Canada, Global Analysis
1341 Baseline Rd, Tower 5, 3rd floor
Ottawa ON K1A 0C5
Canada
Email: aafc.mas-sam.aac@agr.gc.ca
The Government of Canada has prepared this report based on primary and secondary sources of information. Although every effort has been made to ensure that the information is accurate, Agriculture and Agri-Food Canada (AAFC) assumes no liability for any actions taken based on the information contained herein.
Reproduction or redistribution of this document, in whole or in part, must include acknowledgement of agriculture and agri-food Canada as the owner of the copyright in the document, through a reference citing AAFC, the title of the document and the year. Where the reproduction or redistribution includes data from this document, it must also include an acknowledgement of the specific data source(s), as noted in this document.
Agriculture and Agri-Food Canada provides this document and other report services to agriculture and food industry clients free of charge.