
Risk of Soil Salinization indicator assesses and tracks changes in the potential for salinization – the accumulation of soluble salts in portions of the landscape – attributed to changes in agricultural land use and management practices.
Salinization is a particular issue in areas like the Canadian Prairies that have moisture deficits and high annual evaporation/transpiration rates, and where ground water may naturally have higher concentrations of mineral salts. For this reason, the indicator has been developed to reflect the risk of salinization in Alberta, Saskatchewan and Manitoba.
Agriculture can exacerbate salinity; practices that leave the soil exposed during rainfall or runoff events, such as summerfallow (a practice of leaving fields bare) or intense tillage, can worsen salinization risk. Agriculture can also be affected by salinization. Certain crops will not grow in even lightly saline soils, and soils that are highly saline are not suitable for any type of crop.
Overall state and trend
In 2016, the Prairie Region as a whole demonstrated a very low risk of salinization. Between 1981 and 2016, the risk of salinization within the Prairies has declined significantly. Use the interactive map below to zoom in and explore different regions. Note that all the Prairie Provinces show a low risk or very low risk and that this risk has declined since 1981. This is attributed to the uptake of beneficial management practices such as conversion from annual crop to perennial cover, no-till or minimum-tillage, and the cessation or reduction in summerfallow.
| Very Low | Low | Moderate | High | Very High |
Use the interactive map in Figure 2 to explore the change in salinization risk between 1981 and 2016. It is apparent that the reduction in risk is occurring throughout the Prairies, but is most evident in Saskatchewan.
| Two or more class decreased risk | One class decreased risk | Little or no change | One class increased risk |
Risk of Soil Salinization performance index
The state and trend of the soil salinization indicator can also be seen in the performance index below.

Description - Figure 3
| Year | Index Value |
|---|---|
| 1981 | 85 |
| 1986 | 86 |
| 1991 | 87 |
| 1996 | 88 |
| 2001 | 90 |
| 2006 | 91 |
| 2011 | 93 |
| 2016 | 94 |
As illustrated by the performance index above, in 2016 the state of the environment from the standpoint of the risk of salinization on farmland in the Canadian Prairies was "Desired". The index illustrates an upward trend, from an index value of 85 in 1981, to an even higher value of 94 in 2016, representing a declining risk of soil salinization across the Prairies.
The index tends to aggregate and generalize trends and so should be viewed as a policy tool to give a general overview of state and trend over time.
Specific trends
Saskatchewan demonstrates a dramatically lower risk of salinization
Although changes were observed in all Prairie Provinces, the greatest changes occurred in Saskatchewan where the area of summerfallow decreased by more than 6 million hectares and the area of permanent cover increased by more than 2 million hectares. Changes in land use and management practices over from 1981 to 2016 have lessened the risk of salinization and indicate a trend towards improved soil health and agri-environmental sustainability.
Click and drag the vertical bar on the map below to see the difference in risk of salinization in Saskatchewan between 1981 and 2016.
| Very Low | Low | Moderate | High | Very High |
Reasons for this trend
The Prairie-wide improvement in salinization risk has been largely attributed to the steady reduction in the area of summerfallow, which decreased by over 8 million hectares (a 91% reduction) from 1981 to 2016 (see figure 5 below), and to an increase in area of permanent cover of 2.3 million hectares (a 6% increase) over the same period. This reduction is particularly dramatic in Saskatchewan, which has experienced the largest decline in summerfallow area, from nearly 6.7 million hectares in 1981, down to just 0.6 million hectares in 2016.
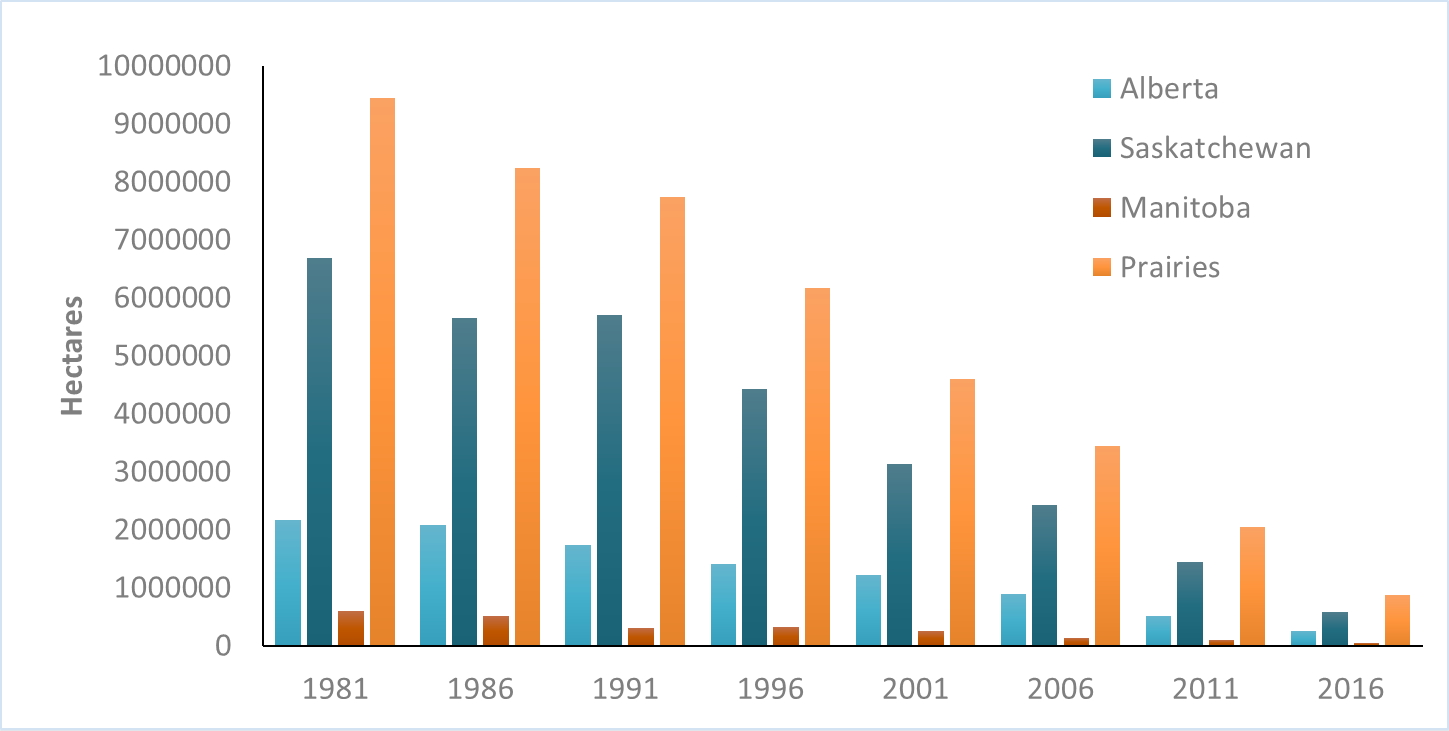
Description - Figure 5
| Province | 1981 | 1986 | 1991 | 1996 | 2001 | 2006 | 2011 | 2016 |
|---|---|---|---|---|---|---|---|---|
| Alberta | 2163572 | 2078521 | 1738004 | 1411749 | 1215939 | 889261 | 503524 | 254928 |
| Saskatchewan | 6687421 | 5639929 | 5697718 | 4427072 | 3127238 | 2425117 | 1443726 | 577207 |
| Manitoba | 597466 | 507317 | 296569 | 322436 | 254780 | 126466 | 95739 | 40606 |
| Prairies | 9448459 | 8225767 | 7732291 | 6161257 | 4597957 | 3440844 | 2042989 | 872741 |
The decline in summerfallow throughout the Prairie Region is a result of a number of factors that include:
- the adoption of practices (increased use of chemical fertilizers, extending crop rotations, continuous cropping) that maximize plant production and make more efficient use of available moisture;
- availability and use of chemical herbicides as an alternative to cultivation for controlling weeds;
- the conversion of marginal land to permanent cover or pasture; and
- a greater awareness of producers to the potential long-term degradation effects of summerfallow and tillage practices.
Why this indicator matters
Salinization not only reduces the yield of agricultural crops but also limits the range of crops that can be grown, thereby reducing the potential economic returns to farmers. For example, beets and edible beans are considered to be very sensitive to salts, and barley is able to tolerate weak salinity better than wheat. In 1998, losses to the income of Canadian farmers as a result of soil salinity were estimated at $257 million annually (Forge 1998).
While salinization risk has lowered across the Prairies over the last few years, it is still a localized issue of concern for some producers. Agriculture has the potential to mitigate by implementing beneficial management practices.
Beneficial management practices
As it is linked so closely to soil-water conditions salinization can be mitigated or avoided through appropriate soil-water management. Beneficial management practices to reduce excess water, therefore controlling excess salt movement, include:
- Reducing summerfallow and intense tillage, and shifting to no-till or reduced tillage
- Increased planting of perennial forages, pastures and tree crops,
- Managing snow to provide a more uniform distribution of melt water (preventing large drifts); and
- Using fertilizers and manure effectively to support healthy crops.
About the performance indices
The agri-environmental performance index shows environmental performance state and trends over time, based on weighting the percentage of agricultural land in each indicator class, such that the index ranges from 0 (all land in the most undesirable category) to 100 (all land in the most desirable category). An index value that is increasing over time suggests improving environmental performance, while a decreasing index value suggests deteriorating environmental performance over time.
Related indicators
- The Soil Erosion Indicator tracks the health of Canadian agricultural soils as it relates to the risk of erosion from tillage, water and wind.
- The Soil Organic Matter Indicator tracks the health of Canadian agricultural soils as it relates to soil carbon content.
Additional resources and downloads
- For detailed information on this indicator please see the publication entitled Environmental Sustainability of Canadian Agriculture, Agri-Environmental Indicator Report Series - Report #4.
- Discover and download geospatial data related to this and other indicators.