
Statistics about organic milk production and producers in Canada.
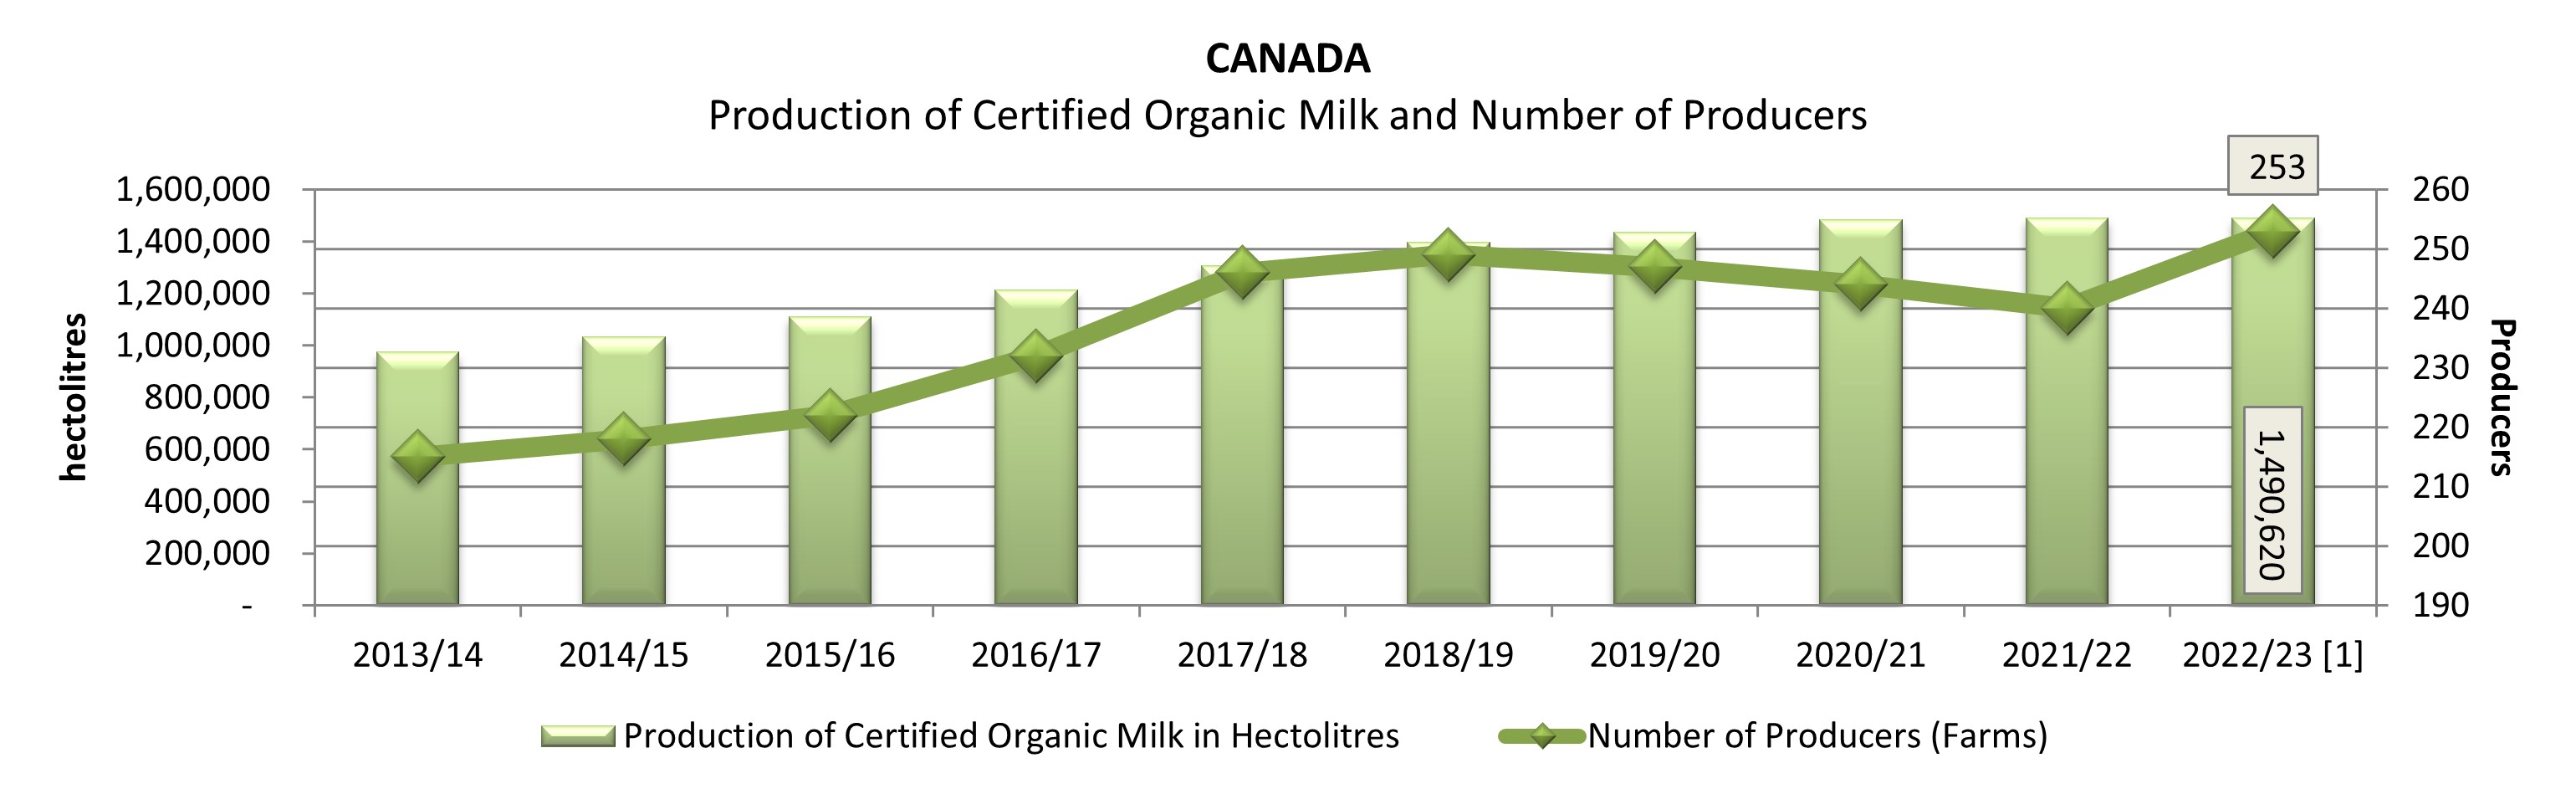
The table below represents the data to produce the graph above
| 2013/14 | 2014/15 | 2015/16 | 2016/17 | 2017/18 | 2018/19 | 2019/20 | 2020/21 | 2021/22 | 2022/23 | |
|---|---|---|---|---|---|---|---|---|---|---|
| Production of certified organic milk in hectolitres | 974,302 | 1,033,416 | 1,110,664 | 1,213,649 | 1,306,888 | 1,397,966 | 1,436,387 | 1,484,709 | 1,490,378 | 1,490,620 |
| Number of producers (farms) | 215 | 218 | 222 | 232 | 246 | 249 | 247 | 244 | 240 | 253 |
Dairy year milk volume by province
| Year | British Columbia |
Alberta / Manitoba |
Ontario | Quebec / Nova Scotia [1] |
Canada |
|---|---|---|---|---|---|
| 2022/23 | 302,600 | 96,888 | 392,461 | 698,671 | 1,490,620 |
| 2021/22 | 368,772 | 91,796 | 389,490 | 640,320 | 1,490,378 |
| 2020/21 | 385,968 | 80,994 | 385,269 | 632,478 | 1,484,709 |
| 2019/20 | 370,030 | 83,386 | 370,391 | 612,581 | 1,436,387 |
| 2018/19 | 347,570 | 84,315 | 365,290 | 600,791 | 1,397,966 |
| 2017/18 | 326,646 | 85,250 | 340,849 | 554,143 | 1,306,888 |
| 2016/17 | 320,077 | 87,501 | 328,846 | 477,225 | 1,213,649 |
| 2015/16 | 286,459 | 89,376 | 297,586 | 437,242 | 1,110,664 |
| 2014/15 | 271,147 | 76,926 | 267,396 | 417,947 | 1,033,416 |
| 2013/14 | 245,888 | 74,567 | 260,534 | 393,313 | 974,302 |
| Year | British Columbia |
Alberta / Manitoba |
Ontario | Quebec / Nova Scotia [1] |
Canada | |||
|---|---|---|---|---|---|---|---|---|
| 2022/23 | 23 | 7 | 82 | 141 | 253 | |||
| 2021/22 | 27 | 6 | 82 | 125 | 240 | |||
| 2020/21 | 28 | 6 | 81 | 129 | 244 | |||
| 2019/20 | 26 | 7 | 82 | 132 | 247 | |||
| 2018/19 | 28 | 7 | 81 | 133 | 249 | |||
| 2017/18 | 30 | 7 | 82 | 127 | 246 | |||
| 2016/17 | 31 | 9 | 79 | 113 | 232 | |||
| 2015/16 | 27 | 9 | 74 | 112 | 222 | |||
| 2014/15 | 26 | 8 | 74 | 110 | 218 | |||
| 2013/14 | 20 | 10 | 75 | 110 | 215 | |||
|
Note: Amounts for other provinces - nil or minute [1] The Province of Quebec: due to a methodology change January 1,2023, numbers aren't comparable with subsequent years. Source: B.C. Milk Marketing Board, Dairy Farmers of Manitoba, Dairy Farmers of Ontario, Fédération des producteurs de lait du Québec, Alberta Milk and Dairy Farmers of Nova Scotia |
||||||||
For your convenience, this report is available in the following formats:
PDF (464 KB), Excel (29 KB)
Monthly Milk volume by province
British Columbia
British Columbia
| Month | 2019/2020 hl |
2019/2020 Prod. |
2020/2021 hl |
2020/2021 Prod. |
2021/2022 hl |
2021/2022 Prod. |
2022/2023 hl |
2022/2023 Prod. |
|---|---|---|---|---|---|---|---|---|
| August | 29,994 | 28 | 32,259 | 29 | 33,594 | 28 | 25,590 | 27 |
| September | 28,722 | 27 | 31,657 | 29 | 30,886 | 28 | 25,213 | 26 |
| October | 29,331 | 25 | 32,089 | 28 | 30,648 | 28 | 25,777 | 26 |
| November | 28,994 | 25 | 30,795 | 28 | 29,865 | 27 | 24,736 | 26 |
| December | 30,842 | 25 | 31,738 | 28 | 30,426 | 27 | 25,458 | 25 |
| January | 31,168 | 25 | 32,740 | 28 | 29,660 | 27 | 26,864 | 25 |
| February | 28,794 | 25 | 29,515 | 28 | 27,831 | 27 | 23,766 | 25 |
| March | 31,819 | 26 | 33,629 | 28 | 31,446 | 27 | 26,383 | 25 |
| April | 31,320 | 26 | 33,601 | 28 | 30,383 | 27 | 24,913 | 25 |
| May | 32,990 | 26 | 35,202 | 28 | 31,985 | 27 | 25,253 | 23 |
| June | 32,678 | 26 | 32,625 | 28 | 30,832 | 27 | 24,601 | 23 |
| July | 33,379 | 26 | 30,118 | 28 | 31,216 | 27 | 24,046 | 23 |
| Total | 370,030 | 26 | 385,968 | 28 | 368,772 | 27 | 302,600 | 23 |
| Source: BC Milk Marketing Board Compiled by Agriculture and Agri-Food Canada, Animal Industry Division, Market Information Section |
||||||||
For your convenience, this report is available in the following formats:
PDF (504 KB), Excel (67 KB)
Alberta/Manitoba
Alberta/Manitoba
| Month | 2019/2020 hl |
2019/2020 Prod. |
2020/2021 hl |
2020/2021 Prod. |
2021/2022 hl |
2021/2022 Prod. |
2022/2023 hl |
2022/2023 Prod. |
|---|---|---|---|---|---|---|---|---|
| August | 6,954 | 7 | 7,137 | 7 | 7,127 | 6 | 7,866 | 7 |
| September | 6,515 | 7 | 6,650 | 7 | 7,074 | 6 | 7,725 | 7 |
| October | 6,578 | 7 | 6,304 | 7 | 7,265 | 6 | 7,953 | 7 |
| November | 6,621 | 7 | 6,058 | 6 | 7,220 | 6 | 7,719 | 7 |
| December | 6,933 | 7 | 6,544 | 6 | 8,010 | 6 | 8,251 | 7 |
| January | 7,188 | 7 | 6,912 | 6 | 7,832 | 6 | 8,731 | 7 |
| February | 6,667 | 7 | 6,289 | 6 | 7,277 | 6 | 7,724 | 7 |
| March | 7,300 | 7 | 6,945 | 6 | 8,119 | 6 | 8,127 | 7 |
| April | 6,984 | 7 | 6,749 | 6 | 7,987 | 6 | 8,136 | 7 |
| May | 7,191 | 7 | 7,351 | 6 | 7,930 | 6 | 8,222 | 7 |
| June | 7,312 | 7 | 6,848 | 6 | 7,936 | 6 | 7,977 | 7 |
| July | 7,142 | 7 | 7,208 | 6 | 8,019 | 6 | 8,455 | 7 |
| Total | 83,386 | 7 | 80,994 | 6 | 91,796 | 6 | 96,888 | 7 |
| Source: Alberta Milk & Dairy Farmers of Manitoba Compiled by Agriculture and Agri-Food Canada, Animal Industry Division, Market Information Section |
||||||||
For your convenience, this report is available in the following formats:
PDF (489 KB), Excel (57 KB)
Ontario
Ontario
| Month | 2019/2020 hl |
2019/2020 Prod. |
2020/2021 hl |
2020/2021 Prod. |
2021/2022 hl |
2021/2022 Prod. |
2022/2023 hl |
2022/2023 Prod. |
|---|---|---|---|---|---|---|---|---|
| August | 30,367 | 81 | 32,094 | 81 | 32,159 | 81 | 32,624 | 81 |
| September | 29,148 | 81 | 30,538 | 81 | 31,328 | 83 | 31,624 | 82 |
| October | 29,972 | 80 | 30,897 | 80 | 32,997 | 83 | 32,496 | 81 |
| November | 28,735 | 81 | 30,909 | 80 | 31,953 | 83 | 32,152 | 82 |
| December | 30,681 | 82 | 32,751 | 80 | 33,096 | 83 | 33,518 | 82 |
| January | 32,206 | 83 | 32,746 | 81 | 32,794 | 82 | 33,520 | 82 |
| February | 30,692 | 83 | 30,288 | 81 | 29,947 | 82 | 30,077 | 82 |
| March | 32,404 | 82 | 33,668 | 81 | 33,333 | 82 | 33,585 | 82 |
| April | 30,637 | 82 | 32,731 | 81 | 32,970 | 82 | 32,528 | 82 |
| May | 32,216 | 82 | 33,996 | 82 | 34,767 | 82 | 34,236 | 82 |
| June | 31,521 | 82 | 31,721 | 82 | 31,998 | 82 | 32,903 | 82 |
| July | 31,813 | 82 | 32,930 | 82 | 32,148 | 82 | 33,197 | 82 |
| Total | 370,391 | 82 | 385,269 | 81 | 389,490 | 82 | 392,461 | 82 |
| Source: Ontario Ministry of Agriculture, Food and Rural Affairs (OMAFRA) Compiled by Agriculture and Agri-Food Canada, Animal Industry Division, Market Information Section |
||||||||
For your convenience, this report is available in the following formats:
PDF (487 KB), Excel (56 KB)
Quebec / Nova Scotia
Quebec / Nova Scotia
| Month | 2019/2020 hl |
2019/2020 Prod. |
2020/2021 hl |
2020/2021 Prod. |
2021/2022 hl |
2021/2022 Prod. |
2022/2023 hl [1] |
2022/2023 Prod. [1] |
|---|---|---|---|---|---|---|---|---|
| August | 50,845 | 134 | 51,922 | 132 | 52,813 | 130 | 54,544 | 138 |
| September | 49,940 | 135 | 50,718 | 132 | 50,892 | 130 | 52,406 | 137 |
| October | 51,580 | 134 | 52,435 | 131 | 52,699 | 129 | 55,137 | 138 |
| November | 50,626 | 135 | 51,870 | 130 | 52,109 | 129 | 54,782 | 138 |
| December | 52,695 | 134 | 54,604 | 129 | 55,550 | 129 | 57,955 | 138 |
| January | 52,831 | 133 | 56,160 | 129 | 55,536 | 126 | 61,940 | 143 |
| February | 49,342 | 133 | 49,905 | 129 | 50,036 | 125 | 56,059 | 143 |
| March | 52,921 | 133 | 54,217 | 129 | 55,511 | 125 | 61,956 | 143 |
| April | 48,766 | 133 | 52,175 | 129 | 54,030 | 125 | 60,047 | 141 |
| May | 50,740 | 133 | 54,198 | 129 | 55,991 | 125 | 63,443 | 141 |
| June | 50,440 | 133 | 51,641 | 129 | 52,829 | 125 | 60,881 | 141 |
| July | 51,855 | 132 | 52,634 | 129 | 52,324 | 125 | 59,521 | 141 |
| Total | 612,581 | 132 | 632,478 | 129 | 640,320 | 125 | 698,671 | 141 |
|
[1] The Province of Quebec: due to a methodology change January 1, 2023, numbers aren't comparable with subsequent years. Source: Fédération des producteurs de lait du Québec |
||||||||
For your convenience, this report is available in the following formats:
PDF (500 KB), Excel (57 KB)
If you have any questions or require additional information, please send an e-mail to aafc.cdic-ccil.aac@canada.ca