
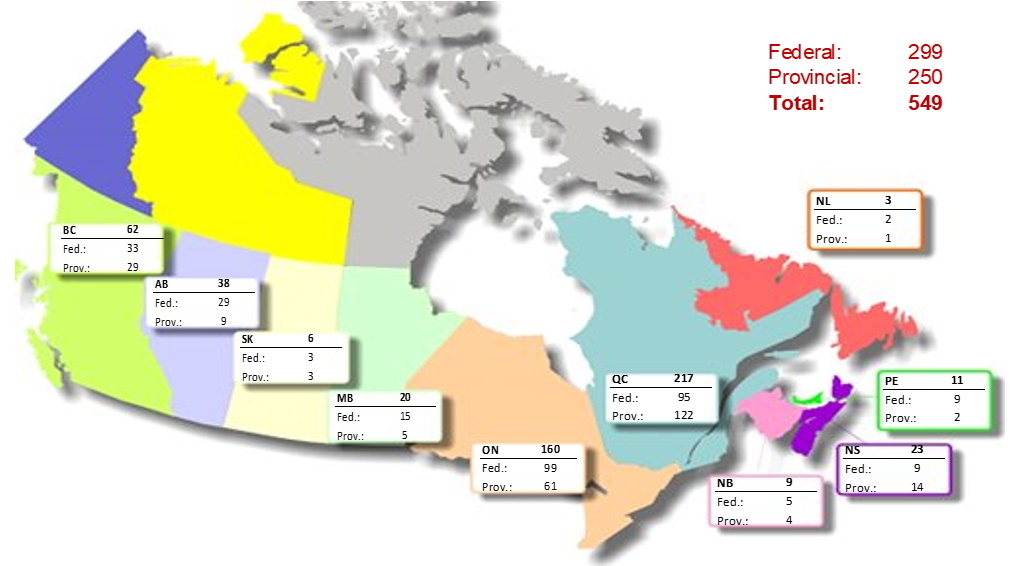
Overview of the dairy processors in Canada - 2024
| Year | BC | AB | SK | MB [2] | ON | QC | NB [2] | NS | PE [2] | NL | Total |
|---|---|---|---|---|---|---|---|---|---|---|---|
| 2024 | 33 | 29 | 3 | 15 | 99 | 95 | 5 | 9 | 9 | 2 | 299 |
| 2023 | 34 | 21 | 2 | 11 | 93 | 89 | 3 | 9 | 9 | 2 | 273 |
| 2022 | 34 | 21 | 1 | 11 | 98 | 87 | 2 | 10 | 8 | 3 | 275 |
| 2021 | 33 | 23 | 1 | 12 | 103 | 84 | 2 | 10 | 8 | 3 | 279 |
| 2020 [3] | 34 | 23 | 2 | 13 | 102 | 95 | 5 | 8 | 6 | 2 | 290 |
| 2019 [3] | 33 | 23 | 2 | 14 | 100 | 87 | 4 | 7 | 6 | 1 | 277 |
| 2018 [3] | 35 | 24 | 4 | 13 | 104 | 92 | 5 | 7 | 7 | 2 | 293 |
| 2017 [3] | 33 | 23 | 2 | 13 | 101 | 89 | 4 | 7 | 6 | 1 | 279 |
| 2016 [3] | 32 | 23 | 2 | 11 | 96 | 87 | 4 | 7 | 6 | 2 | 270 |
| 2015 [3] | 33 | 22 | 1 | 11 | 96 | 87 | 5 | 8 | 6 | 2 | 271 |
| Year | BC | AB [1] | SK | MB [2] | ON | QC | NB [2] |
NS [4] |
PE [2] | NL | Total |
|---|---|---|---|---|---|---|---|---|---|---|---|
| 2024 | 29 | 9 | 3 | 5 | 61 | 122 | 4 | 14 | 2 | 1 | 250 |
| 2023 [4] | 28 | 8 | 3 | 4 | 57 | 130 | 3 | 9ᶧ | 1 | 2 | 245 |
| 2022 | 23 | 7 | 3 | 3 | 50 | 129 | 4 | 9 | 2 | 2 | 232 |
| 2021 | 20 | 10 | 3 | 4 | 42 | 112 | 3 | 4 | 2 | 2 | 202 |
| 2020 [3] | 25 | 11 | 3 | 4 | 60 | 106 | 3 | 7 | 4 | 1 | 224 |
| 2019 [3] | 25 | 11 | 2 | 4 | 50 | 104 | 3 | 6 | 4 | 1 | 210 |
| 2018 [3] | 30 | 11 | 2 | 4 | 60 | 109 | 3 | 6 | 4 | 1 | 230 |
| 2017 [3] | 21 | 8 | 1 | 4 | 50 | 101 | 3 | 3 | 6 | 2 | 199 |
| 2016 [3] | 28 | 8 | 1 | 2 | 43 | 106 | 4 | 3 | 5 | 1 | 201 |
| 2015 [3] | 28 | 7 | - | 2 | 44 | 106 | 4 | 6 | 3 | 1 | 202 |
|
- Nil [4] Nova Scotia 2023 data based off of 2022 data For your convenience, this report is available in the following formats: |
|||||||||||
Links to reports provided by Statistics Canada:
- Employment in the dairy processing sector (Annual, Statistics Canada Table:14-10-0202-01)
- Number of employees by North American Industry Classification System (NAICS) and type of employee, last 5 years.
If you have any questions or require additional information, please send an e-mail to aafc.cdic-ccil.aac@agr.gc.ca