
The Soil Organic Matter Indicator combines two separate indicator models - the Soil Organic Carbon Change Indicator and the Relative Soil Organic Carbon Indicator – to assess how organic carbon levels in Canadian agricultural soils are changing over time. The indicator gives a useful picture of soil health and an estimate of how much carbon dioxide has been removed from the atmosphere by plants and stored, or sequestered, as soil organic carbon in agricultural soils. This indicator has tracked soil organic matter associated with Canadian agricultural activities from 1981 to 2016.
Overall state and trend
Soil organic matter has been increasing on agricultural lands in Canada. In 2016 Canadian agricultural soils removed 11.2 million tonnes of carbon dioxide from the atmosphere.
Soil Organic Carbon Change Indicator
The Soil Organic Carbon Change Indicator looks at the rate of change in carbon levels in agricultural soils. Using this indicator we can see where soil organic carbon is increasing or declining, and at what rate it is doing so.
Use the interactive map below to zoom in and explore different regions. Note that in the Prairies, soil organic carbon is increasing primarily due to a reduction in tillage intensity and area under summerfallow – a practice of leaving fields bare. This increasing trend holds promise for correcting past practices that caused soil degradation and left many Prairie soils with very low organic carbon levels. Conversely, in regions of Canada east of Manitoba, where soil carbon levels were historically much higher, these levels are now generally decreasing largely due to the steady conversion of tame pastures and hayland to annual crops.
This decline in soil carbon can be explained by shifts in cropping practices and crop types. Since 2006, the sharp decline in beef cattle production, as well as a longer-term decline in dairy herds since 1981 has reduced the area under pasture and forage production. Much of the area previously dedicated to these land uses have been converted to annual crops, such as corn, which do not increase soil organic matter as much as perennial crops. These declines in eastern Canada are more than offset by improvements in the Prairie Region and overall, the national trend is very favorable.
| Large decrease | Moderate decrease | No change | Moderate increase | Large increase |
If soil is well managed over a long period of time, the organic carbon content will stabilize and remain constant over time. An increase in soil carbon is not necessarily better than a stable situation. However, if soil degradation has occurred in the past, a significant increase in soil organic carbon is clearly desirable, as it indicates improvements in soil health and function. A loss of soil organic carbon represents a net release of carbon dioxide into the atmosphere and so is not desirable.
Soil Organic Carbon Change Index
The state and trend of the soil organic carbon change indicator can also be seen in the performance index below
Figure 2: Soil Organic Carbon Change Index

Description - Figure 2
| Year | Index Value |
|---|---|
| 1981 | 48 |
| 1986 | 49 |
| 1991 | 53 |
| 1996 | 62 |
| 2001 | 74 |
| 2006 | 78 |
| 2011 | 77 |
| 2016 | 72 |
In 2016, the state of the environment, as it relates to soil organic carbon change resulting from farming activities in Canada, was in the "Good" category. The index illustrates a strong upward trend through to 2006, from an index value of 48 in 1981, to a higher value of 78 in 2006. This national scale improvement came about primarily as a result of widespread adoption of reduced (conservation) tillage and no-till, a decrease in the use of summerfallow and an increase in the use of perennial forage crops in the Prairies. Since 2006, the index has trended downward slightly to a value of 72 in 2016. While soil carbon continues to increase in the prairies, gains in soil carbon have been partially offset by losses due to conversions of pasture and hay-lands to annual crops in the latter part of the time series.
The index tends to aggregate and generalize trends and so should be viewed as a policy tool to give a general overview of state and trend over time.
Relative Soil Organic Carbon Indicator
In addition to knowing how quickly carbon is accumulating in the soil, it is useful to have a means of assessing soil health and function, which varies across different climates and soil types, and for different farming practices. For this reason, a complementary indicator, the Relative Soil Organic Carbon Indicator, compares carbon levels against the optimum soil carbon scenario of an extensively grazed grass pasture. When combined with the Soil Organic Carbon Change Indicator, it can help to identify those areas most at risk from soil degradation.
Use the map in Figure 3 to explore the current degradation risk in soil organic carbon. Areas like much of the Prairies that still have relatively low but increasing soil carbon levels are considered to be at a low risk of degradation. Areas that have soils with high organic carbon, like the majority of eastern Canada, but which are losing soil organic matter through changes in farming practices are considered to be at moderate risk and may not be sustainable in the long-term. Those regions with lower soil carbon levels that are also declining, as can be seen in parts of eastern and western Canada, are at the greatest risk of degradation.
| Very low | Low | Moderate | High |
Specific trends
- Trend 1 – Soil conservation in the Prairies increases soil organic carbon
- Trend 2 – Land-use changes in parts of Eastern Canada lead to lower soil organic carbon
This section highlights a few other trends of interest. In some cases, these are occurring in certain regions and in others they are affecting certain sectors, such as the beef or dairy industries.
Trend 1 – Soil conservation in the Prairies increases soil organic carbon
The Prairie Region has seen significant improvements in soil organic carbon over the past 30 years. The map below shows the cumulative changes in organic carbon, directly resulting from the reduction in tillage intensity and summerfallow. You can explore these improvements in the Prairies and also zoom out to see that these same improvements were not experienced in Eastern Canada over the same time period.
| -600 to 600 kg/ha | 600 to 1200 kg/ha | > 1200 kg/ha |
Reasons for trend 1
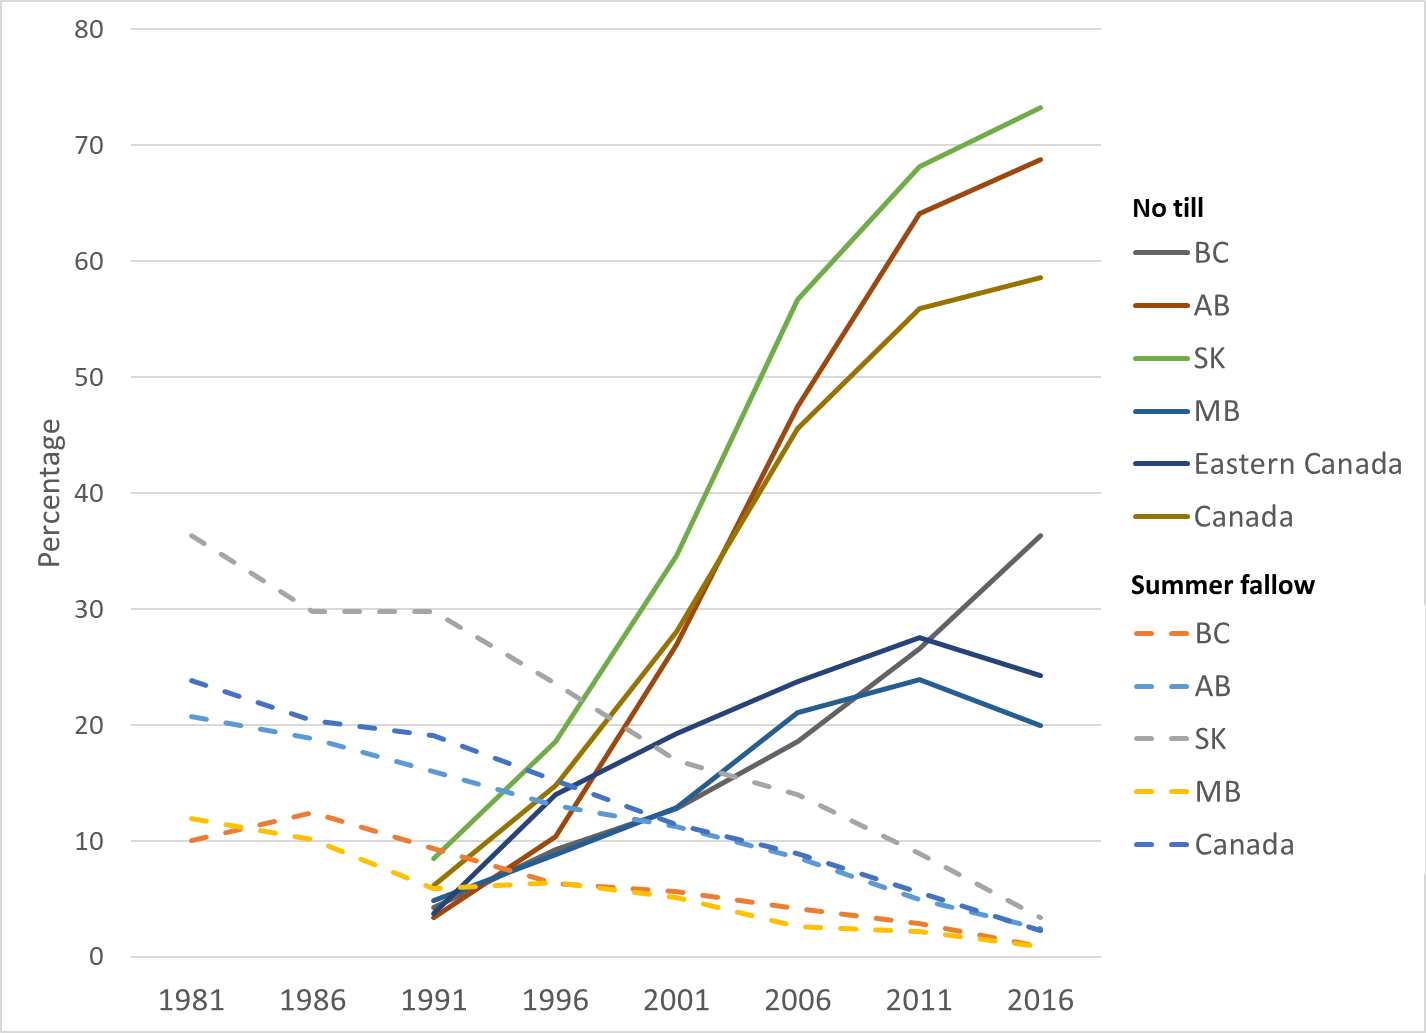
The primary reason for the improvement in this indicator in Canada is due to the shift away from summerfallow and intensive tillage in the Prairie region. Both these practices remove or prevent the build-up of soil organic matter – and therefore carbon. Figure 5 shows the percentage of cropland under summerfallow and no-till for the Prairies (Alberta, Saskatchewan and Manitoba), British Columbia, Eastern Canada (tillage only) and Canada as whole between 1981 and 2016. Because the Prairie region accounts for over 85% of farmland in Canada, changes in these provinces significantly impact the national averages. In Eastern Canada, summerfallow is not a common management practice and although no-till has not been implemented to the same extent, there has been modest increases in some regions. Since 2011, the rate of adoption of no-till has begun to level off in many regions. In Manitoba and Ontario, there has been a decline in the proportion of cropland under no-till. This has been accompanied by an increase in reduced till and to a lesser extent conventional till. Soil management issues, owing to wetter climatic conditions in these regions, may be one reason for this trend.
Figure 5: Trends in summerfallow and no-till, 1981 to 2016. Note that Census data for tillage practices are available from 1991 onwards only.
Description - Figure 5
| 1981 | 1986 | 1991 | 1996 | 2001 | 2006 | 2011 | 2016 | |
|---|---|---|---|---|---|---|---|---|
| Manitoba | 12 | 10 | 6 | 6 | 5 | 3 | 2 | 1 |
| Saskatchewan | 36 | 30 | 30 | 24 | 17 | 14 | 9 | 3 |
| Alberta | 21 | 19 | 16 | 13 | 11 | 9 | 5 | 2 |
| British Columbia | 10 | 12 | 9 | 6 | 6 | 4 | 3 | 1 |
| Canada | 24 | 20 | 19 | 15 | 11 | 9 | 6 | 2 |
| 1981 | 1986 | 1991 | 1996 | 2001 | 2006 | 2011 | 2016 | |
|---|---|---|---|---|---|---|---|---|
| Manitoba | 5 | 9 | 13 | 21 | 24 | 20 | ||
| Saskatchewan | 8 | 19 | 35 | 57 | 68 | 73 | ||
| Alberta | 3 | 10 | 27 | 47 | 64 | 69 | ||
| British Columbia | 4 | 9 | 13 | 19 | 27 | 36 | ||
| Eastern Canada | 4 | 14 | 19 | 24 | 28 | 24 | ||
| Canada | 6 | 15 | 28 | 46 | 56 | 59 |
Trend 2 – Land-use changes in parts of Eastern Canada lead to lower soil organic carbon
While the national trend for soil organic carbon is positive, this has been slightly offset by localized decreases in soil carbon in parts of eastern Ontario and southern Quebec, and in parts of the Maritimes. The map below shows the cumulative changes in organic carbon, directly resulting from land management and land-use changes, most notably shifting between annual and perennial crops. You can explore trends in Eastern Canada and also zoom out to see that these land-use changes had a mixed effect in the Prairie Region.
| < -1200 kg/ha | 1200 to -600 kg/ha | -600 to 600 kg/ha | 600 to 1200 kg/ha | > 1200 kg/ha |
Reasons for trend 2
Between 1981 and 2016, eastern Canada has experienced a gradual shift away from perennial crops such as pasture and forage, towards annual crops such as cereals and oilseeds. Cultivation of perennial crops increases aeration of the soil and enhances decomposition of organic matter. This has resulted in a loss of soil carbon in these regions overtime. The main reason for these changes in land use is due to the decline in Canada's cattle herd. Canada's beef cattle population peaked in 2006 and then experienced a decline primarily attributed to the bovine spongiform encephalopathy (BSE) crisis in 2003–2004. In the case of the dairy industry, increased efficiencies have led to fewer head of dairy cows (a decline from 1.8 million down to around 1 million head), without a decline in milk production.
Why this indicator matters
Soil organic matter has implications for a number of environmental processes and conditions relating to overall soil health, including soil structure, fertility, drainage and susceptibility to erosion. A healthy soil is needed to maintain the long term sustainability and productivity of our soils. The carbon in our soils has important implications for climate change, as sequestering carbon in soils removes carbon dioxide from the atmosphere. Sequestered soil carbon is calculated as part of Canada's national greenhouse gas inventory, and reported as part of our commitment to the United Nations Framework Convention on Climate Change.
Agriculture has the potential to mitigate climate change by implementing beneficial management practices that increase the storage of carbon in soils and by limiting practices that contribute to the loss of soil organic carbon to the atmosphere.
Beneficial management practices
The same practices that reduce soil erosion and increase soil cover will increase soil organic carbon levels. In the Prairies especially, producers can increase soil organic carbon by reducing summerfallow and tillage intensity and by converting annual crops to perennial cropping systems.
In cases where low-residue horticultural or root crops are grown on farmland with relatively low soil organic carbon levels, it is important to include crops that produce abundant residues in the rotation. Examples of these higher residue cover crops include clover, alfalfa, ryegrass, oats and winter wheat. Manure spreading can also increase soil organic carbon, and quickly improve soil health and productivity. Other suitable methods may include intercropping lower residue crops with suitable companion plants.
The clearing of trees and shrubs to add land for farming continues to a limited extent and causes losses of carbon in all provinces. Similarly, conversion of native grassland or long-term perennial hay-land to cropland causes soil organic carbon loss. The long-term merits of breaking this often-marginal land for crops needs to be considered carefully. Actively planting trees in riparian areas, establishing shelterbelts and using cover crops are all measures that farmers can implement to increase carbon sequestration and provide other co-benefits such as reduced soil erosion, habitat for pollinators and improved resilience to flooding.
About the performance indices
The agri-environmental performance index shows environmental performance state and trends over time, based on weighting the percentage of agricultural land in each indicator class, such that the index ranges from 0 (all land in the most undesirable category) to 100 (all land in the most desirable category). An index value that is increasing over time suggests improving environmental performance, while a decreasing index value suggests deteriorating environmental performance over time.
Related indicators
- The Soil Erosion Indicator tracks the health of Canadian agricultural soils as it relates to the risk of erosion from tillage, water and wind.
- The Soil Salinization Indicator examines salinization risk to Prairie soils.
- The Agricultural Greenhouse Gas Indicator uses the soil carbon change indicator to calculate the role of soil carbon exchange in determining net greenhouse gas emissions from Canadian farmland.
Additional resources and downloads
- For detailed information on this indicator please see the publication entitled Environmental Sustainability of Canadian Agriculture, Agri-Environmental Indicator Report Series - Report #4.
- Discover and download geospatial data related to this and other indicators.