
Table of contents
- Summary
- Particulate matter emissions in Canada: why do they matter?
- What causes particulate matter emissions?
- Agricultural Particulate Matter Emissions – the indicator
- Particulate matter emissions in Canada – current state and the change over time
- How can particulate matter emissions be reduced?
- Learn More
Summary
- Particulate matter is a type of air pollution caused by solid particles and liquid droplets suspended in the air. These can have harmful impacts on human health and the environment.
- The Agricultural Particulate Matter Emissions Indicator measures the amount of particulate matter added to the atmosphere from agricultural activity. It also measures whether this is changing over time.
- Particulate matter emissions from Canada’s agricultural lands have shown important long-term and short-term declines.
- However, emissions from animal populations and fertilizer application have increased and some areas of the country show very high risk.
- Particulate matter emissions can be further decreased by modifying practices of land preparation, erosion control, crop harvesting, fertilizer and agrochemical applications and animal feeding.
Particulate matter emissions in Canada: why do they matter?
Particulate matter is a type of air pollution caused by solid particles and liquid droplets suspended in the air. These can have harmful impacts on human health and the environment.
Particulate matter emissions can impact the health of agricultural workers and animals. They can decrease atmospheric visibility and can lead to increased respiratory diseases and premature death.
Particulate matter emissions also impact the environment. They can contribute to ozone depletion and acid rain. They can influence climate by reducing the amount of solar radiation reaching the earth and preventing it from escaping back into space.
The agricultural sector is a significant contributor to particulate matter emissions.
The Government of Canada must report on particulate matter on farmland. This helps the public and other countries know if Canada’s farmlands are healthy and where improvements to farming practices need to be made.
What causes particulate matter emissions?
Particulate matter in the atmosphere comes from primary and secondary sources.
Primary sources are those that release particles directly into the air.
Primary sources result from processes such as wind erosion, land preparation, crop harvest, grain handling, fertilizer and chemical application, crop residue burning, pollen emissions, animal feeding operations and carcass burning.
Secondary sources refer to those where particulate matter is formed in the air when particles react. Ammonia emissions are the main agricultural source of secondary particulate matter. Ammonia can react with other airborne particles to contribute to smog.
Agricultural particulate matter emissions can vary over space and over time. Emissions from land preparation and crop harvesting vary by season. Emissions from livestock operations vary by type of livestock and by the type of building involved in production.
Agricultural Particulate Matter Emissions – the indicator
The Agricultural Particulate Matter Emissions Indicator measures the amount of particulate matter added to the atmosphere from agricultural activity. It also measures whether this is changing over time.
It includes estimates of additions from wind erosion, land preparation, crop harvesting, fertilizer and chemical application, crop residue burning, pollen emissions, animal feeding operations and animal carcass burning. Most data come from the federal Census of Agriculture and the Farm Environmental Management Survey (FEMS). The amount of emissions is categorized into five relative risk classes: very low, low, moderate, high and very high.
The Government of Canada calculates the Agricultural Particulate Matter Emissions Indicator every five years. It helps the Government know how particulate matter emissions on farmland are changing over time. This helps to identify where changes to farming practices are needed.
Particulate matter emissions in Canada – current state and the change over time
In 2021, Canada had a Particulate Matter emissions rating of ‘moderate.’ In western Canada, areas of high or very high emissions occurred in the Fraser Valley of British Columbia, the Moist Mixed Grassland, Mixed Grassland and Aspen Parkland and Manitoba Plains regions of the Prairies. In central and eastern Canada, areas of high or very high emissions occurred in the Manitoulin-Lake Simcoe, and Lake Erie Lowlands and St. Lawrence Lowlands of Ontario and Quebec. Areas with the highest emissions are in regions with both intensive livestock production and intensive crop production (such as the Fraser Valley, Southern Alberta, and Manitoba).
The main sources of particulate matter emissions on cropland include land preparation tillage (43%), wind erosion (37%), crop harvesting (11%) and fertilizer application (4%). Ninety percent of cropland emissions come from annual cropland. Lesser amounts come from summerfallow (8%) and forage crops (2%). Emissions from pasture land are negligible.
Particulate Matter TSP Emissions (kg ha-1 yr-1) in 2021
Particulate matter emissions from Canada’s agricultural lands have shown long-term and short-term declines. Emissions have decreased by more than 69% since 1981 and by 9% since 2016.
Overall, emissions have declined in all provinces. The greatest declines have occurred in the Prairies. This has been achieved through Beneficial Management Practices (BMPs) that have reduced emissions from tillage and wind erosion during land preparation and harvesting. These practices include reduced till and no-till land preparation, and reduced summerfallow.
Over this time, however, emissions from animal populations and fertilizer application have increased across Canada. There are also areas of the country where total particulate matter emissions have increased including the St. Lawrence Lowlands, southern Manitoba and parts of the Maritimes.
Change in TSP Emissions (kg ha-1 yr-1) between 1981 and 2021
How can particulate matter emissions be reduced?
There have been important reductions in particulate matter emissions in Canada since 1981. Despite this, many farming practices can be modified to further reduce emissions:
Animal feeding operations
- Decrease animal confinement time (or increase the grazing period)
- Collect litter and manure more frequently
- Install dust-extraction or filtered ventilation systems
- Sprinkle water mist or oil onto the floor, or ground surface, to reduce dust
Increase the amount of soil cover
- Use reduced tillage and no-till
- Decrease the amount of land under summerfallow
- Increase the area of permanent grassland
- Use forages in rotations
- Grow winter cover crops
- Use strip cropping, contour cultivation and windbreaks
Crop harvesting
- Harvest crops under high relative humidity and low wind speed
- Use terraces, contouring and strip-cropping to decrease the transport of harvested crop Fragments by the wind
Fertilizer application
- Optimize the timing of fertilizer application and fertilizer placement
- Match applications to the nutrient needs of crops
Agrochemical application
- Restrict applications to cool days with calm conditions
- Select the appropriate nozzle
- Reduce sprayer travel speed
- Lower sprayer boom height
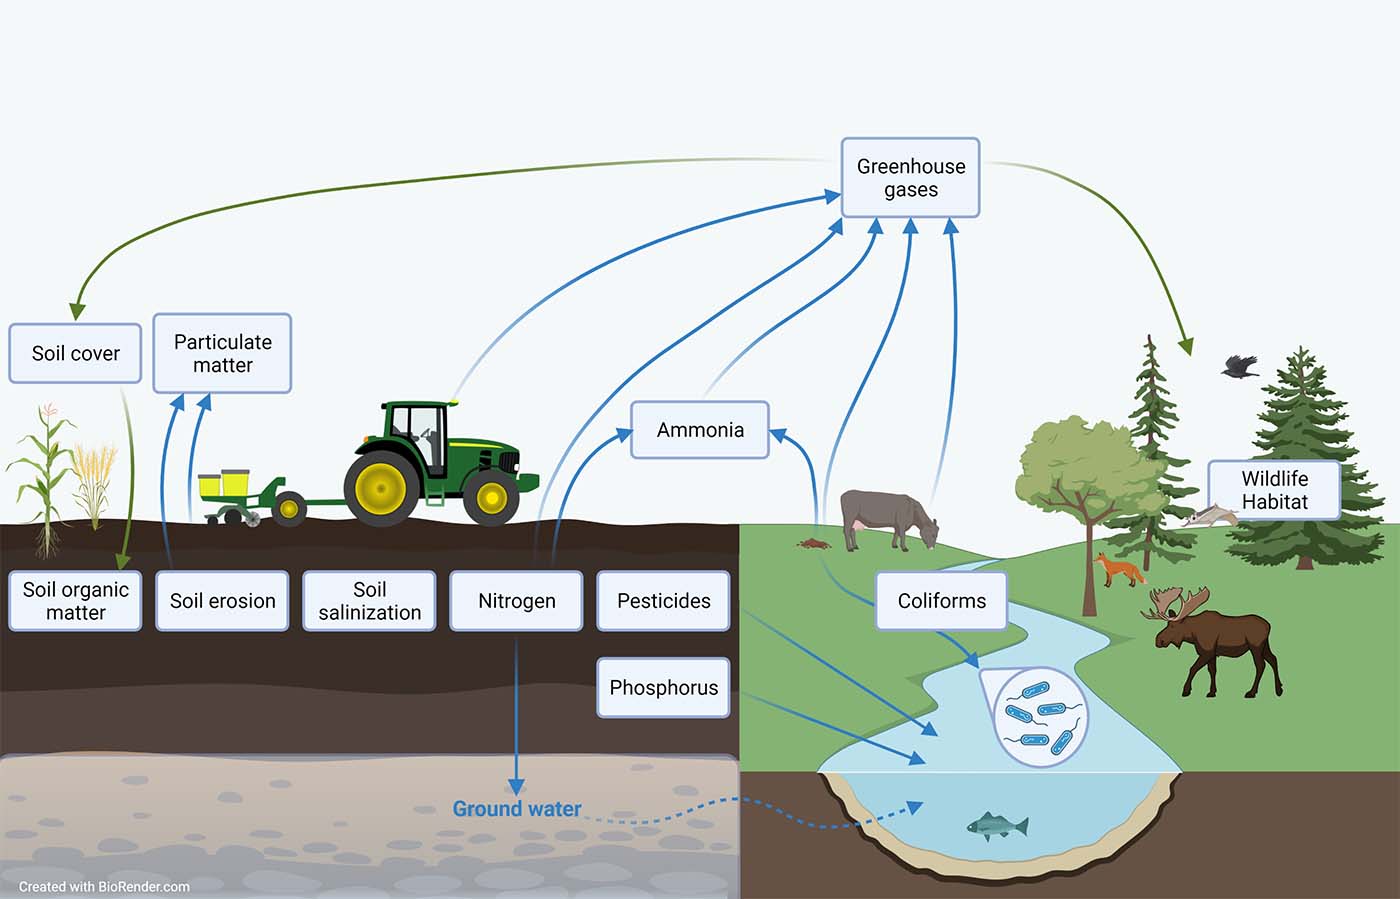
Description of the image above
An infographic showing an agricultural landscape with crops, a tractor, soil and grazing livestock adjacent to a natural landscape with a watercourse, forest and wild animals. Info boxes are placed to show to which element of the landscape each agricultural sustainability indicator pertains. Arrows connect some of the info boxes to show interrelationships. One info box is present for each of the following indicators: Soil cover, particulate matter, soil organic matter, soil erosion, soil salinization, nitrogen, pesticides, phosphorus, ammonia, greenhouse gases, coliforms and wildlife habitat.
Agriculture and Agri-Food Canada's agri-environmental indicators (AEIs) provide a science-based snapshot of the current state and trend of Canada’s agri-environmental performance in terms of soil quality (soil organic matter, soil erosion, soil salinization), water quality (nitrogen, pesticides, phosphorus, coliforms), air quality (particulate matter, ammonia, greenhouse gas emissions) and farmland management (agricultural land use, soil cover, wildlife habitat). While indicator results are presented individually, agro-ecosystems are complex, so many of the indicators are interrelated. This means that changes in one indicator may be associated with changes in other indicators as well.
Learn more
Particulate Matter Indicator technical report
Related indicators
- The Soil Erosion Indicator tracks the health of Canadian agricultural soils as it relates to the risk of erosion from tillage, water and wind.
- The Soil Cover Indicator summarizes the effective number of days in a year that Canadian agricultural soils are protected by vegetation, crop residue or snow.
- The Ammonia Indicator estimates the annual emissions of ammonia to the atmosphere from livestock production and fertilizer applications on Canadian farmland.
Additional resources and downloads
Discover and download geospatial data related to this and other indicators.