
Authors:
D.A. Lobb, S. Li, B.G. McConkey and T.C. Martin
Indicator Name:
Soil Erosion Risk Indicator (SoilERI; integrating the risks of wind, water and tillage erosion)
Status:
National Coverage, 1981 to 2016
Risk of Soil Erosion Index — T. Hoppe, T. Martin and R.L. Clearwater
A performance index is a statistical snapshot of a set of variables used to show the current state and to track changes over time. Agriculture and Agri-Food Canada has developed performance indices that assign single values to the indicator results. By statistically converting the indicator map to a single value from 0 to 100 for each year, we can assess whether the indicator has improved or declined over time.
State and Trend
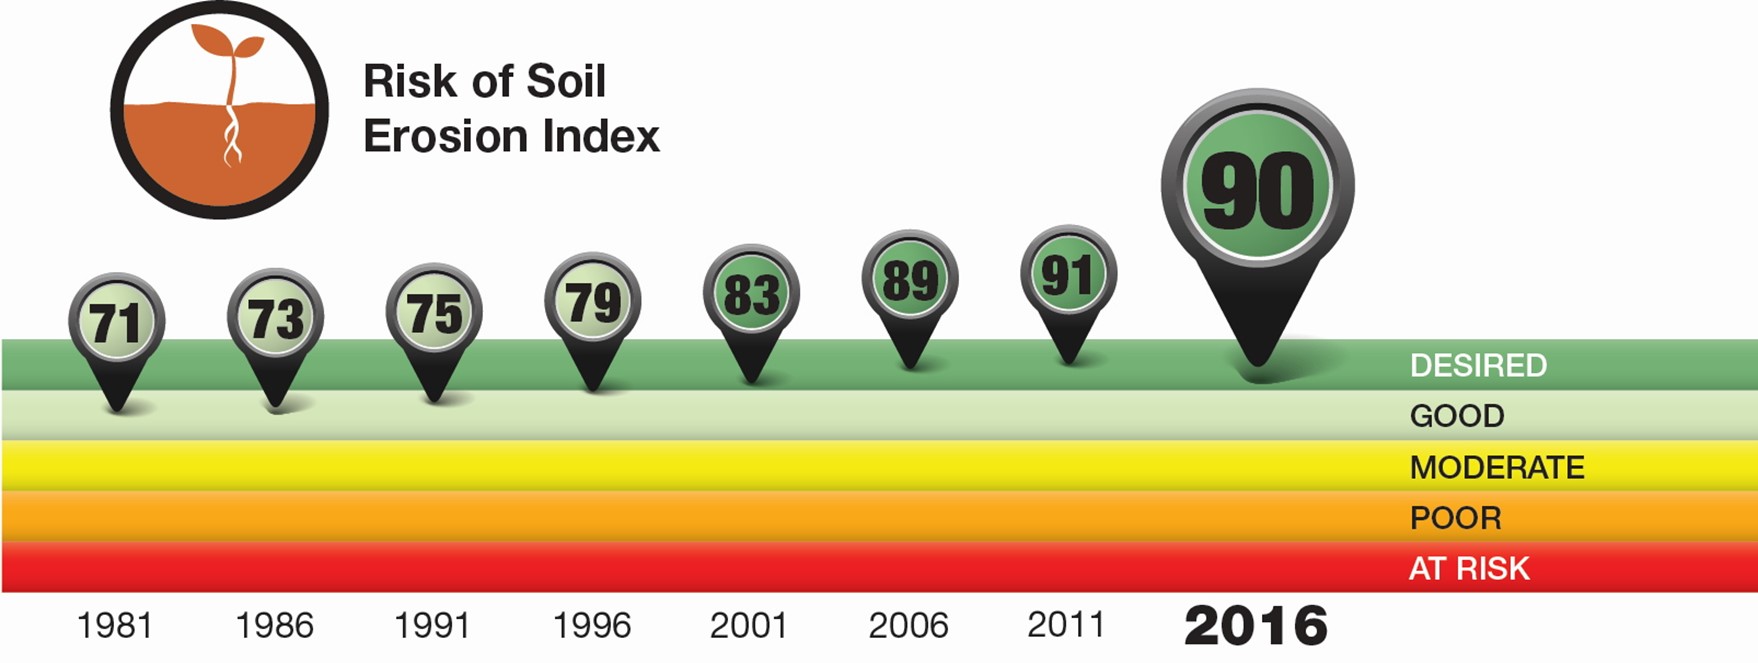
In 2016 the state of the environment from the standpoint of the risk of soil erosion on farmland in Canada was 'Desired.' The index has been moving upwards, from an index value of 71 in 1981 to a value of 90 in 2016, representing a declining risk of soil erosion across the country. These improvements came about primarily as a result of widespread adoption of conservation tillage, as well as decreases in the use of summerfallow in the Prairie Provinces, making soils less vulnerable to the effects of tillage and wind erosion in particular. The index tends to aggregate and generalize trends. Specific findings, regional variations and interpretations are more explicitly discussed in the Results and Interpretation section of this chapter.
Description of the image above
The SoilERI covers the years 1981 to 2016 in five-year increments. The index value ranges from 0 to 100 in twenty-point increments with each increment assigned a qualitative rating: 0-19 is At risk; 20-39 is Poor; 40-59 is Moderate; 60-79 is Good; 80-100 is Desired.
| Year | Index value | Index rating |
|---|---|---|
| 1981 | 71 | Good |
| 1986 | 73 | Good |
| 1991 | 75 | Good |
| 1996 | 79 | Good |
| 2001 | 83 | Desired |
| 2006 | 89 | Desired |
| 2011 | 91 | Desired |
| 2016 | 90 | Desired |
Summary
Soil erosion — the movement of soil from one area to another, resulting in losses and accumulations — occurs through three main processes: wind, water and tillage erosion. It occurs naturally on cropland through the erosive action of wind and water, erosion that can be accelerated by some farming activities (for example, summerfallow or row cropping). It is also caused directly by tillage, which results in the progressive downslope movement of soil from hilltops to accumulate at the base of hills.
Soil erosion is a major threat to the sustainability of agriculture in Canada. Erosion removes topsoil, reduces soil organic matter and contributes to the breakdown of soil structure. This adversely affects soil fertility, movement of air and water into and from the soil surface, and, ultimately, crop yields and profitability. Yields from severely eroded soils may be substantially lower than those from non-eroded soil in the same field. Erosion can also have significant adverse environmental and economic impacts off-farm through the physical transport and deposition of soil particles and through the release and transport of nutrients, pesticides, and pathogens from agricultural lands. Management of the combined effects of wind, water and tillage erosion is required to maintain soil health.
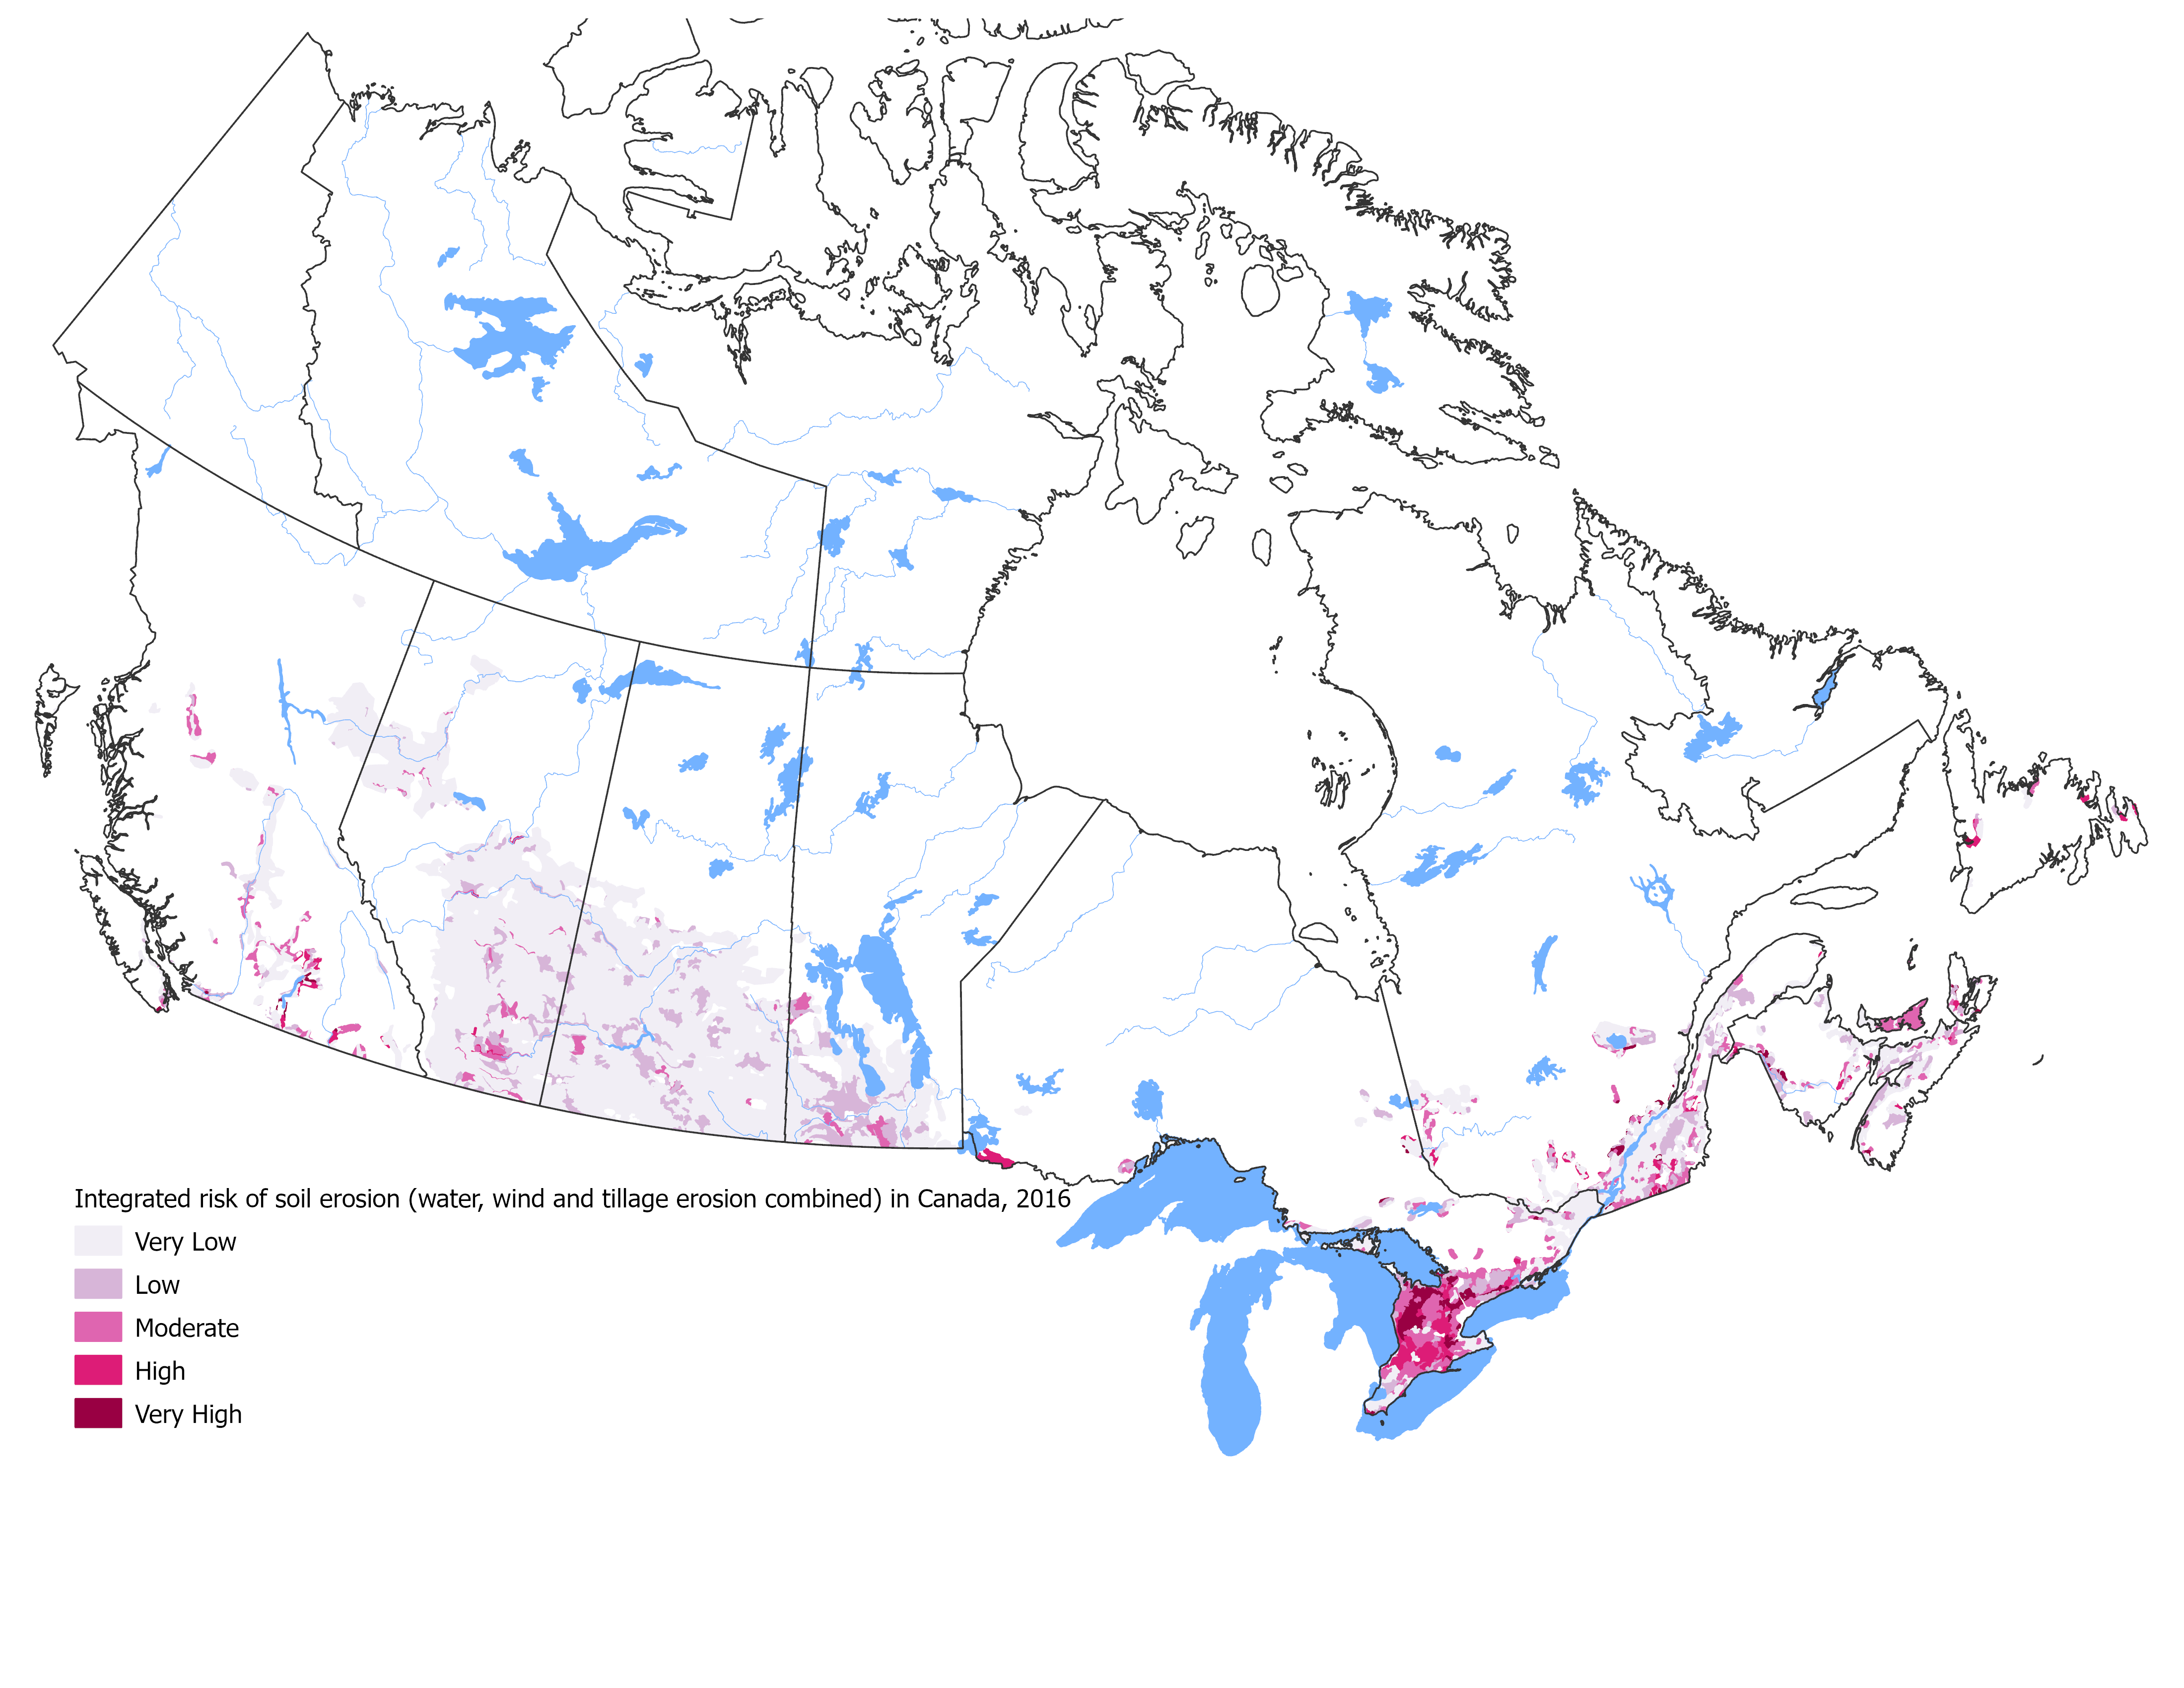
The SoilERI is an indicator for the combined risk of water, wind and tillage erosion when climate, soil, topography and farming practices are considered. The SoilERI was calculated for each Soil Landscape of Canada (SLC) polygon as the sum of wind, water and tillage erosion rates.
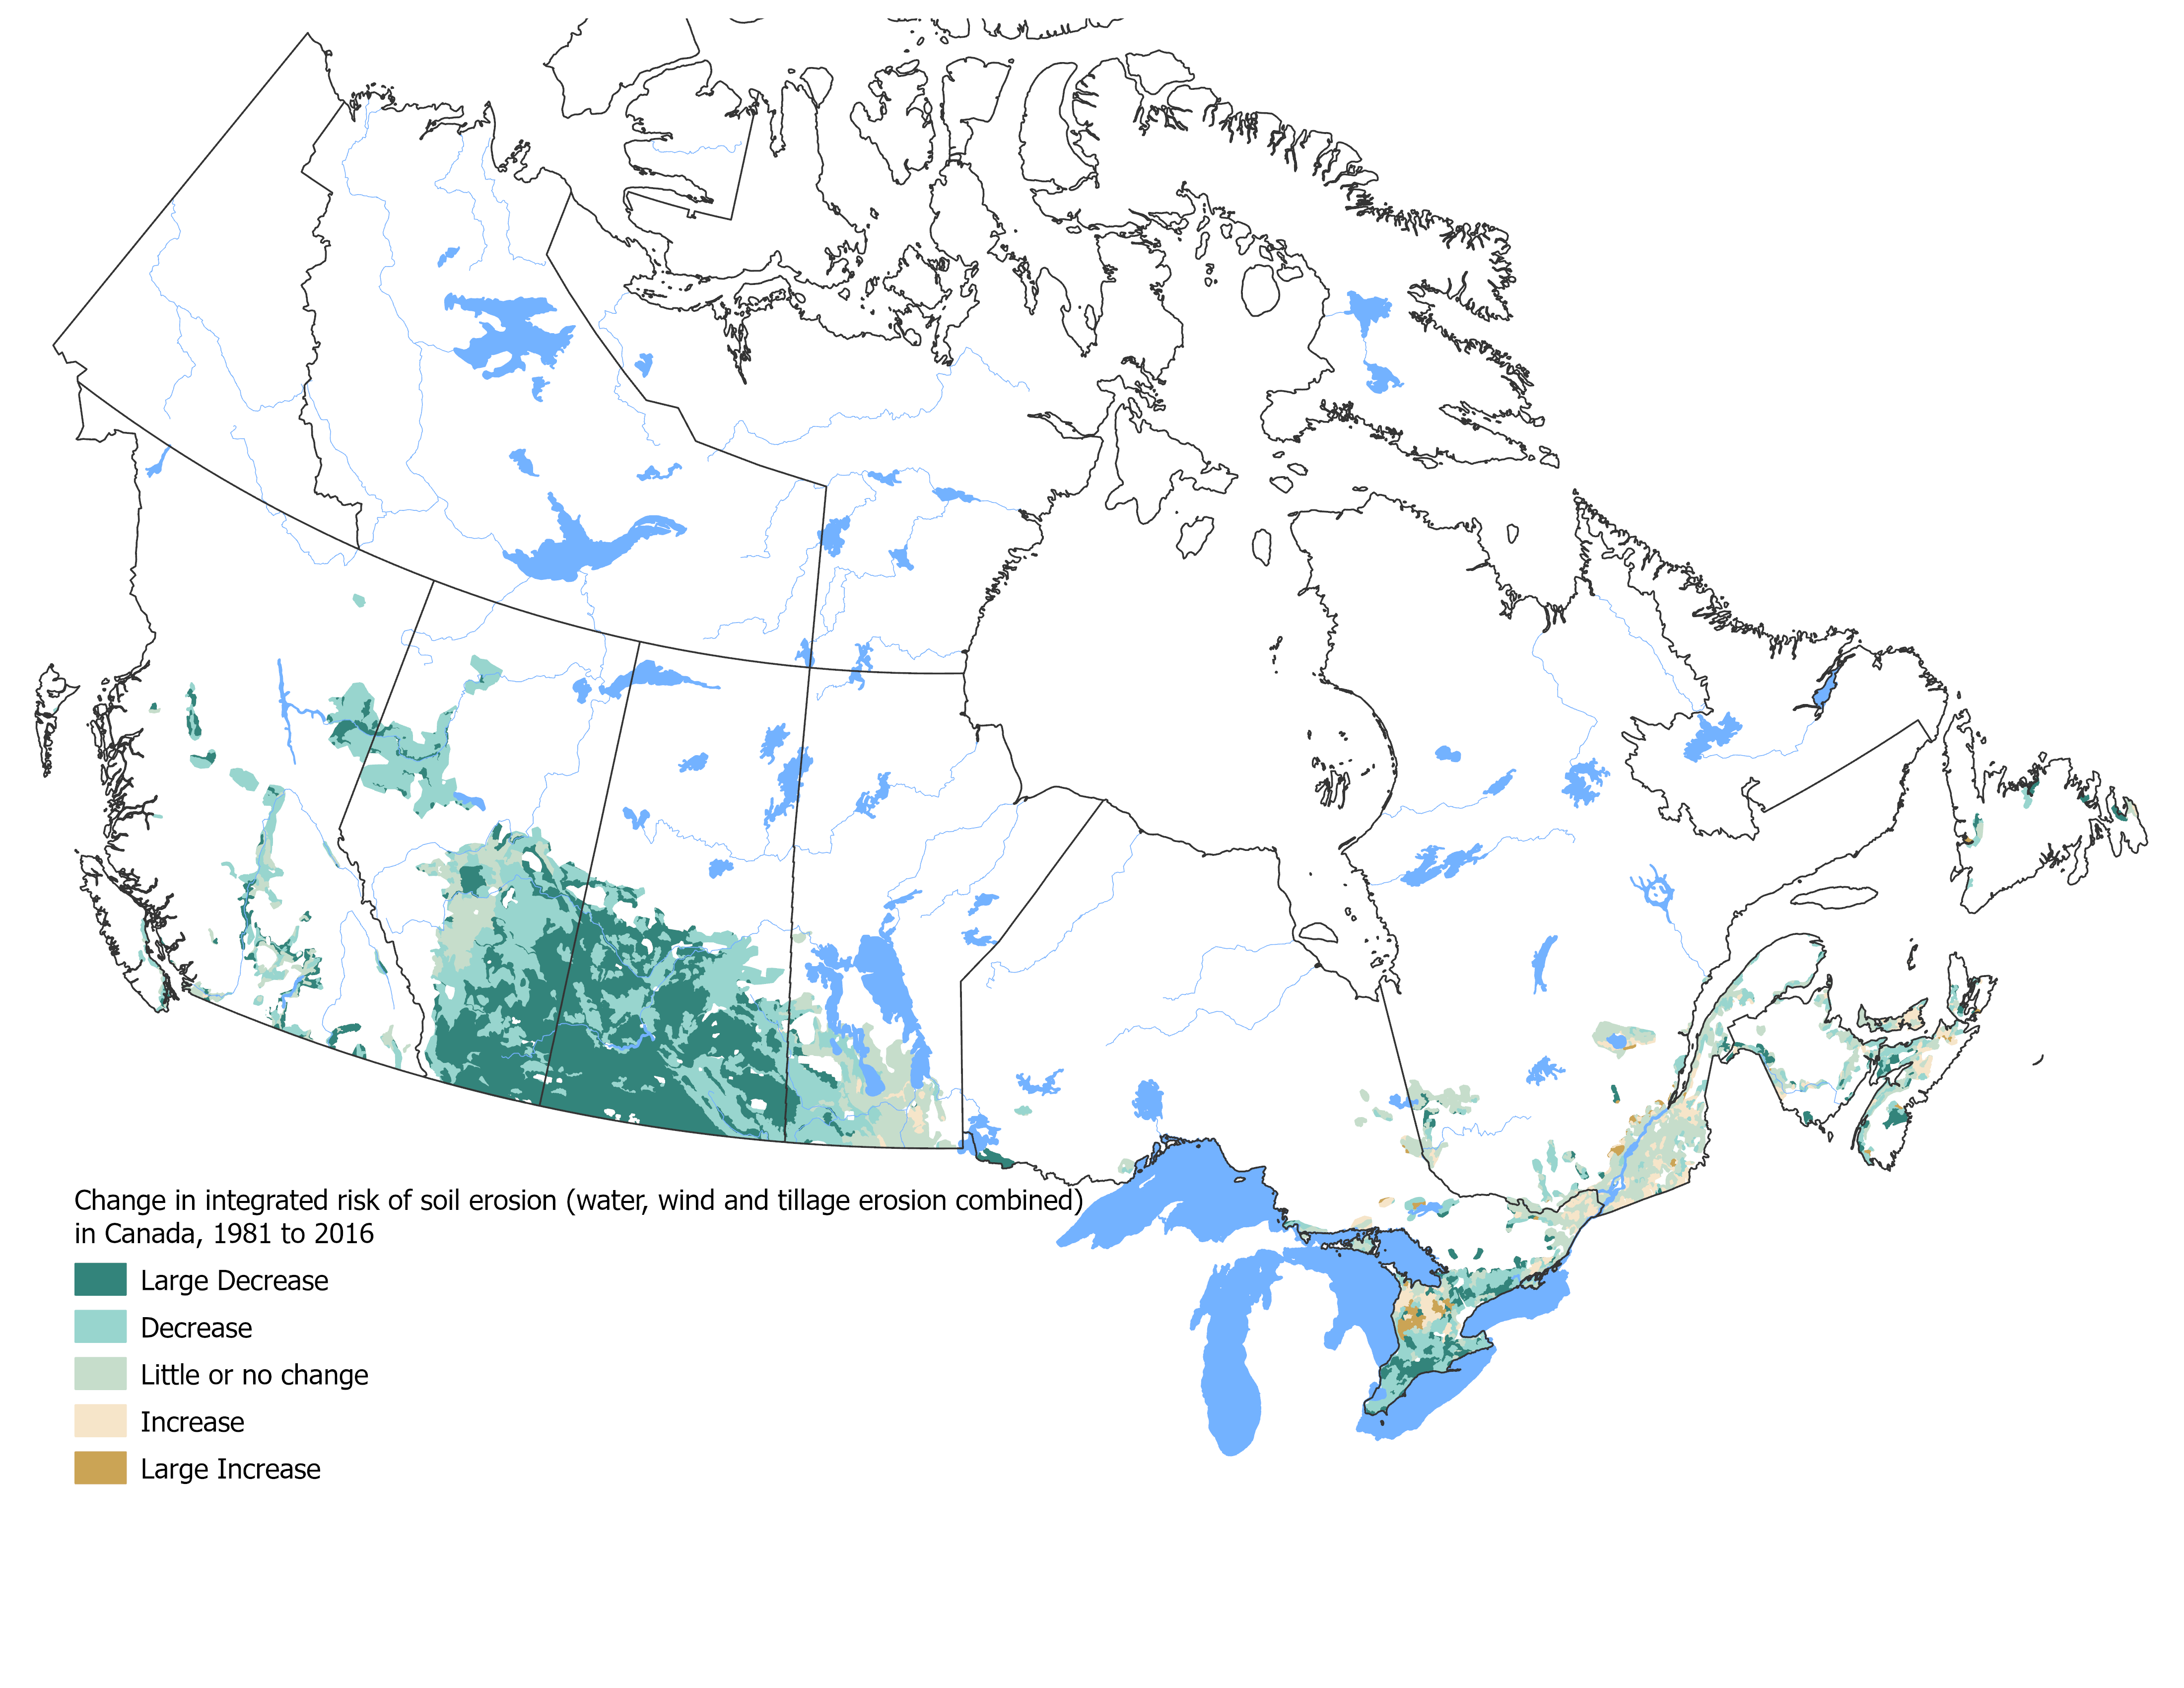
Soil loss from the combined effects of wind, water and tillage decreased in most provinces of Canada between 1981 and 2016. Over that period, the proportion of cropland in the very low risk class increased from 36% to 76%. Much of this change is due to a reduction in wind and tillage erosion in the Prairie provinces. In 2016, 12% of cropland remained in the moderate to very high risk classes, reflecting high levels of water and tillage erosion in other provinces. This slight increase from 10% in 2011 is a reversal of the preceding 30-year trend of decreasing soil erosion risk.
The issue and why it matters
Soil erosion poses a serious threat to the sustainability of agriculture in Canada without the adoption of adequate management practices for erosion control. The loss of soil from current and past management is a major cause of decreased soil health, lower crop productivity, inefficient use of cropping inputs, and also increases in risk to water quality through sedimentation, release and transport of nutrients, pesticides and other substances. Soil erosion occurs through three main processes: wind, water and tillage erosion. The combined effects of wind, water and tillage erosion pose a more serious threat than individual erosion processes.
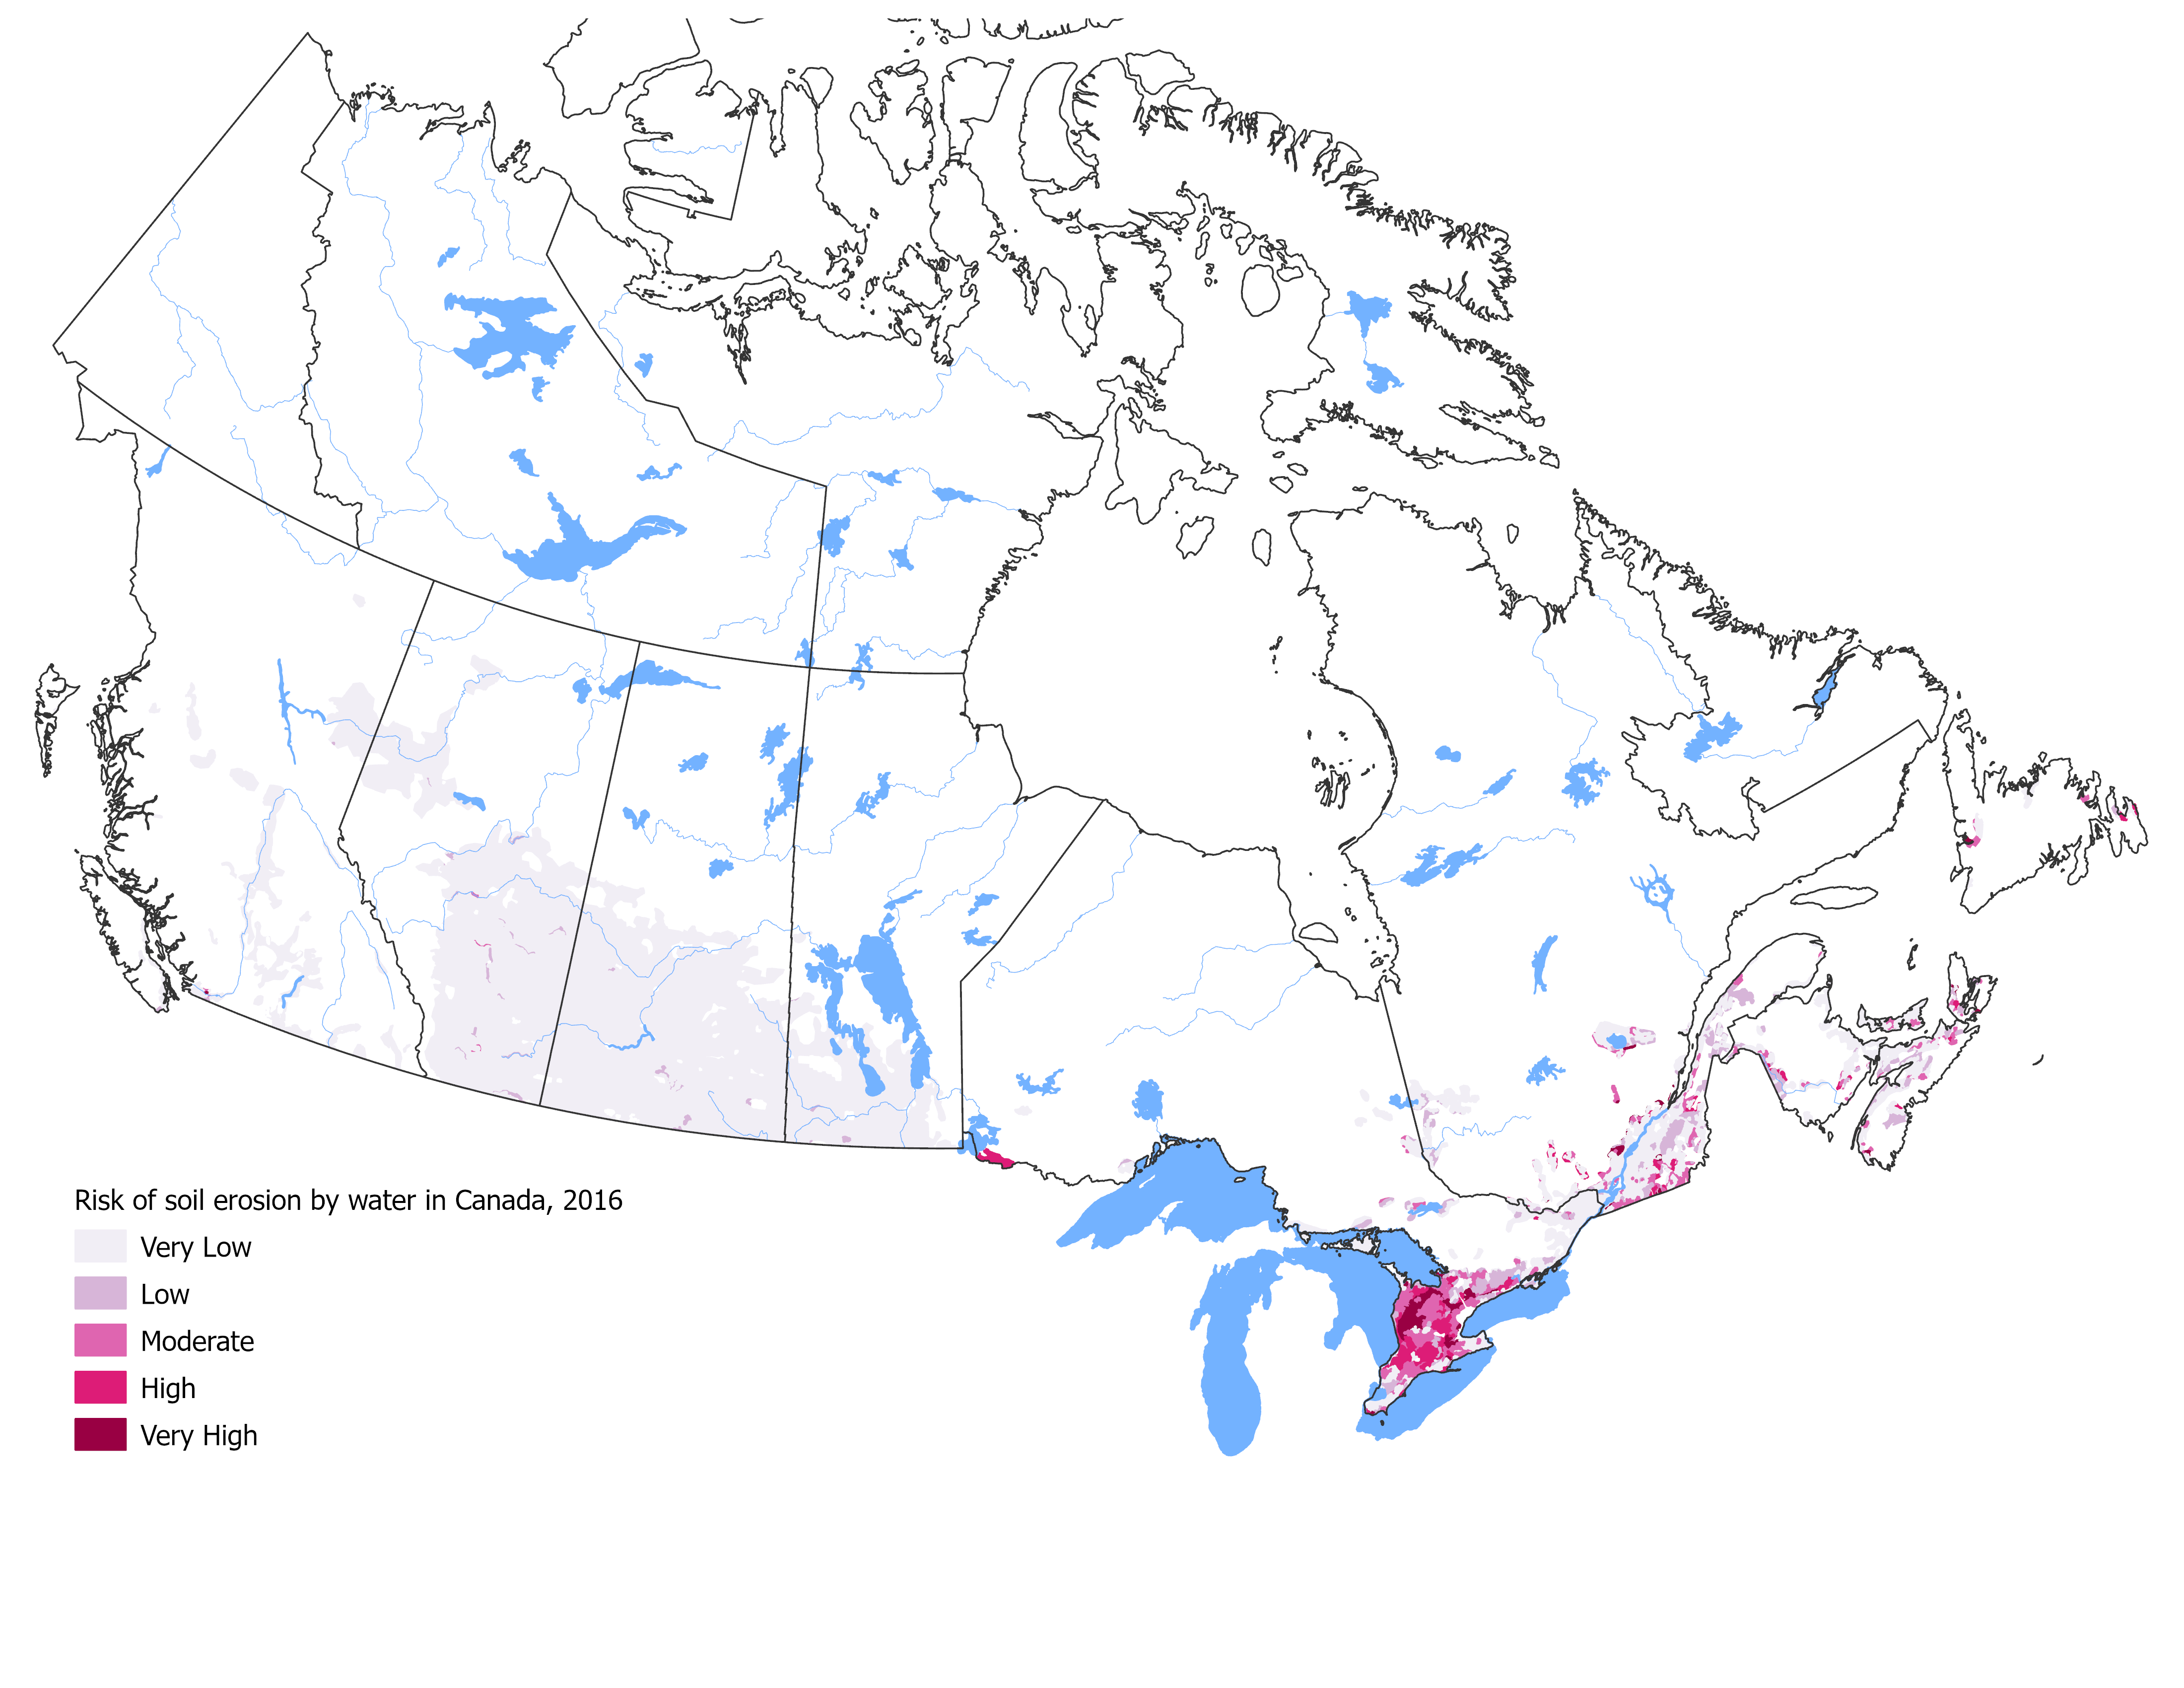
Water erosion
Rainfall and runoff are the driving forces behind water erosion. In addition to the degradation caused by the loss of topsoil, eroded soil is carried in runoff to agricultural drains, ditches and other waterways where suspended soil particles increase the turbidity (cloudiness) of the water, add to sediment build-up in the waterways and reservoirs, and deliver nutrients and pesticides that are carried with the eroded soil and runoff into the surface waterways and water bodies.
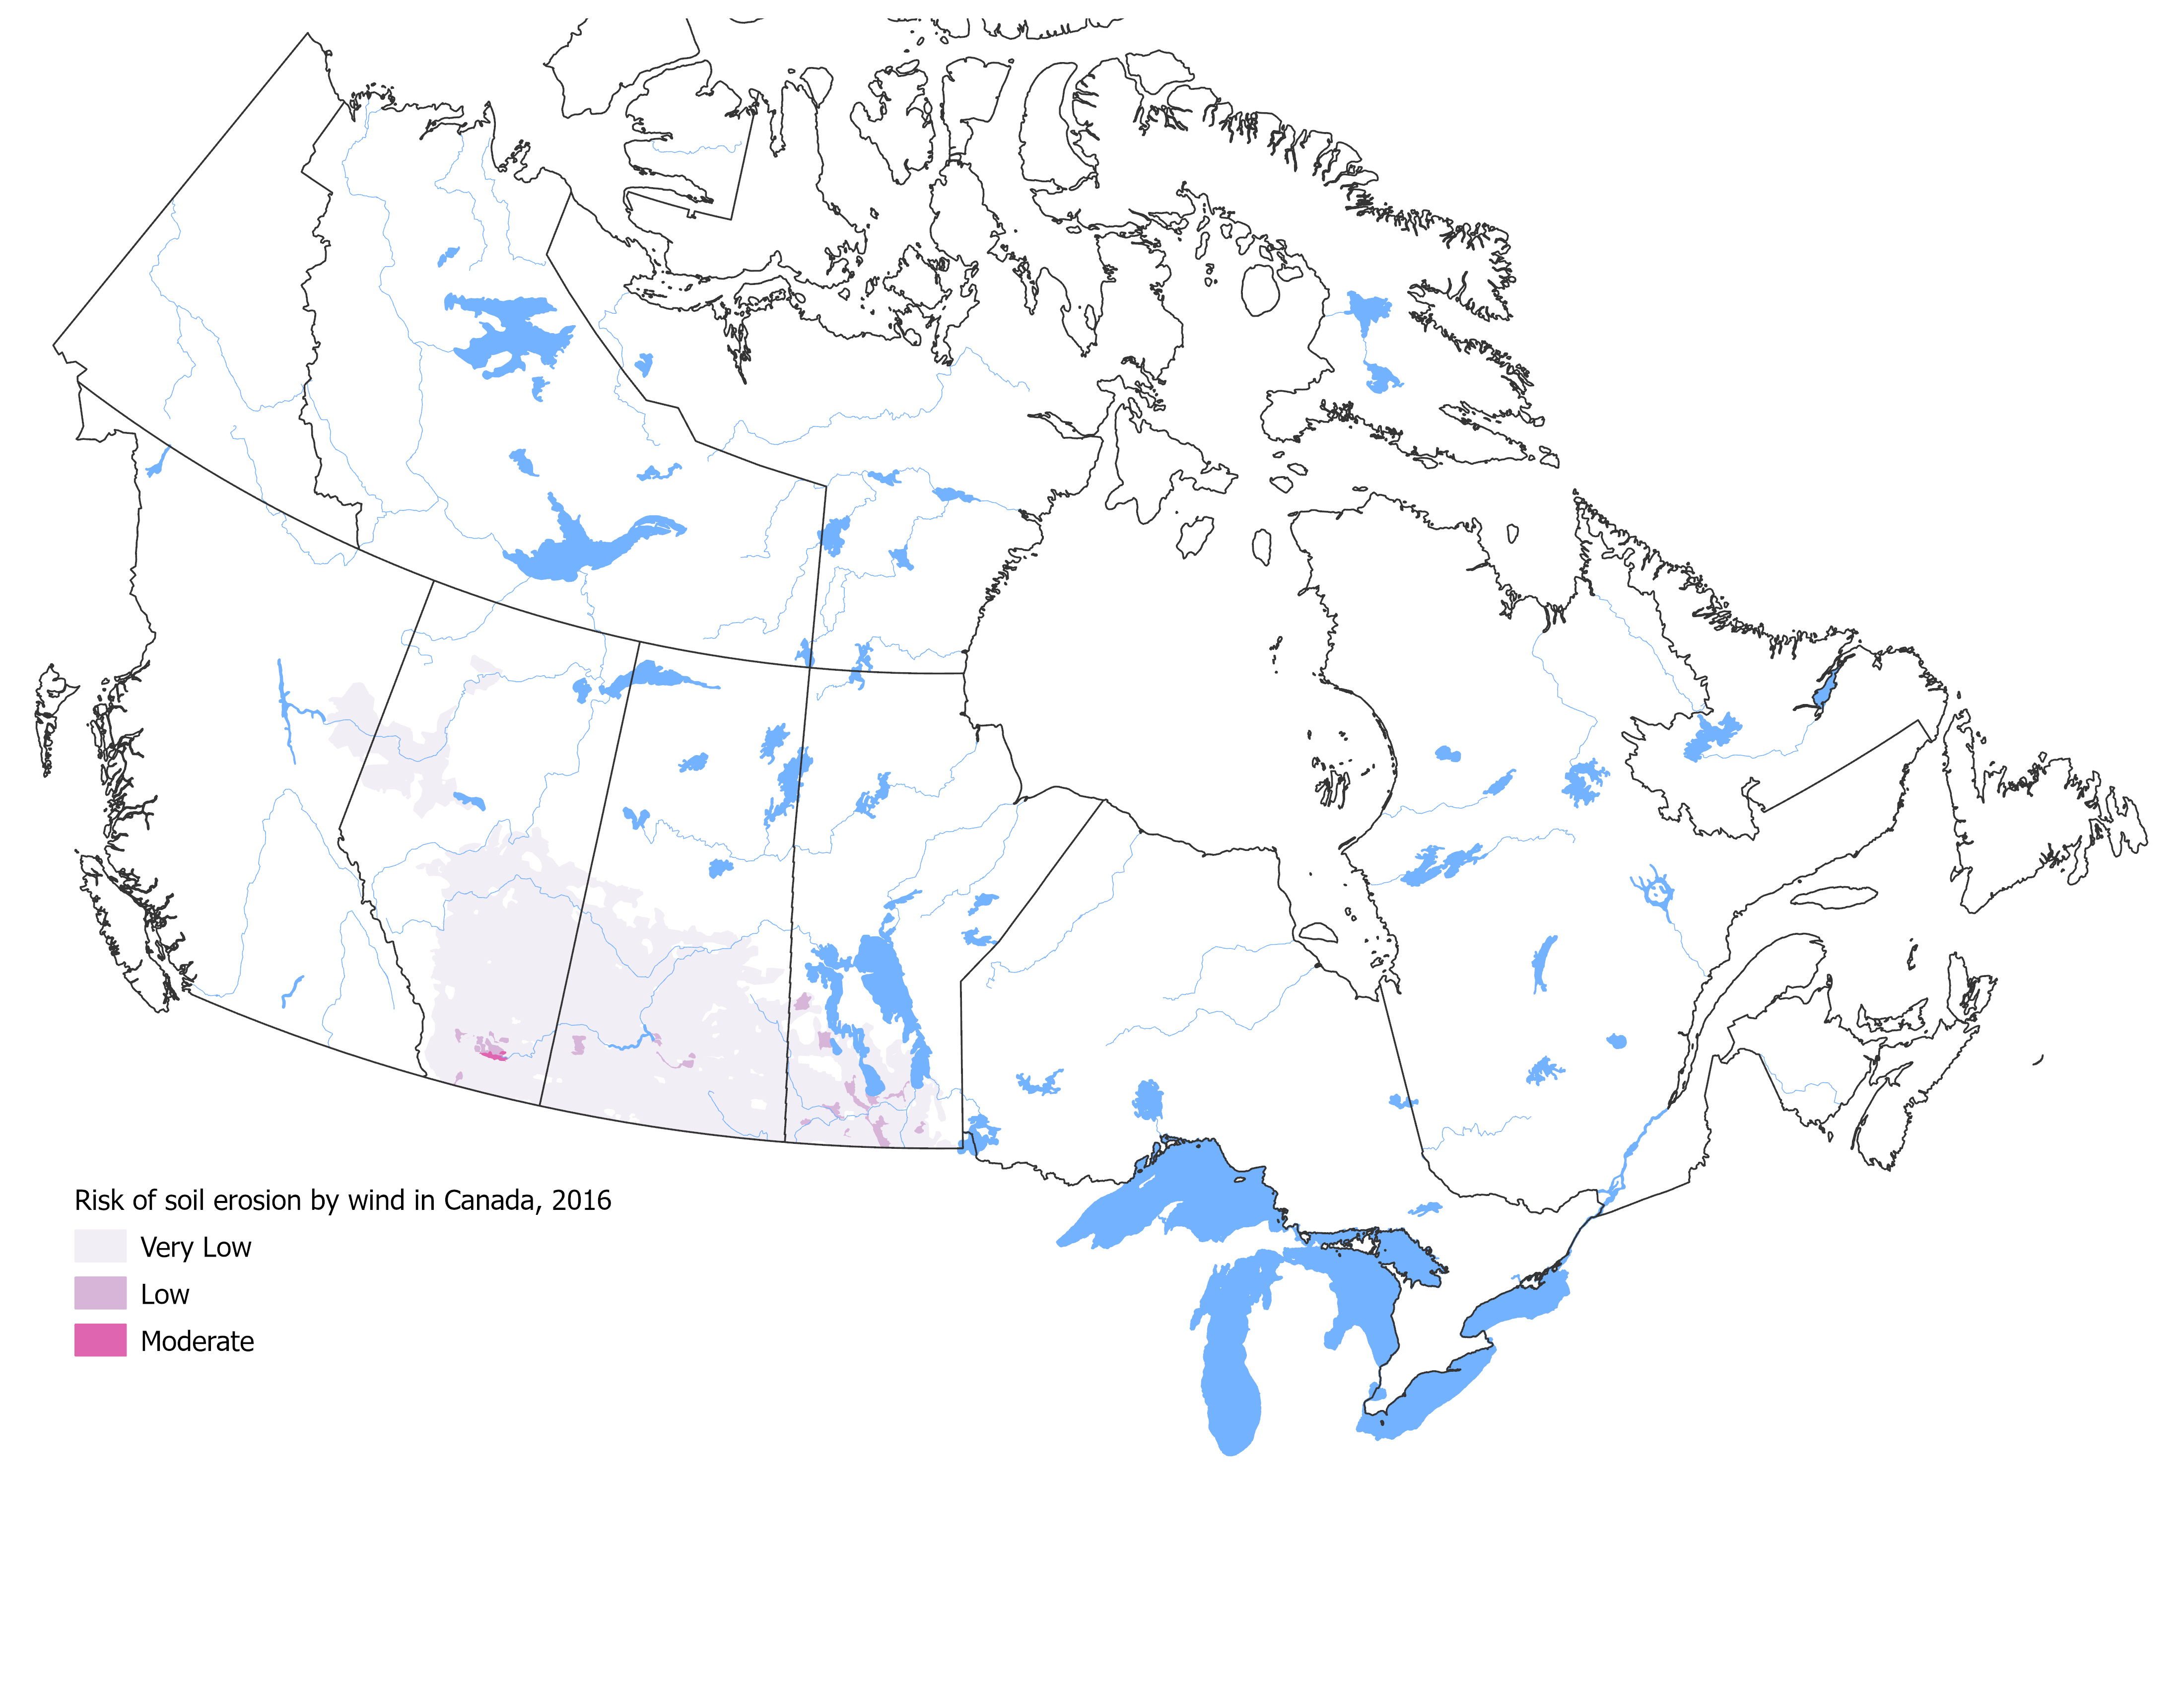
Wind erosion
Wind erosion is a concern in many areas of Canada, from the sandy soils along the Fraser River in British Columbia to the coastal areas of the Atlantic Provinces, but it is in the Prairie region that has the greatest potential for wind erosion. This stems from the region's dry climate and vast expanses of cultivated land with little protection from the wind.
Tillage erosion
Many farm implements move soil, and on sloping land this movement is influenced by gravity which causes more soil to be moved when soil is tilled downslope than when tilled upslope. Even when tilling is done across the slope, more soil will be moved downslope than upslope. The resulting progressive downslope movement of soil from hilltops and soil accumulation at the base of hills is called tillage erosion.
Evidence of tillage erosion is found on hilly land across Canada. This form of erosion is most severe on land that has many short, steep slopes and in areas where intensive cropping and tillage practices are used. Although distinct from wind and water erosion, tillage erosion influences wind and water erosion by exposing the subsoil that is often more sensitive to these erosion processes, and by delivering soil to the areas of the landscape where water erosion is most intense. As such, tillage erosion also contributes to the off-site environmental impacts of soil erosion by wind and water.
Reducing all forms of soil erosion is a challenge as some practices are effective in reducing soil loss by more than one form of erosion, and other practices reduce one form of erosion while increasing another form. Tillage practices that are effective in reducing wind and water erosion are not necessarily effective in reducing tillage erosion. For example, the chisel plough leaves more crop residues on the soil surface than the moldboard plough, providing more protection against wind and water erosion. However, the chisel plough can move soil over a much greater distance and cause more tillage erosion. Shelterbelts and water diversion terraces reduce wind and water erosion, but the addition of any field boundaries or obstacles within a landscape results in more widespread soil losses associated with tillage erosion. High disturbance direct seeding used in some no-till cropping systems can cause as much tillage erosion as the moldboard plough because it moves soil great distances and with great variability. Clearly, management practices to reduce soil erosion require integrated approaches that target the combined effects of soil loss by all forms of erosion.
The Indicator
The SoilERI was used to assess the risk of soil erosion from the combined effects of wind, water and tillage erosion on cultivated agricultural lands. Calculated at the Soil Landscapes of Canada (SLC) polygon scale, this indicator and its component indicators for wind, water and tillage erosion reflect the characteristics of the climate, soil and topography and respond to changes in farming practices over the 35-year period from 1981 to 2016. Reporting takes place with each new Census of Agriculture, with current census data providing the basis for the backward-looking analysis. As such, the farms and lands included in the reported data and used in the analysis vary slightly, reflecting changes in the Canadian agricultural footprint over the years.
Soil erosion was calculated using landform data and the associated soil and topographic data in the National Soil Database. Each SLC polygon is characterized by one or more representative landforms, and each landform is characterized by hillslope segments (upper, mid and lower slopes and depression). Each hillslope segment is characterized by a slope gradient and slope length. Hillslope segment data was revised to better reflect the topographically complex nature of landforms (for example, differences between convergent, divergent and irregular slopes) and the influence of landform on erosion processes.
Soil erosion risk by wind, water and tillage was calculated as soil loss on all segments of a landform. However, soil losses by wind and tillage erosion are greatest on the upper slopes and soil losses by water erosion are greatest on the mid slopes. The SoilERI was assessed as the cumulative soil loss rate for the slope segment with the greatest rate of loss — since the slope segment with the greatest rate of loss will largely determine changes in management. For analysis and reporting purposes, the erosion rates were summed across areas to SLC polygon, provincial, regional and national levels.
The erosion indicator calculation estimates the average annual rate of soil loss for each census year. These values are reported in five classes: very low (less than 6 tonnes per hectare per year, which can also be expressed as 6 t ha-1 yr-1), low (6 to 11 t ha-1 yr-1), moderate (11 to 22 t ha-1 yr-1), high (22 to 33 t ha-1 yr-1) and very high (greater than 33 t ha-1 yr-1). Areas in the very low risk class are considered capable of sustaining long-term crop production and maintaining agri-environmental health under current conditions. The other four classes represent the risk of unsustainable conditions that call for soil conservation practices to support crop production over the long term and to reduce risk to soil health and productivity.
Limitations
Results from the soil erosion indicators, when interpreted at provincial and national scales and over the eight census years are considered to provide reasonably accurate spatial and temporal trends. However, they are subject to limitations, which affect their accuracy and uncertainty. These limitations include the following:
- Soil erosion models estimate current average annual rates of soil loss. They do not provide an assessment of the cumulative level of past soil losses, which impacts crop production and environmental performance. As such, the adoption of no-till represents a dramatic reduction in the current rate of soil loss, but it does not reflect the historical soil erosion and its current impacts.
- Landforms are represented in the National Soil Database by simple, two-dimensional hillslopes. As such, the landform data reflect neither the topographic variety and complexity that exist in real landscapes nor the effect of manmade features such as fence lines, tree lines, roadways, ditches and drainage ways on the slope. For many landforms, these missing data cause overestimates of soil loss by water erosion and underestimates of soil loss by tillage erosion.
- The SoilERI represents the slope position with the greatest soil loss, the upper or mid-slope areas of a landscape. Values are averages for slope segments of representative landforms; thus, specific areas may be at greater risk than indicated by the risk class assessment.
- The SoilERI is a simple sum of the soil losses by wind, water and tillage erosion; it does not allow for interactions that occur over time among erosion processes.
- Wind and water erosion indicators do not account for some erosion control practices: grassed waterways, strip cropping, terracing, contour tillage and contour cropping, winter cover crops and shelter belts.
- The water erosion indicator does not include gully erosion — the deep-cutting, severe erosion that occurs where runoff concentrates. Water erosion risk should also be considered less accurate for locations in which significant erosion occurs when soils are frozen. In particular, the erosion risk from rainfall occurring on a thawed soil layer overlying frozen soil is likely underestimated.
- The tillage erosion indicator only accounts for soil erosion that occurs along the lengths of hillslopes (the primary or downslope gradient, which defines the slopes used in modelling). It does not include soil erosion that occurs across hillslopes (secondary or cross-slope gradient), and it does not include planning or scalping caused by tillage equipment operated over uneven or irregular slopes.
- Wind erosion may be significant in some years on exposed sandy and peaty soils outside of the Prairie Provinces, but these situations were not considered.
- The nature of what constitutes conventional, conservation and no-till tillage systems has evolved significantly since 1981. Generally, conventional tillage has become less intensive, and no-till includes some tillage, narrowing the differences in intensity between tillage systems. This is in part due to a broadening of the definition of tillage to include tertiary tillage operations (that is, soil disturbance during seeding through to harvest operations) in addition to primary and secondary tillage operations.
Results and interpretation
The risk of soil erosion on Canadian cropland has steadily declined between 1981 and 2011, but has increased slightly again in 2016 (Figure 2, Table 1). The majority of the change and improvement occurred between 1991 and 2006. In 2016, 76% of cropland area was in the very low risk class versus 36% in 1981, marking a considerable improvement. The cropland area in the higher risk classes each decreased by about one half during this time period, reaching a cumulative total of 24% in 2016. The increase in erosion risk since 2011 suggests that reductions in erosion risk due to ongoing practice change maybe have plateaued. New approaches will be required if we are to see continued reductions in erosion risk in Canada.
The integrated erosion risk indicator results (Figure 1) show a trend that is less positive than the results from the individual component indicators for water, wind and tillage erosion (Figure 3, Figure 4 and Figure 5, respectively), but they better reflect the actual risk of soil degradation by erosion. The improvement in soil erosion risk reflects reduction in wind and tillage erosion risk, with percentage share increases of 13% and 21% in the very low risk class, respectively, compared to a decrease of 3% for water erosion (Table 1, Table 2, Table 3, and Table 4).

| Class | Very Low (<6 t ha-1 yr-1) |
Low (6 to 11 t ha-1 yr-1) |
Moderate (11 to 22 t ha-1 yr-1) |
High (22 to 33 t ha-1 yr-1) |
Very High (>33 t ha-1 yr-1) |
||||||||||||||||||||
|---|---|---|---|---|---|---|---|---|---|---|---|---|---|---|---|---|---|---|---|---|---|---|---|---|---|
| Year | 1981 | 1991 | 2001 | 2011 | 2016 | 1981 | 1991 | 2001 | 2011 | 2016 | 1981 | 1991 | 2001 | 2011 | 2016 | 1981 | 1991 | 2001 | 2011 | 2016 | 1981 | 1991 | 2001 | 2011 | 2016 |
| Alberta | 53 | 56.3 | 71.8 | 87.8 | 91 | 15.2 | 17.7 | 15.3 | 9.8 | 6.8 | 20.5 | 15.7 | 11.5 | 2.3 | 2 | 7.8 | 8.8 | 0.9 | 0.1 | 0.2 | 3.4 | 1.6 | 0.6 | 0 | 0 |
| British Columbia | 52.5 | 65.1 | 84.1 | 91.5 | 91.2 | 38 | 26.1 | 11.5 | 4.9 | 5 | 6.1 | 5.6 | 2 | 1.5 | 2.9 | 0.3 | 0.6 | 0.5 | 0.6 | 0.3 | 3.1 | 2.7 | 1.9 | 1.5 | 0.6 |
| Manitoba | 50.8 | 56.4 | 62.4 | 77 | 62.8 | 32 | 30.5 | 25.5 | 17 | 30.2 | 16.2 | 12.3 | 11.6 | 5.8 | 6.6 | 0.5 | 0.3 | 0.4 | 0.2 | 0.4 | 0.4 | 0.5 | 0 | 0 | 0 |
| New Brunswick | 45.7 | 48.8 | 46.7 | 49.5 | 44 | 32.4 | 29.7 | 30.4 | 29.3 | 36.6 | 4.6 | 7.9 | 9.7 | 11 | 9.5 | 10 | 6.9 | 7.5 | 4 | 4.3 | 7.3 | 6.7 | 5.8 | 6 | 5.5 |
| Newfoundland | 19.3 | 23.3 | 32.7 | 29.6 | 32.9 | 22.5 | 15.6 | 7.9 | 5.8 | 16.7 | 11.7 | 48.2 | 41.4 | 41 | 22.5 | 37.3 | 5.6 | 13 | 17.5 | 27 | 9.2 | 7.3 | 5 | 6.1 | 0.9 |
| Nova Scotia | 39.6 | 48.9 | 51.4 | 62.5 | 57.6 | 42.9 | 40.2 | 42.7 | 26.5 | 34.8 | 15.3 | 10.1 | 4.6 | 10.3 | 6.5 | 1.7 | 0.6 | 1.2 | 0.6 | 0.8 | 0.5 | 0.3 | 0.1 | 0.2 | 0.3 |
| Ontario | 28.3 | 24.5 | 30.6 | 30.7 | 29.6 | 10.3 | 16.7 | 12.6 | 15.3 | 11.8 | 21.2 | 19.6 | 21.3 | 27.6 | 29.4 | 20.2 | 17.9 | 24.2 | 16.9 | 17.6 | 20 | 21.3 | 11.2 | 9.6 | 11.6 |
| Prince Edward Island | 23.2 | 24.1 | 23.2 | 23.5 | 23.2 | 16 | 9.5 | 0 | 0 | 0 | 60.8 | 66.4 | 76.8 | 76.5 | 76.8 | 0 | 0 | 0 | 0 | 0 | 0 | 0 | 0 | 0 | 0 |
| Quebec | 80.2 | 81.8 | 74.6 | 81.7 | 76.4 | 10.5 | 9.7 | 13.3 | 8.1 | 11.8 | 6.1 | 6.9 | 10.2 | 7.8 | 9.1 | 2 | 0.4 | 0.8 | 1.1 | 1.5 | 1.2 | 1.2 | 1.2 | 1.3 | 1.3 |
| Saskatchewan | 21.6 | 29.9 | 59.2 | 85.8 | 89.7 | 40.5 | 36.9 | 19 | 13.3 | 9.8 | 25 | 27.3 | 20.2 | 0.8 | 0.6 | 8.2 | 2.7 | 1.4 | 0 | 0 | 4.8 | 3.2 | 0.2 | 0 | 0 |
| Canada | 35.6 | 41.2 | 60.7 | 77.3 | 76.1 | 29.9 | 28.7 | 17.7 | 12.6 | 12.4 | 21.5 | 21.1 | 16.4 | 6.3 | 7 | 7.9 | 4.9 | 3.7 | 2.4 | 2.7 | 5.1 | 4 | 1.6 | 1.4 | 1.8 |
| Class | Very Low (<6 t ha-1 yr-1) |
Low (6 to 11 t ha-1 yr-1) |
Moderate (11 to 22 t ha-1 yr-1) |
High (22 to 33 t ha-1 yr-1) |
Very High (>33 t ha-1 yr-1) |
||||||||||||||||||||
|---|---|---|---|---|---|---|---|---|---|---|---|---|---|---|---|---|---|---|---|---|---|---|---|---|---|
| Year | 1981 | 1991 | 2001 | 2011 | 2016 | 1981 | 1991 | 2001 | 2011 | 2016 | 1981 | 1991 | 2001 | 2011 | 2016 | 1981 | 1991 | 2001 | 2011 | 2016 | 1981 | 1991 | 2001 | 2011 | 2016 |
| Alberta | 97 | 98.2 | 99 | 99.4 | 99.3 | 2.3 | 1.2 | 0.5 | 0.4 | 0.3 | 0.6 | 0.6 | 0.5 | 0.2 | 0.4 | 0.1 | 0 | 0 | 0 | 0 | 0 | 0 | 0 | 0 | 0 |
| British Columbia | 99.3 | 99.4 | 99.6 | 99.9 | 99.1 | 0.5 | 0.3 | 0.3 | 0.1 | 0.9 | 0.2 | 0.2 | 0 | 0 | 0 | 0 | 0 | 0 | 0 | 0 | 0 | 0 | 0 | 0 | 0 |
| Manitoba | 99 | 99.2 | 99.2 | 99.5 | 98.9 | 0.5 | 0.6 | 0.8 | 0.4 | 0.9 | 0.5 | 0.3 | 0.1 | 0.1 | 0.2 | 0 | 0 | 0 | 0 | 0 | 0 | 0 | 0 | 0 | 0 |
| New Brunswick | 66.9 | 75.9 | 76 | 64.6 | 58.6 | 20.9 | 12.5 | 12 | 22.9 | 30 | 9.9 | 9.1 | 10.8 | 8.7 | 8.4 | 2.2 | 2.4 | 1.1 | 3.6 | 3 | 0.1 | 0 | 0.1 | 0.1 | 0 |
| Newfoundland | 74.5 | 73.6 | 75.2 | 72.7 | 69 | 0.5 | 2.7 | 1 | 7.1 | 3.1 | 6.4 | 17 | 14.6 | 14.5 | 18.4 | 16.6 | 0 | 9.2 | 0 | 8.7 | 2.1 | 6.6 | 0 | 5.6 | 0.9 |
| Nova Scotia | 77.5 | 86.5 | 88.3 | 84.3 | 80.4 | 11.4 | 10.1 | 7.9 | 10.8 | 14.5 | 8.9 | 2.6 | 2.6 | 4.3 | 4.3 | 1.6 | 0.6 | 1.2 | 0.6 | 0.7 | 0.5 | 0.3 | 0.1 | 0 | 0.3 |
| Ontario | 34 | 35.9 | 36.1 | 36.3 | 34 | 15.9 | 16.2 | 12.8 | 13.2 | 13 | 15.1 | 12.3 | 18.7 | 26.7 | 25.1 | 19 | 17.7 | 23.2 | 15.4 | 18.4 | 16 | 18 | 9.2 | 8.5 | 9.6 |
| Prince Edward Island | 84.3 | 85.2 | 87.9 | 88 | 87.9 | 4.6 | 4.5 | 0.5 | 0.4 | 0.4 | 11.1 | 10.4 | 11.6 | 11.6 | 11.7 | 0 | 0 | 0 | 0 | 0 | 0 | 0 | 0 | 0 | 0 |
| Quebec | 86.4 | 87.1 | 78.3 | 85.3 | 80.3 | 6.9 | 6.8 | 13.2 | 7.1 | 10.3 | 4.3 | 4.6 | 7 | 5.3 | 6.7 | 1.3 | 0.3 | 0.3 | 1.1 | 1.4 | 1.2 | 1.2 | 1.1 | 1.2 | 1.3 |
| Saskatchewan | 97.4 | 97.6 | 98.9 | 99.5 | 99.6 | 2 | 1.8 | 1.1 | 0.5 | 0.4 | 0.6 | 0.6 | 0 | 0 | 0 | 0 | 0 | 0 | 0 | 0 | 0 | 0 | 0 | 0 | 0 |
| Canada | 91.3 | 92 | 90.7 | 89.9 | 88.4 | 3.4 | 3 | 2.9 | 2.7 | 3.2 | 2.1 | 1.8 | 2.7 | 4.1 | 4.3 | 1.7 | 1.6 | 2.6 | 2.1 | 2.7 | 1.5 | 1.6 | 1.1 | 1.2 | 1.4 |
| Class | Very Low (<6 t ha-1 yr-1) |
Low (6 to 11 t ha-1 yr-1) |
Moderate (11 to 22 t ha-1 yr-1) |
High (22 to 33 t ha-1 yr-1) |
Very High (>33 t ha-1 yr-1) |
||||||||||||||||||||
|---|---|---|---|---|---|---|---|---|---|---|---|---|---|---|---|---|---|---|---|---|---|---|---|---|---|
| Year | 1981 | 1991 | 2001 | 2011 | 2016 | 1981 | 1991 | 2001 | 2011 | 2016 | 1981 | 1991 | 2001 | 2011 | 2016 | 1981 | 1991 | 2001 | 2011 | 2016 | 1981 | 1991 | 2001 | 2011 | 2016 |
| Alberta | 82.5 | 87.8 | 94.6 | 97.8 | 98.3 | 11.5 | 7.1 | 3 | 1.6 | 1.4 | 4.6 | 4 | 2.4 | 0.6 | 0.4 | 1 | 1 | 0 | 0 | 0 | 0.3 | 0 | 0 | 0 | 0 |
| British Columbia | 100 | 100 | 100 | 100 | 100 | 0 | 0 | 0 | 0 | 0 | 0 | 0 | 0 | 0 | 0 | 0 | 0 | 0 | 0 | 0 | 0 | 0 | 0 | 0 | 0 |
| Manitoba | 83.2 | 87.9 | 90.8 | 91.5 | 88.2 | 15.4 | 10.1 | 7.3 | 8.5 | 10.5 | 1.4 | 2 | 1.9 | 0 | 1.3 | 0 | 0 | 0 | 0 | 0 | 0 | 0 | 0 | 0 | 0 |
| Saskatchewan | 85.4 | 88.6 | 95.7 | 99.6 | 99.6 | 11.8 | 9.7 | 3.8 | 0.4 | 0.4 | 2.5 | 1.6 | 0.5 | 0 | 0 | 0.3 | 0.1 | 0 | 0 | 0 | 0 | 0 | 0 | 0 | 0 |
| Canada | 84.5 | 88.4 | 94.7 | 97.9 | 97.3 | 12.1 | 9 | 4 | 1.9 | 2.3 | 2.9 | 2.3 | 1.3 | 0.2 | 0.3 | 0.4 | 0.3 | 0 | 0 | 0 | 0.1 | 0 | 0 | 0 | 0 |
| Class | Very Low (<6 t ha-1 yr-1) |
Low (6 to 11 t ha-1 yr-1) |
Moderate (11 to 22 t ha-1 yr-1) |
High (22 to 33 t ha-1 yr-1) |
Very High (>33 t ha-1 yr-1) |
||||||||||||||||||||
|---|---|---|---|---|---|---|---|---|---|---|---|---|---|---|---|---|---|---|---|---|---|---|---|---|---|
| Year | 1981 | 1991 | 2001 | 2011 | 2016 | 1981 | 1991 | 2001 | 2011 | 2016 | 1981 | 1991 | 2001 | 2011 | 2016 | 1981 | 1991 | 2001 | 2011 | 2016 | 1981 | 1991 | 2001 | 2011 | 2016 |
| Alberta | 71.3 | 73.1 | 84.6 | 94.6 | 96 | 15.3 | 14.8 | 7 | 4.7 | 3.2 | 6.6 | 6.4 | 7.7 | 0.7 | 0.8 | 6.1 | 5 | 0.6 | 0 | 0 | 0.7 | 0.6 | 0.2 | 0 | 0 |
| British Columbia | 56.9 | 70.6 | 83.8 | 91.5 | 90.9 | 33.8 | 20.3 | 11.6 | 4.9 | 5.6 | 5.7 | 5.6 | 2.1 | 1.5 | 2.7 | 0.3 | 0.6 | 0.5 | 1.4 | 0.3 | 3.3 | 2.8 | 2 | 0.7 | 0.6 |
| Manitoba | 76.2 | 75.5 | 90.7 | 94.3 | 94.7 | 14.4 | 15.1 | 4 | 4.5 | 4.4 | 8.8 | 8.7 | 5.3 | 1.2 | 0.9 | 0.7 | 0.7 | 0 | 0 | 0 | 0 | 0 | 0 | 0 | 0 |
| New Brunswick | 63.8 | 68 | 72.5 | 74 | 78.8 | 16.6 | 13.6 | 7.2 | 8.2 | 4.4 | 7.7 | 9.3 | 13.4 | 11.5 | 9.8 | 5.5 | 3.5 | 1.1 | 0.7 | 1.7 | 6.3 | 5.6 | 5.8 | 5.5 | 5.3 |
| Newfoundland | 43.8 | 45.9 | 58.9 | 51 | 58.3 | 19.1 | 15.3 | 7.8 | 8 | 11.2 | 7.4 | 34.7 | 28 | 30.8 | 25.2 | 23.9 | 0.3 | 5 | 5.8 | 5.3 | 5.7 | 3.7 | 0.4 | 4.4 | 0 |
| Nova Scotia | 60.6 | 69.5 | 79.5 | 83.8 | 79.5 | 32.8 | 25 | 18.5 | 13.1 | 18.6 | 6.3 | 5.3 | 2 | 2.9 | 1.7 | 0.1 | 0 | 0 | 0 | 0 | 0.2 | 0.2 | 0.1 | 0.2 | 0.2 |
| Ontario | 44.5 | 45.2 | 49.9 | 49.8 | 49.3 | 11.4 | 14 | 28.2 | 38.1 | 37.1 | 33.4 | 33.7 | 15 | 6.5 | 6.5 | 5.5 | 2.8 | 6.5 | 5.6 | 6.6 | 5.2 | 4.4 | 0.3 | 0 | 0.4 |
| Prince Edward Island | 35.1 | 35.3 | 31.3 | 31.6 | 31.6 | 36.4 | 18.1 | 28.1 | 16.9 | 10.2 | 28.5 | 46.5 | 40.5 | 51.5 | 58.2 | 0 | 0 | 0 | 0 | 0 | 0 | 0 | 0 | 0 | 0 |
| Quebec | 91.2 | 92.9 | 92.3 | 93.5 | 92.6 | 6.1 | 3.9 | 3.8 | 3.5 | 5.7 | 2.1 | 3.1 | 3.9 | 3 | 1.7 | 0.6 | 0 | 0 | 0 | 0 | 0 | 0 | 0 | 0 | 0 |
| Saskatchewan | 65.8 | 65.8 | 72.6 | 94.2 | 95.8 | 7.6 | 7.7 | 20.7 | 5.8 | 4.2 | 22.1 | 21.8 | 6.6 | 0 | 0 | 3.5 | 4.7 | 0.2 | 0 | 0 | 1 | 0 | 0 | 0 | 0 |
| Canada | 67.2 | 67.9 | 76.4 | 88 | 88.4 | 10.8 | 10.8 | 15 | 9.5 | 8.8 | 17 | 16.9 | 7.6 | 1.8 | 1.8 | 3.7 | 3.8 | 0.9 | 0.8 | 0.9 | 1.2 | 0.6 | 0.1 | 0 | 0.1 |
The decrease in all forms of erosion across Canada has been largely attributable to the widespread adoption of conservation tillage, particularly no-till systems, which increased from less than 2% to 59% of cropland between 1981 and 2016. No-till is now the most common tillage practice used for cereal crops in the Prairies, in particular Saskatchewan (73%) and Alberta (69%, Figure 6), which account for the majority of Canada's total agricultural land. Changes in soil erosion from the ratio of crops grown were less of a contributing factor. Crops normally produced using more intensive tillage (increasing the risk of erosion) such as corn, potatoes and beans increased in area from 5% of cropland in 1981 to 22% in 2016. This uptrend was offset by a decrease in summerfallow (a practice which increased erosion risk), from 24% in 1981 to 2% in 2016 (Figure 7). High residue crops requiring very little tillage such as alfalfa and hay, increased from 14% in 1981 to 18% in 2011, but dropped again to 15% in 2016. Although most crops have seen a reduction in tillage intensity, the adoption of no-till in cereals has had the greatest influence on soil erosion owing to the large share of cropland devoted to cereals.
Among the cropping systems found across Canada, the highest risk of soil erosion is associated with potato production in the Atlantic Maritimes, which requires intensive tillage and is not conducive to the adoption of conservation tillage practices. The cropping system that presents the next highest risk of erosion is corn and soybean produced with conventional tillage. However, in this case there is considerable potential to reduce the erosion risk through conservation tillage. On landscapes across Canada, the highest risk of soil erosion is associated with slopes of 10% or more, especially in Eastern Canada, where there is an inherently high risk of water erosion owing to the climatic conditions. Soil erosion is of particular concern in situations where cropping systems involving a high erosion risk are paired with soil landscapes with high erosion risks. This is the case for a significant proportion of the cropland in southern Ontario and in Atlantic Canada. However, there are areas in every province that present risks of unsustainable soil erosion, including the steep slopes of the Hand Hills region of southern Alberta, the very dry and loamy soils of windy southern Saskatchewan, and the steep slopes along the Manitoba escarpment.
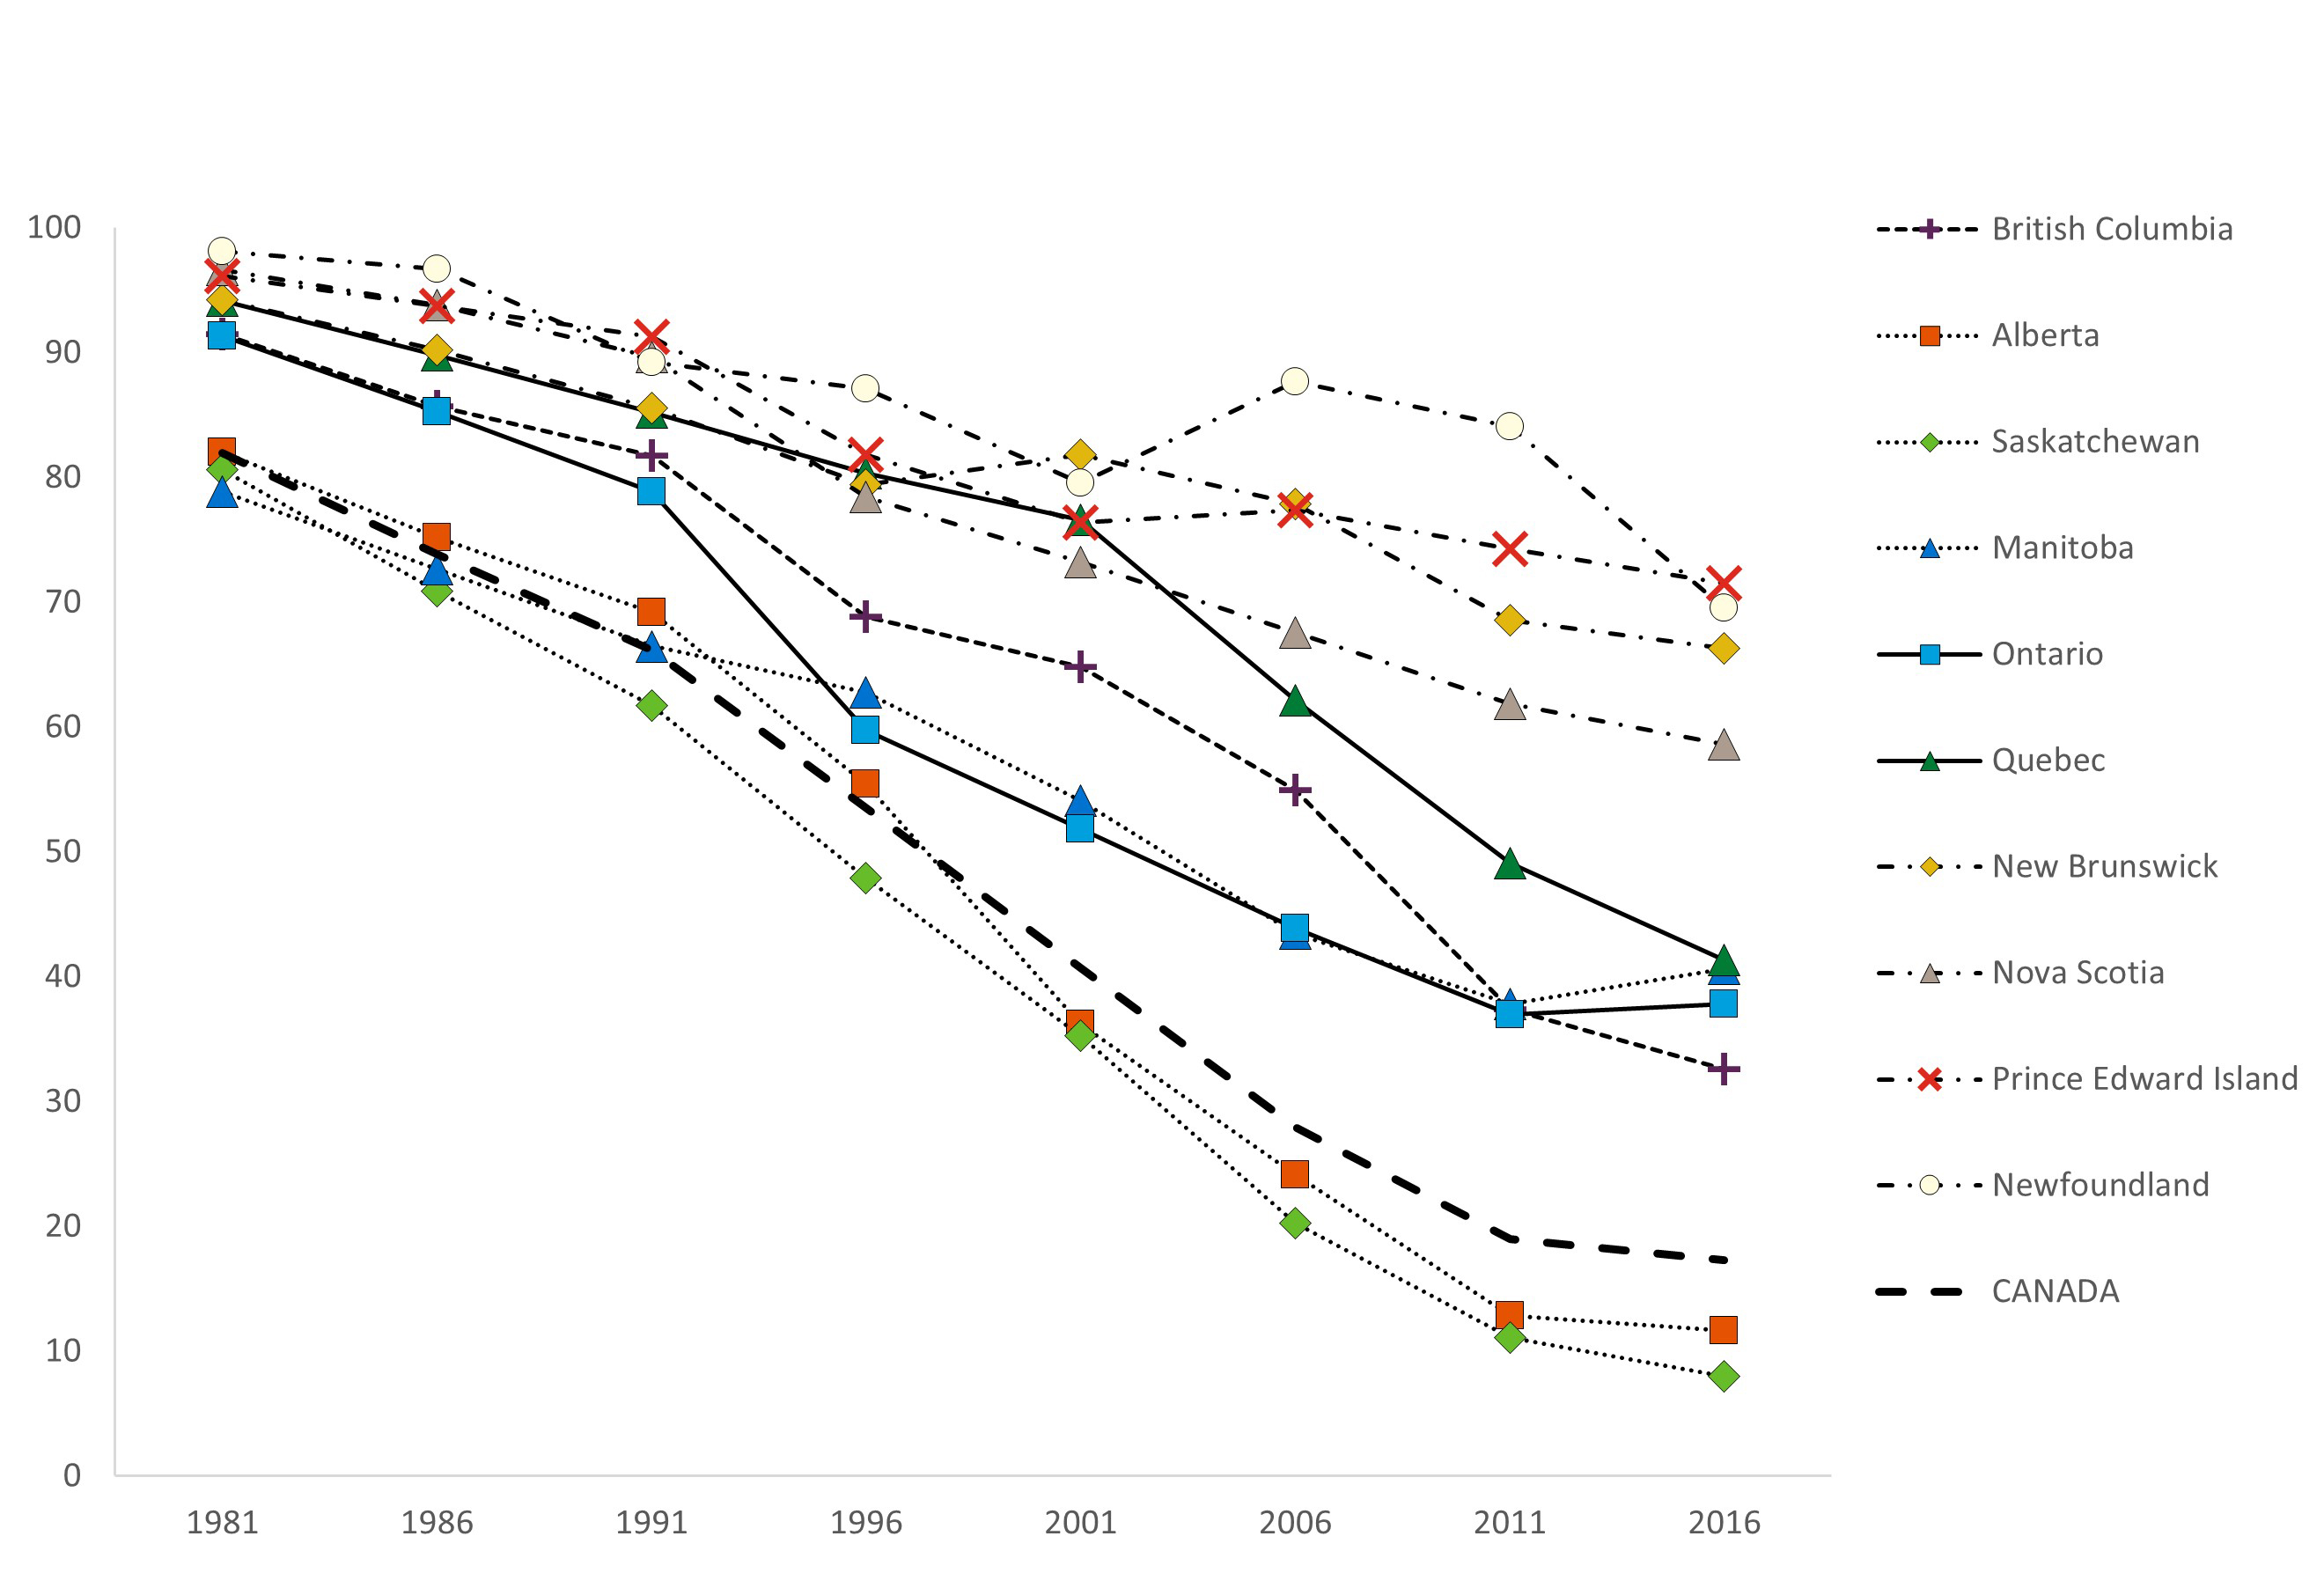
Description of figure 6a
| 1981 | 1986 | 1991 | 1996 | 2001 | 2006 | 2011 | 2016 | |
|---|---|---|---|---|---|---|---|---|
| British Columbia | 91.46 | 85.73 | 81.73 | 68.85 | 64.8 | 54.98 | 37.4 | 32.61 |
| Alberta | 82.02 | 75.22 | 69.2 | 55.46 | 36.17 | 24.15 | 12.82 | 11.62 |
| Saskatchewan | 80.64 | 70.89 | 61.73 | 47.89 | 35.27 | 20.26 | 11.12 | 7.98 |
| Manitoba | 78.87 | 72.63 | 66.48 | 62.76 | 54.1 | 43.46 | 37.85 | 40.63 |
| Ontario | 91.37 | 85.25 | 78.89 | 59.76 | 51.86 | 43.89 | 36.96 | 37.84 |
| Quebec | 94.19 | 89.77 | 85.19 | 80.31 | 76.62 | 62.17 | 49.13 | 41.37 |
| New Brunswick | 94.24 | 90.24 | 85.57 | 79.45 | 81.85 | 77.88 | 68.59 | 66.31 |
| Nova Scotia | 96.65 | 93.84 | 89.63 | 78.43 | 73.2 | 67.55 | 61.87 | 58.64 |
| Prince Edward Island | 96.14 | 93.76 | 91.25 | 81.84 | 76.4 | 77.38 | 74.26 | 71.51 |
| Newfoundland | 98.08 | 96.71 | 89.25 | 87.11 | 79.57 | 87.7 | 84.08 | 69.54 |
| Canada | 81.99 | 73.82 | 66.15 | 53.56 | 40.72 | 27.93 | 18.95 | 17.28 |
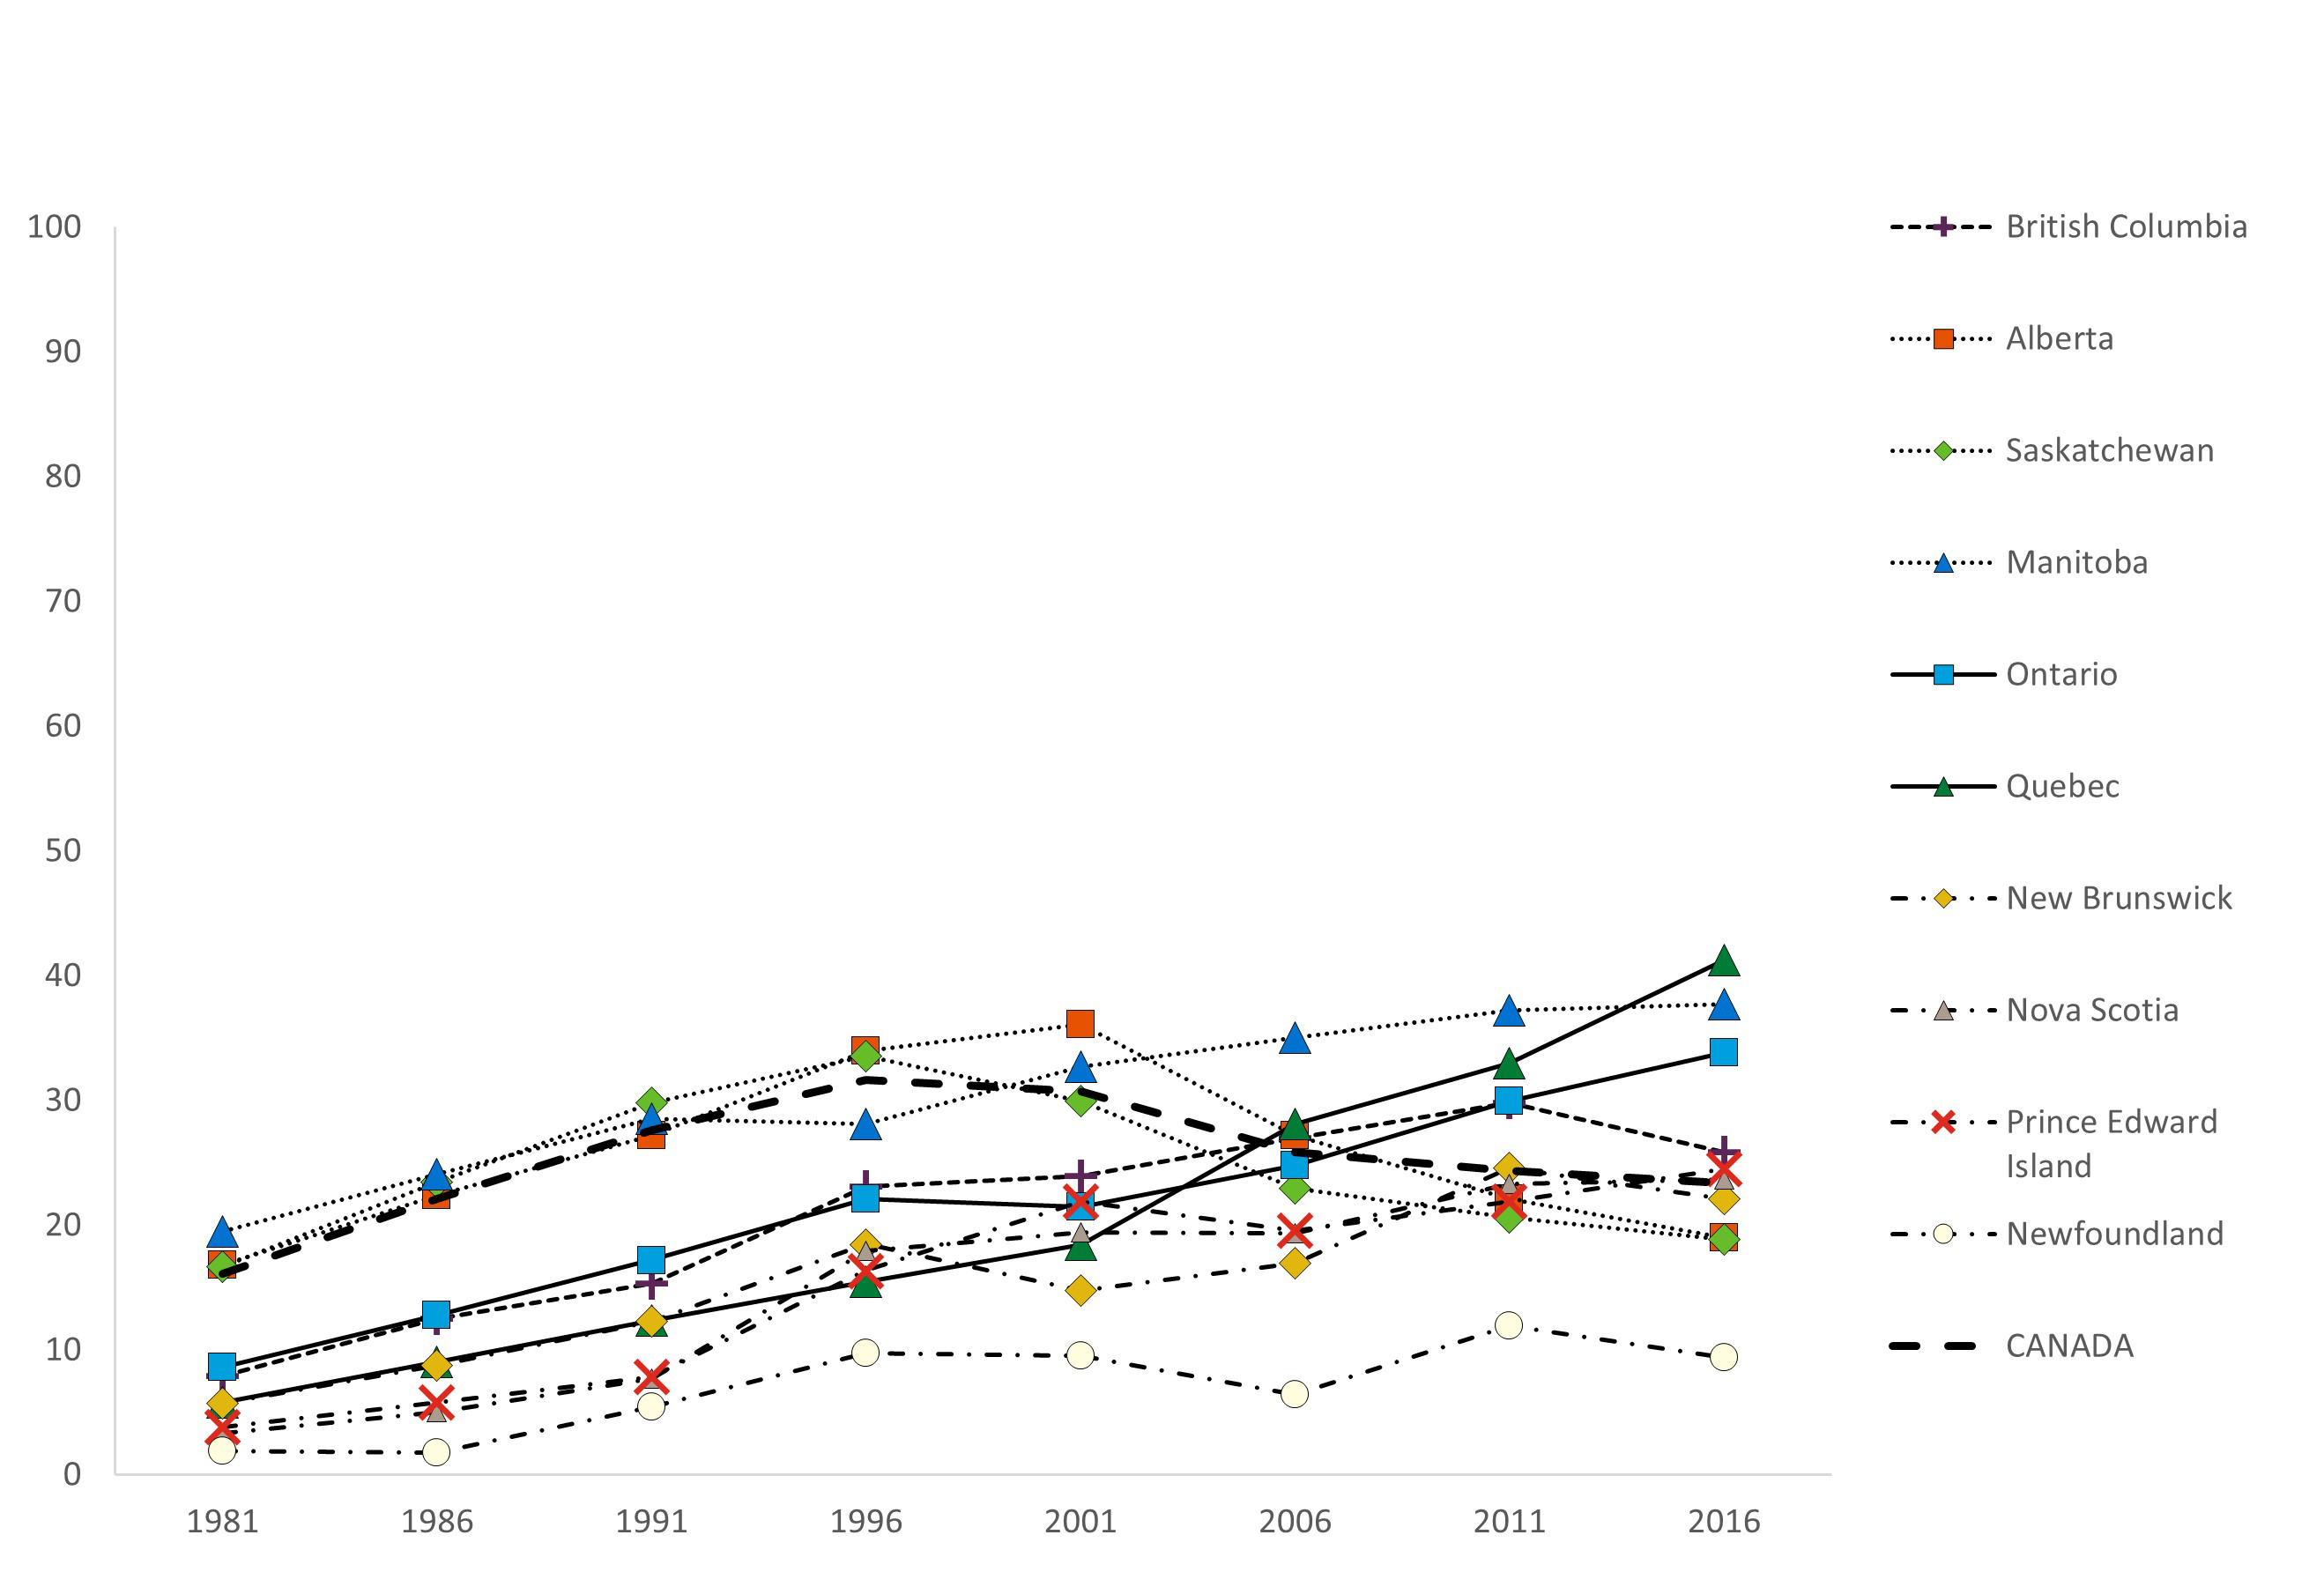
Description of figure 6b
| 1981 | 1986 | 1991 | 1996 | 2001 | 2006 | 2011 | 2016 | |
|---|---|---|---|---|---|---|---|---|
| British Columbia | 7.9 | 12.52 | 15.31 | 23.08 | 23.93 | 26.99 | 29.82 | 25.84 |
| Alberta | 16.79 | 22.38 | 27.21 | 34.01 | 36.11 | 27.22 | 22.1 | 18.99 |
| Saskatchewan | 16.65 | 23.47 | 29.83 | 33.56 | 29.93 | 22.99 | 20.62 | 18.89 |
| Manitoba | 19.52 | 24.12 | 28.52 | 28.1 | 32.73 | 35.03 | 37.2 | 37.74 |
| Ontario | 8.63 | 12.8 | 17.21 | 22.09 | 21.46 | 24.81 | 29.93 | 33.87 |
| Quebec | 5.81 | 9.05 | 12.38 | 15.47 | 18.47 | 28.12 | 32.98 | 41.26 |
| New Brunswick | 5.76 | 8.75 | 12.28 | 18.48 | 14.74 | 16.98 | 24.59 | 22.09 |
| Nova Scotia | 3.35 | 5.01 | 7.68 | 17.98 | 19.41 | 19.39 | 23.31 | 23.64 |
| Prince Edward Island | 3.86 | 5.79 | 7.84 | 16.36 | 21.89 | 19.58 | 21.89 | 24.49 |
| Newfoundland | 1.92 | 1.75 | 5.45 | 9.77 | 9.57 | 6.42 | 11.93 | 9.4 |
| Canada | 16.11 | 22.09 | 27.6 | 31.63 | 30.72 | 25.88 | 24.35 | 23.42 |

Description of figure 6c
| 1981 | 1986 | 1991 | 1996 | 2001 | 2006 | 2011 | 2016 | |
|---|---|---|---|---|---|---|---|---|
| British Columbia | 0.63 | 1.76 | 2.96 | 8.07 | 11.27 | 18.03 | 32.79 | 41.55 |
| Alberta | 1.2 | 2.4 | 3.59 | 10.53 | 27.72 | 48.63 | 65.08 | 69.38 |
| Saskatchewan | 2.7 | 5.64 | 8.44 | 18.55 | 34.8 | 56.75 | 68.26 | 73.14 |
| Manitoba | 1.61 | 3.25 | 4.99 | 9.14 | 13.17 | 21.51 | 24.94 | 21.63 |
| Ontario | 0 | 1.94 | 3.9 | 18.15 | 26.68 | 31.3 | 33.11 | 28.29 |
| Quebec | 0 | 1.18 | 2.43 | 4.22 | 4.92 | 9.71 | 17.89 | 17.37 |
| New Brunswick | 0 | 1.01 | 2.15 | 2.07 | 3.41 | 5.14 | 6.82 | 11.6 |
| Nova Scotia | 0 | 1.16 | 2.69 | 3.6 | 7.39 | 13.05 | 14.82 | 17.72 |
| Prince Edward Island | 0 | 0.45 | 0.92 | 1.8 | 1.71 | 3.05 | 3.85 | 3.99 |
| Newfoundland | 0 | 1.54 | 5.3 | 3.12 | 10.86 | 5.89 | 3.98 | 21.06 |
| Canada | 1.89 | 4.1 | 6.25 | 14.81 | 28.56 | 46.19 | 56.7 | 59.3 |
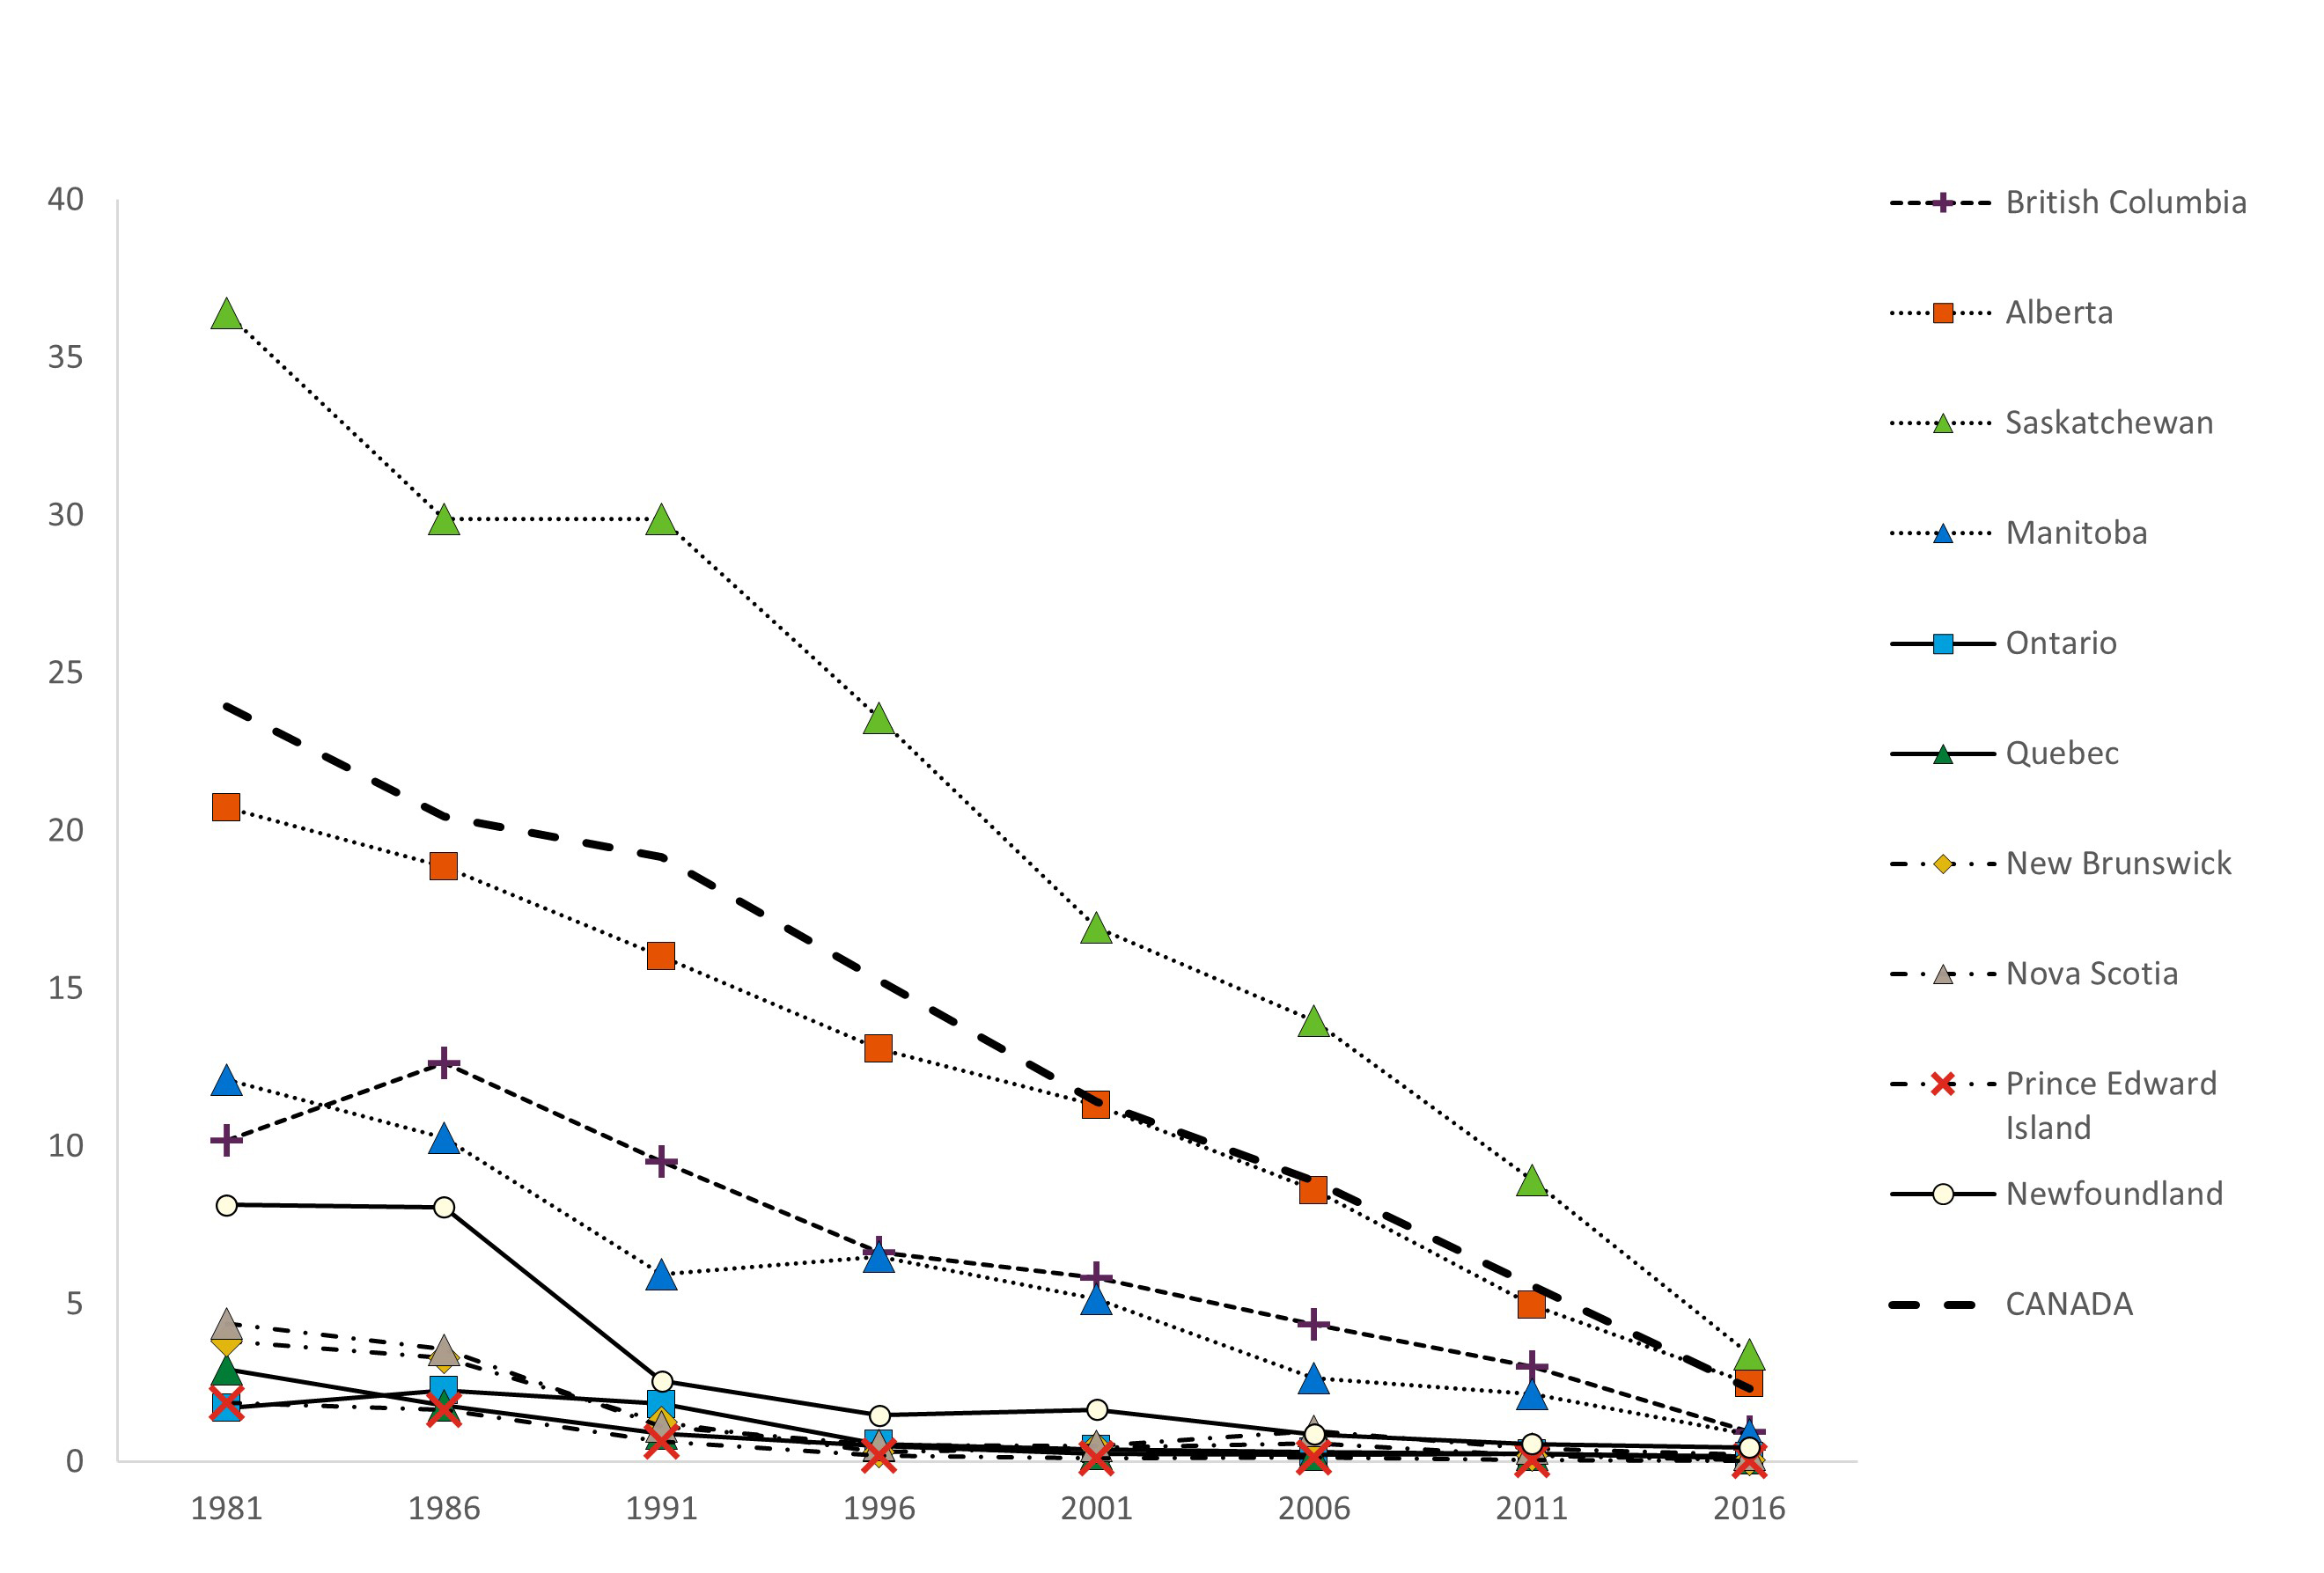
Description of figure 7
| 1981 | 1986 | 1991 | 1996 | 2001 | 2006 | 2011 | 2016 | |
|---|---|---|---|---|---|---|---|---|
| British Columbia | 10.18 | 12.64 | 9.52 | 6.63 | 5.84 | 4.35 | 3.02 | 0.96 |
| Alberta | 20.72 | 18.86 | 16.02 | 13.1 | 11.3 | 8.61 | 4.98 | 2.49 |
| Saskatchewan | 36.41 | 29.87 | 29.89 | 23.58 | 16.93 | 13.97 | 8.94 | 3.41 |
| Manitoba | 12.12 | 10.28 | 5.95 | 6.5 | 5.17 | 2.64 | 2.16 | 0.86 |
| Ontario | 1.71 | 2.27 | 1.83 | 0.55 | 0.39 | 0.32 | 0.26 | 0.18 |
| Quebec | 2.94 | 1.79 | 0.89 | 0.5 | 0.26 | 0.22 | 0.24 | 0.11 |
| New Brunswick | 3.82 | 3.29 | 1.25 | 0.31 | 0.44 | 0.58 | 0.21 | 0.05 |
| Nova Scotia | 4.37 | 3.56 | 1.11 | 0.52 | 0.51 | 0.97 | 0.41 | 0.22 |
| Prince Edward Island | 1.88 | 1.66 | 0.64 | 0.21 | 0.12 | 0.13 | 0.05 | 0.02 |
| Newfoundland | 8.14 | 8.07 | 2.56 | 1.47 | 1.65 | 0.88 | 0.57 | 0.45 |
| Canada | 23.93 | 20.46 | 19.18 | 15.25 | 11.42 | 8.91 | 5.58 | 2.31 |
Economic impact
Reductions in the productivity of historically eroded soils have a significant economic impact. A study was conducted to estimate these impacts, by combining SoilERI model results with a model of the response of soil organic carbon to soil loss, and a model of the response of crop yield to soil organic carbon content. The cost of soil erosion, simply in terms of lost crop yield (expressed in 2016 dollar values), increased from $1B per year in 1971 to $3B per year in 2011. This represents 7% of the total value of crop production in 1971 and 10% in 2011 (Badreldin and Lobb, 2019). Similar work in the corn-belt region of the mid-western United States estimated annual economic losses of $US2.8B due to tillage erosion (Thaler et al., 2021).
Though the annual erosion rate has been decreasing in Canada, the annual impact of erosion on productivity is cumulative, and thus the annual economic impact has continued to increase over time. This effect is compounded by market value increases and by the introduction of higher yielding varieties of crops. Annual economic losses will continue until the eroded soil is restored, and can be expected to continue to increase with each additional year of erosion.
Response options
An integrated approach is needed to reduce the combined effects of soil loss to sustainable levels by all forms of erosion. This is critical to maintaining soil health. While there are many practices that farmers can implement to reduce soil erosion, the appropriateness of a practice depends upon the type of the farming system, the climate and characteristics of the land, such as soil texture and whether the land is level or hilly. In general, all forms of soil erosion can be reduced by using less intensive tillage. This reduces the amount and extent of soil movement and, therefore, reduces tillage erosion. It also reduces the degree of incorporation of crop residue, an effective protection measure against the erosive forces of wind and water.
Water erosion
Water erosion can be controlled by improving the soil's structure and protecting the soil against the impact of rainfall and flowing water, and by managing the land to reduce the amount and erosiveness of flowing water. Management practices that aid in controlling water erosion include:
- using conservation tillage, including forages in rotations,
- planting row crops across the slope,
- strip cropping,
- inter-seeding row crops with other crops, and
- growing cover crops.
More research needs to be done on alternatives to no-till for areas where this practice is not viable, such as areas of intensive horticultural or potato production. Where water erosion is very high, conservation tillage and cropping systems might be inadequate to control erosion and run-off. In these areas alternative practices to control erosion include establishing terraces, or steps, to reduce slope steepness and length, establishing permanent small earthen berms or diversions running along the contours and converting back into perennial cover (for example, forages and trees) in the most sensitive areas. Addressing gully erosion usually requires engineering solutions such as constructing grassed waterways or, where grassed waterways would be inadequate, installing erosion control structures. In areas of higher precipitation and inherently greater risk of water erosion, low residue or high soil exposure crops such as potato, horticulture, and row crops (corn and soybean) are particularly prone to water erosion and need to be targeted for policy and conservation programs to reduce that risk.
Wind erosion
Wind erosion is most effectively controlled by keeping the soil covered with crops and crop residues in all areas of the country. In the Prairies, soils with surface textures of loamy sand and sand have the greatest inherent erosion risk and planting perennial forages is the most practical response option. For sandy loam soils in this region forages are also appropriate. If sandy loam soils are cropped to annual crops, complete no-till is necessary to achieve very low erosion risk. Windbreaks should also be considered for these soils. For other soil textures, conservation tillage or no-till are sensible ways to reduce erosion risk. Applying solid manure will also help control erosion.
Following potatoes and sugar beets, crop residue management is essential to protecting the soil. Planting a cover crop of spring or winter cereals can help control wind erosion, but on the prairies, where wind erosion is of greatest risk, the cover crop will consume valuable water needed for the primary crops. This leaves crop residue management, windbreaks and solid manure application the only viable solutions for wind erosion control where water availability is a limiting factor.
Tillage erosion
Tillage erosion is controlled by modifying tillage practices. Only by eliminating tillage can this form of erosion be completely stopped. Using no-till practices to grow crops or growing crops (such as forage) that require no tillage, are the most effective means of reducing tillage erosion. However, even no-till seeding and fertilizer injection can cause significant levels of soil disturbance and tillage erosion. Many cropping systems, such as potato production, will always entail some form of soil disturbance, leading to soil movement and tillage erosion. In these production systems, it is important to select tillage implements and carry out tillage operations in a way that minimizes tillage erosion. Implements that move less soil and move it over a shorter distance will generate less tillage erosion. Also, more uniform speed and depth of operation will lessen tillage erosion. In landscapes where contour tillage is practical, this approach may result in less tillage erosion than tilling up and down hillslopes, particularly if greater uniformity of tillage depth and speed can be achieved by tilling along the contours. With contour tillage, the rollover moldboard plough can be used as a conservation tool when the furrow is thrown upslope. The upslope movement of soil by the mold- board plough may offset the downslope movement by other tillage operations. Efforts to reduce tillage erosion should be focused on landscapes that are hilly and therefore more susceptible to such erosion.
Soil landscape restorations
Reducing or stopping soil erosion does not immediately restore soil health and productivity. The impact of erosion on the agricultural landscape is cumulative, so even a low annual rate of erosion, after years, can continue to reduce productivity. It can take decades to centuries to return a moderately to severely eroded soil to a productive and profitable state, because biomass accumulation (for example, crop residue, soil organic matter) is the driving process of soil restoration, and the eroded soils have reduced rates of biomass production precisely because they are eroded.
One practice that farmers use to quickly improve eroded soils is the collection of organic-rich topsoil from the base of the hills where it has accumulated through historical tillage erosion, and its placement on the upslope areas of severe soil loss. This practice is referred to as soil-landscape restoration, and it has great potential impacts on hilly lands that have been eroded by tillage erosion. A recent Farm Environmental Management Survey (FEMS) reports 6% of farmers surveyed across Canada use some form of this practice (Statistics Canada, 2019). Research into this practice has demonstrated dramatic improvements in Minnesota and the Dakotas, with yield increases of 20 — 50% and biomass production increases up to 95% (Schneider et al., 2021; Papiernik et al., 2009). Canadian research into this practice is ongoing.
Acknowledgments
Several individuals contributed to the production of this document. Bob MacMillan, Scott Smith, Walter Fraser, Tony Brierley and Alan Moulin contributed to the development of revised landform data within the National Soil Database (NSDB). Carolyn Baldwin, Murray Lewis, Phil Owens, Qiang Huang, and several others assisted with the validation of the wind erosion risk indicator model. Qiang Huang undertook the study of uncertainty analysis for the erosion indicators. Genevieve Ali, Carolyn Baldwin and Carolyn English carried out a case study on scaling the erosion indicator results from hillslopes to a watershed. We greatly appreciate Zisheng Xing, Nasem Badreldin, Fan-Rui Meng and Darrel Cerkowniak for their technical assistance in the indicator programming and analysis, as well as Nasem Badreldin and Marita Loro for their contribution to economic assessment of crop yield losses associated with soil erosion.
For more information
Soil Erosion Risk Indicator plain language summary
Related indicators
- The Soil Organic Matter Indicator tracks the health of Canadian agricultural soils as it relates to soil carbon content.
- The Soil Salinization Indicator examines salinization risk to Prairie soils.
- The Soil Cover Indicator assesses the number of days in a given that soils are protected by crops or snow.
Additional resources and downloads
Discover and download geospatial data related to this and other indicators
References
- Ali, G., C. Baldwin and C. English, 2013. Upscaling of soil erosion indicator models in a Canadian prairie watershed. A case study on the applicability of the NAHARP erosion indicator models at the watershed level – Final report. Ottawa, ON, Canada: Agriculture and Agri- Food Canada. 22 p.
- Badreldin, N., and D.A. Lobb, 2019. Assessment of the cost of soil erosion to crop production in Canada. Global Symposium on Soil Erosion. Food and Agriculture Organisation of the United Nations. UN-FAO. Rome, Italy, May 2019. Proceedings of the Global Symposium on Soil Erosion. UN-FAO. pp. 633-637.
- Baldwin, C. and D.A. Lobb, 2012. Field assessment of soil erosion and validation of WindERI. Technical supplement. Ottawa, ON, Canada: Agriculture and Agri-Food Canada.
- Huang, Q., and D.A. Lobb, 2013. Uncertainty analysis for the soil erosion risk indicators. Technical supplement. Ottawa, ON, Canada: Agriculture and Agri-Food Canada.
- Li, S., D.A. Lobb and B.G. McConkey, 2008. Soil erosion risk indicator (SoilERI) methodology in Soil erosion risk indicators: Technical supplement. Ottawa, ON, Canada: Agriculture and Agri-Food Canada.
- Li, S., and D.A. Lobb, 2009. Role of Topographic Data on the Accuracy and Uncertainty of NAHARP Indicators. Technical supplement. Ottawa, ON, Canada: Agriculture and Agri-Food Canada.
- Li, S., B.G. McConkey, M.W. Black, and D.A. Lobb, 2008. Water Erosion Risk Indicator (WatERI) Methodology in Soil erosion risk indicators: Technical supplement. Ottawa, ON, Canada: Agriculture and Agri-Food Canada.
- Lobb, D.A., S. Li, K.H.D. Tiessen, G.R. Mehuys, T.E. Schumacher, J.A. Schumacher, J. Mollinedo, D.J. Pennock, J. Liu and T. Yates, 2008. Tillage Erosion Risk Indicator (TillERI) Methodology in Soil erosion risk indicators: Technical supplement. Ottawa, ON, Canada: Agriculture and Agri-Food Canada.
- McConkey, B.G., S. Li and M.W. Black, 2008. Wind Erosion Risk Indicator (WindERI) Methodology in Soil erosion risk indicators: Technical supplement. Ottawa, ON, Canada: Agriculture and Agri- Food Canada.
- Papiernik, S.K., T.E. Schumacher, D.A. Lobb, M.J. Lindstrom, M.L. Lieser, A. Eynard, and J.A. Schumacher. 2009. Soil properties and productivity as affected by topsoil movement within an eroded landform. Soil Tillage Research, 102: 67-77.
- Schneider, S.K., C. Cavers, S. Duke, J.A. Schumacher, T.E. Schumacher, and D.A. Lobb. 2021. Crop responses to topsoil replacement within eroded landscapes. Agronomy J, 113: 2938-2949.
- Statistics Canada, 2019 Farm Environmental Management Survey, special tabulation.
- Thaler, E.A., I.J. Larsen and Q. Yu. 2021. The extent of soil loss across the US Corn Belt. PNAS 2021 Vol. 118 No. 8. 8 pages.