

Note: This report includes forecasting data that is based on baseline historical data.
Executive summary
In 2023, the Philippine's total population reached 114.9 million people, which has been increasing at a compound annual growth rate (CAGR) of 1.2% during the period of 2013 to 2023. The country consists of a rather young population having a median age of 26.3 years in 2023. With the middle youth (ages 30-34), predominantly being in the top income band, this may help to open opportunities for innovation, technology and societal shifts.
The Philippine population was evenly spread out between living in urban areas (54.4%) versus rural areas (45.6%) in 2023. The most populous urban cities were Quezon City, Manila, Davao City, Caloocan City, and Cebu. With ongoing development of infrastructure and the presence of a more favorable economic environment in the cities, the urban population is expected to grow faster between 2023 and 2033. However, 35.6% of the urban population still lived in slums in 2023, and social class E - making less than 50% of the average gross income (<US$2,184.1) - will remain the largest population cohort into 2033.
The overall economy in the Philippines grew rapidly in 2022 and urbanization, as well as, consumer income are forecast to grow. Despite, challenges of inflation and a gender gap pay, with a growing middle class, the economy has seen positive developments mainly driven by sustained remittance inflow from workers abroad, fast growing business outsourcing sector exports and a continued recovery of the tourism sector - all expected to support economic and, consequently, income growth in 2024 and beyond.
In 2023, the Philippines was the 23rd largest consumer market in the Asia-Pacific (APAC) region at a total consumer expenditure per capita (PCE) of US$2,865.6. Food and non-alcoholic beverages was the largest consumer spending category at a share of 37.3% in 2023, while leisure and recreation will record the fastest growth over 2023 to 2028.
Retail value sales of packaged food continue to grow steadily in the Philippines at total sales of US$17.2 billion in 2023, representing a CAGR of 7.7% (2018 to 2023). Health and wellness (HW) continues to gain traction among Filipino consumers to alleviate concerns around mental health and physical fitness. Total HW product sales were approximately US$4.5 billion in 2023. Over the year, the fortified functional (81.8%) category was the largest claim, followed by claims such as health benefit (14.5%), better for you (11.5%), natural (5.9%), dietary & free from (4.1%), and organic (0.8%) products.
Consumer landscape and lifestyles
Consumer lifestyles
In the Philippines, spending per household mainly consisted of expenditures of US$4,514 on food, housing (US$1,472), and non-essentials (US$6,240) in 2024. Albeit, consumers indicated that they continue to struggle with managing their household budgets, with 80% of respondents expressing concern that the cost of everyday items they buy is going up. The continued war in the Ukraine and conflict in Palestine have contributed to these concerns. Moreover, half of the global population is expected to vote in elections in 2024, and 24% of respondents have concerns about the future, whereby the associated political uncertainty could impact the global economy. Another important theme of concern is climate change, whereby consumers are conscious about making a difference through their choices and actions. Philippines (81%), including 83% of Gen Z consumers, said that they want to engage with brands to influence product innovation - only buying from brands they trust completely.Footnote 1
Consumers in the Philippines are shifting activities traditionally considered "away from the home" into their living spaces and are searching for the availability of at-home leisure activities such as working from home (38%), online or virtual fitness classes (17%), and shopping online (33%) in 2024. Filipinos are increasingly appreciating the convenience and efficiency that smart technology brings to their homes, as well. Furthermore, the continued adoption of hybrid working policies have introduced new employment expectations where 54% (61% of older cohorts like Gen X) find that working from home is important with 39% also, saying that they expect to be able to have flexible start/finish times in the future. 42% of today's workers say it is important to have a job that allows for a strong work-life balance, where ~40% both say they expect to start their own company and/or be self-employed; 30% expect to work on a contract or freelance basis in the future, with 22% expecting to have more than one job.Footnote 1
Steady growth in consumer spending
Consumer expenditure has grown steadily over the last five years, despite the fluctuation in consumer confidence, while withstanding the recent impact of international and internal economic and political events. Sustained remittance inflows from workers abroad, fast-growing business outsourcing sector exports and the continued recovery of the tourism sector are all expected to support economic and, consequently, income growth in 2024 and beyond - at a growth rate predicted to outpace the average for the Asia Pacific (APAC) region. With a general younger population, the middle youth (ages 30-34) are predominantly in the top income band, where the fastest growing category is the middle class members (social class C), yet social class E (making <50% of avgerage gross salary) remain the largest category of workers in the Philippines. This middle youth, who are characterized as digital natives with concerns about sustainability, brand ethics, and with a reliance on connectivity, are predicted to dominate the income band as they move towards the 35-39 age consumer group that will also, present new opportunities for businessed focusing on premium goods and services.Footnote 1
In 2023, the Philippines was the 25th largest importer (US$19.4 billion) compared to Canada (11th) of agri-food and seafood products in the world. Nevertheless, with an agri-food trade deficit of approximately US$13.0 billion (exports: US$6.4 billion) in 2023, the country is most highly dependent on cereals, prepared animal fodder, miscellaneous edible food preparations, meat and edible meat offal products, and dairy produce. Last year, Canada exported many of these highly dependent commodities to the Philippines including meat and edible meat offal at exports of US$240.7 million (including fresh pork, frozen/fresh beef and edible offal of bovine/fowls, pig fat), cereals at US$156.9 million (including non-durum wheat, canary seed, quinoa, oats, maize), prepared animal fodder at US$26.5 million, miscellaneous edible food preparations at US$19.0 million (soups/broths, sauces - mustard, ketchup, ice cream, extracts of tea or mate), edible vegetables and certain roots at US$18.2 million (dried peas/chickpeas/kidney beans, fresh potatoes), and dairy produce at US$10.3 million (whey, milk and cream, eggs, cheese and curd).Footnote 2
Key demographic indicators
In 2023, Philippine's total population was 114.9 million people, representing a CAGR of 1.2% (2013 to 2023). Philippine's total population is expected to slightly slow down between 2023 and 2033 with a CAGR of 0.8% to reach approximately 124.0 million by 2033. The Philippines is the 7th most populous country in the APAC region, with the largest populations in the region being India, China, Indonesia, Pakistan, Bangladesh, and Japan.
The Philippine population are evenly spread out between living in urban areas (54.4%) and living in rural areas (45.6%) in 2023. With ongoing development of infrastructure and the presence of a more favorable economic environment in the cities, the urban population is expected to grow faster by a CAGR of 1.5% over the rural population that will decline by 0.2% (2023 to 2033). Over the last year, however, 35.6% of the urban population lived in slums. The most populous urban cities in the Philippines were Quezon City at 3.1 million people, followed by Manila (1.9 million), Davao City (1.8 million), Caloocan City (1.7 million), and Cebu (1 million) in 2023.
| Category | 2013 | 2018 | 2023 | CAGR* % 2013-2023 | 2024 | 2033 | CAGR* % 2023-2033 |
|---|---|---|---|---|---|---|---|
| Total - population('000) | 102,076.3 | 109,465.3 | 114,891.2 | 1.2 | 115,843.7 | 124,049.0 | 0.8 |
| Urban population ('000) | 48,914.4 | 56,413.2 | 62,489.3 | 2.5 | 63,580.0 | 72,472.8 | 1.5 |
| Urban population | 47.9 | 51.5 | 54.4 | 1.3 | 54.9 | 58.4 | 0.7 |
| Rural population ('000) | 53,161.9 | 53,052.1 | 52,401.9 | −0.1 | 52,263.7 | 51,576.2 | −0.2 |
| Rural population | 52.1 | 48.5 | 45.6 | −1.3 | 45.1 | 41.6 | −0.9 |
| Population density (persons per km2) | 342.3 | 367.1 | 385.3 | 1.2 | 388.5 | 416.0 | 0.8 |
| Urban population living in slums | 40.8 | 37.3 | 35.6 | −1.4 | |||
Source: Euromonitor International, 2024 *CAGR: Compound Annual Growth Rate |
|||||||
| City | 2013 | 2018 | 2023 | CAGR* % 2013-2023 | 2024 | 2033 | CAGR* % 2023-2033 |
|---|---|---|---|---|---|---|---|
| Quezon City | 2,948.2 | 3,035.9 | 3,069.9 | 0.4 | 3,087.7 | 3,328.5 | 0.8 |
| Manila | 1,768.7 | 1,871.3 | 1,943.9 | 0.9 | 1,962.5 | 2,154.8 | 1.0 |
| Davao City | 1,595.6 | 1,766.2 | 1,920.1 | 1.9 | 1,950.8 | 2,209.6 | 1.4 |
| Caloocan City | 1,585.2 | 1,674.4 | 1,765.9 | 1.1 | 1,786.8 | 1,983.3 | 1.2 |
| Cebu | 921.9 | 973.5 | 1,018.4 | 1.0 | 1,028.7 | 1,131.8 | 1.1 |
| Antipolo | 753.8 | 863.4 | 981.6 | 2.7 | 1,002.9 | 1,167.2 | 1.7 |
| Taguig | 757.6 | 880.6 | 958.0 | 2.4 | 973.3 | 1,102.1 | 1.4 |
| Pasig | 739.7 | 806.6 | 855.1 | 1.5 | 865.7 | 963.1 | 1.2 |
| Valenzuela | 612.6 | 691.2 | 788.7 | 2.6 | 805.3 | 934.8 | 1.7 |
| Cagayan de Oro | 662.4 | 726.8 | 781.6 | 1.7 | 792.8 | 890.5 | 1.3 |
| Total - top 10 cities | 12,345.7 | 13,289.9 | 14,083.2 | 1.3 | 14,256.5 | 15,865.7 | 1.2 |
| % in top 10 urban cities | 25.2 | 23.6 | 22.5 | −1.1 | 22.4 | 21.9 | −0.3 |
Source: Euromonitor International, 2024 *CAGR: Compound Annual Growth Rate |
|||||||
In 2023, the Filipino population comprised primarily of young individuals with the largest cohorts being the Generation Z (ages 9-24) group at 28.2% and the Generation Alpha (ages under 11) group at 26.6%; followed by Millennials (25 to 40) at 21.7%, the Generation X (ages 41 to 56) group at 14.3%, Boomers (ages 57 to 75) at 8.4%, and the Silent Generation (ages 76-93) group at 0.8%. With the country having a younger population that have been immersed in and raised alongside technology, it is believed that this will set the country up into a leading position for digital advancement.Footnote 3
| Category | 2013 | 2018 | 2023 | CAGR* % 2013-2023 | 2024 | 2033 | CAGR* % 2023-2033 |
|---|---|---|---|---|---|---|---|
| Generation Alpha (2010~2024, ages under 11) | 9,907.9 | 21,090.3 | 30,529.4 | 11.9 | 32,283.4 | 31,801.8 | 0.4 |
| Generation Z (1997~2012, ages 9 to 24) | 33,807.0 | 32,986.4 | 32,399.6 | −0.4 | 32,284.8 | 31,346.1 | −0.3 |
| Millennials (1981~1996, ages 25 to 40) | 26,558.9 | 25,605.5 | 24,953.9 | −0.6 | 24,847.8 | 23,878.4 | −0.4 |
| Generation X (1965~1980, ages 41 to 56) | 17,241.4 | 16,978.6 | 16,403.9 | −0.5 | 16,252.7 | 14,469.1 | −1.2 |
| Boomers (1946~1964, ages 57 to 75) | 11,931.6 | 11,078.5 | 9,702.2 | −2.0 | 9,389.7 | 6,064.5 | −4.6 |
| Silent Generation (1928~1945, ages 76 to 93) | 2,578.7 | 1,700.0 | 897.9 | −10.0 | 785.2 | 136.9 | −17.1 |
| Total population | 102,076.3 | 109,465.3 | 114,891.2 | 1.2 | 115,843.7 | 124,049.0 | 0.8 |
Source: Euromonitor International from national statistics/UN, 2024 *CAGR: Compound Annual Growth Rate |
|||||||
In 2023, the male-to-female population was distributed almost evenly with slightly more females (57.6 million) over males (57.3 million). The median age in the Philippines for females was 26.8 and for males was 25.8 years. By 2033, the median age of the total population is expected to increase at a CAGR of 1.5% to reach 30.4 years from 26.3 years in 2023, while the population is expected to grow at a CAGR of 0.8% between 2023 and 2033.
From 2013 to 2023, later lifers (aged 65-79) grew the most at a CAGR of 5.7% with the amount of babies/infants (aged 0-2) having declined the most at a CAGR of 3.2%. Between 2023 and 2033, seniors (aged 80+) are expected to grow at the highest rate (CAGR: 6.2%) with the amount of kids, tweens, and teens (aged 3-17) expected to register declines over the same period.
| Category | 2013 | 2018 | 2023 | CAGR* % 2013-2023 | 2024 | 2033 | CAGR* % 2023-2033 |
|---|---|---|---|---|---|---|---|
| Total - female population | 50,832.0 | 54,755.0 | 57,580.4 | 1.3 | 58,059.6 | 62,249.5 | 0.8 |
| Median age (yrs) - female | 23.4 | 24.8 | 26.8 | 1.4 | 27.2 | 31.2 | 1.5 |
| Total - male population | 51,244.3 | 54,710.3 | 57,310.8 | 1.1 | 57,784.1 | 61,799.6 | 0.8 |
| Median age (yrs) - male | 21.9 | 23.8 | 25.8 | 1.7 | 26.2 | 29.7 | 1.4 |
| Babies/Infants (aged 0 to 2) | 7,431.8 | 6,861.9 | 5,390.8 | −3.2 | 5,366.0 | 5,558.4 | 0.3 |
| Kids (aged 3 to 12) | 12,003.5 | 11,847.4 | 11,083.3 | −0.8 | 10,570.5 | 9,022.2 | −2.0 |
| Tweens (aged 8 to 12) | 11,325.8 | 11,637.5 | 11,712.2 | 0.3 | 11,641.3 | 8,824.3 | −2.8 |
| Teens (aged 13 to 17) | 10,851.5 | 11,042.5 | 11,466.8 | 0.6 | 11,594.2 | 10,960.4 | −0.5 |
| Young Adults (aged 18 to 29) | 22,684.7 | 24,192.3 | 25,237.0 | 1.1 | 25,396.2 | 26,825.7 | 0.6 |
| Middle Youth (aged 30 to 44) | 19,130.4 | 21,648.5 | 24,343.6 | 2.4 | 24,847.8 | 29,163.1 | 1.8 |
| Mid-Lifers (aged 45 to 64) | 15,065.9 | 17,512.9 | 19,611.8 | 2.7 | 20,065.6 | 24,447.5 | 2.2 |
| Later Lifers (aged 65 to 79) | 3,098.1 | 4,133.7 | 5,416.3 | 5.7 | 5,710.8 | 8,100.5 | 4.1 |
| Seniors (aged 80+) | 484.6 | 588.8 | 629.5 | 2.7 | 651.2 | 1,146.9 | 6.2 |
| Total - population | 102,076.3 | 109,465.3 | 114,891.2 | 1.2 | 115,843.7 | 124,049.0 | 0.8 |
| Median age of population (yrs) | 22.6 | 24.3 | 26.3 | 1.5 | 26.7 | 30.4 | 1.5 |
Source: Euromonitor International, 2024 *CAGR: Compound Annual Growth Rate |
|||||||
The Philippine population consisted of 99.8% Filipino citizens, whereby 99.9% speak the Filipino language in 2023. The most popular religion in the Philippine's is Christianity (Roman Catholics), representing 75.9% of the population in 2023. With little change over the last 6 years, Islam religion consisted of 6.0% and 18.2% of the Philippean population that followed other religious beliefs over last year.
| Type | 2018 | 2019 | 2020 | 2021 | 2022 | 2023 |
|---|---|---|---|---|---|---|
| Christianity: Roman Catholics | 77.0 | 76.6 | 76.3 | 76.1 | 75.9 | 75.8 |
| Islam | 6.0 | 6.0 | 6.0 | 6.0 | 6.0 | 6.0 |
| Other religions | 17.0 | 17.4 | 17.7 | 17.9 | 18.1 | 18.2 |
Source: Euromonitor International from national statistics/UN, 2024 *CAGR: Compound Annual Growth Rate |
||||||
The Philippine's vital/health statistics
In 2023, in the Philippines the life expectancy at birth is approximately 70 years of age. Over the year, 78.6% of females and 65.6% of males have survived beyond the age of 65. By 2033, life expectancy is forecast to increase by a CAGR of 0.1% to reach 71.1 years of age, with 80.9% of females and 67.4% of males expected to continue to survive beyond the age of 65.
The average age of a woman at their first childbirth in the Philippines has been approximately 23 years, which has remained stable over the last decade and is expected to continue as such in the next ten years (2023 to 2033). The fertility rate was 1.9 born per female with 1.8 million live births in the country in 2023, which is equivalent to a birth rate of 16.0 per thousand in the population of children born over the year. The Philippine's fertility rate is declining by a CAGR of 2.5% from 2013 through to 2033, with birth rates decreasing gradually down to 15.3 births per thousand people and a slightly lower fertility rate of 1.8 born per female by 2033. With the Filipino population being young, combined with a negative net migration rate of 164.3 thousand in 2023, poverty is forcing consumers to look for jobs abroad.Footnote 3
| Category | 2013 | 2018 | 2023 | 2028 | 2033 | CAGR* % 2013-2033 |
|---|---|---|---|---|---|---|
| Life expectancy at birth (years) | 69.3 | 69.8 | 69.8 | 70.4 | 71.1 | 0.1 |
| Survival to age 65 - male (% of cohort) | 63.5 | 65.0 | 65.6 | 66.3 | 67.4 | 0.3 |
| Survival to age 65 - female (% of cohort) | 77.5 | 78.5 | 78.6 | 79.7 | 80.9 | 0.2 |
| Average age of women at first childbirth (years) | 23.2 | 23.3 | 23.3 | 23.2 | 23.2 | 0.0 |
| Birth rates (per '000 population) | 24.6 | 19.4 | 16.0 | 15.6 | 15.3 | −2.3 |
| Fertility rates (children born per female) | 3.0 | 2.4 | 1.9 | 1.8 | 1.8 | −2.5 |
| Live births ('000) | 2,507.0 | 2,125.6 | 1,840.5 | 1,869.5 | 1,902.4 | −1.4 |
| Infant mortality rates (per '000 live births) | 8.8 | 9.9 | 10.9 | 9.6 | 8.6 | −0.1 |
| Death rates (per '000 population) | 5.5 | 5.8 | 6.2 | 6.8 | 7.5 | 1.6 |
| Deaths ('000) | 562.2 | 629.7 | 716.5 | 817.0 | 925.3 | 2.5 |
| Infant deaths ('000) | 22.0 | 21.0 | 20.0 | 17.9 | 16.3 | −1.5 |
| Net migration ('000) | −218.4 | −163.6 | −164.3 | −127.5 | −113.9 | −3.2 |
| Net migration rates (per '000 population) | −2.1 | −1.5 | −1.4 | −1.1 | −0.9 | −4.1 |
| Refugees and asylum seekers (number) | 246.0 | 869.0 | 1,787.0 | 20.3 | ||
| Natural change ('000) | 1,944.7 | 1,495.9 | 1,124.0 | 1,052.5 | 977.1 | −3.4 |
| Rate of natural change (per '000 population) | 19.1 | 13.7 | 9.8 | 8.8 | 7.9 | −4.3 |
| Foreign Citizens ('000) | 192.8 | 202.4 | 209.7 | 216.7 | 223.8 | 0.7 |
Source: Euromonitor International from national statistics/UN/Eurostat/World Bank, 2024 *CAGR: Compound Annual Growth Rate |
||||||
| Category | 2013 | 2018 | 2023 | 2028 | 2033 |
|---|---|---|---|---|---|
| Allergy prevalence (% of population) | 13.2 | 14.0 | 15.7 | 17.9 | 19.9 |
| Breastfeeding of Infants (% of population) | 43.1 | 54.9 | 62.0 | ||
| Dental health (average number of DMFT[1] at age 12) | 3.5 | 3.8 | 4.0 | ||
| Diabetes prevalence (% of population aged 20 to 79) | 9.2 | 7.2 | 7.3 | 7.6 | 8.1 |
| High blood glucose prevalence (% aged 18+) | 7.2 | 7.7 | 8.0 | ||
| High blood pressure prevalence (% aged 18+) | 22.2 | 21.8 | 21.7 | ||
| Prevalence of insufficient physical activity among adults (% aged 18+) | 15.7 | 15.7 | 15.8 | ||
| Raised cholesterol prevalence (% aged 25+) | 44.3 | 45.2 | 45.6 | ||
| Mean BMI[2] (kg/m2) score | 22.9 | 23.4 | 24.2 | 25.0 | 25.9 |
| Prevalence of undernourishment (% of population) | 11.2 | 5.4 | 5.3 | ||
| Obese population (BMI 30kg/m2 or more) (% aged 18+) | 5.9 | 7.3 | 9.1 | 10.7 | 12.2 |
| Overweight population (BMI 25 to 30kg/m2) (% aged 18+) | 21.5 | 23.9 | 26.3 | 28.7 | 31.1 |
| DTP 1 and 2 Vaccination Rate (%) | 90.0 | 78.0 | 73.5 | ||
| MMR Vaccination Rate (%) | 83.0 | 77.0 | 68.5 | ||
| Polio Vaccination Rate (%) | 85.0 | 79.0 | 72.6 | ||
| Incidence of AIDS or HIV (number) | 4,814.0 | 6,051.0 | 7,088.0 | ||
| Diphtheria Incidence (number) | 6.0 | 183.0 | |||
| Measles Incidence (number) | 2,920.0 | 20,827.0 | |||
| Vegetarian population ('000) | 3,297.1 | 3,713.2 | 4,124.3 | ||
| Vegetarian (% of population) | 3.2 | 3.4 | 3.6 | ||
Source: Euromonitor International from WHO/OECD, EVANA, Diabetes Federation, World Allergy Organisation etc. 2021 1: Decayed, missing and filled teeth index measure 2: Body Mass Index |
|||||
Household structure in the Philippines
In 2023, the total number of households in the Philippines was 28.4 million that were located within 56% urban and 44% rural areas throughout the country. The majority of Philippeans live in a house (25.8 million) accounting for a total share of 91.1%, followed by 8.1% of households living in an apartment (2.3 million), and 0.8% living in other types of households (230.8 million) in 2023. Notably, 83.7% of Philippeans living in a house are home owners, whereby most own their house without a mortgage (92%) - with 8% of home owners that have a mortgage. Meanwhile, 10.4% of households living in a home or an apartment are renters, leaving 5.8% of other forms of tenancy living under other occupancy agreements.
| Type | 2013 | 2018 | 2023 | 2028 | 2033 | CAGR* % 2013-2033 |
|---|---|---|---|---|---|---|
| Urban households ('000) | 10,947.1 | 13,525.2 | 15,884.5 | 18,159.6 | 20,471.1 | 3.2 |
| Urban households (%) | 50.1 | 54.3 | 56.0 | 57.7 | 59.8 | 0.9 |
| Rural households ('000) | 10,903.2 | 11,384.1 | 12,477.4 | 13,290.5 | 13,736.4 | 1.2 |
| Rural households (%) | 49.9 | 45.7 | 44.0 | 42.3 | 40.2 | −1.1 |
| Total - number of households ('000) | 21,850.3 | 24,909.4 | 28,362.0 | 31,450.1 | 34,207.5 | 2.3 |
Source: Euromonitor International from national statistics/UN, 2024 *CAGR: Compound Annual Growth Rate |
||||||
| Type | 2013 | 2018 | 2023 | 2028 | 2033 | CAGR* % 2013-2033 |
|---|---|---|---|---|---|---|
| Total - households ('000) | 21,850.3 | 24,909.4 | 28,362.0 | 31,450.1 | 34,207.5 | 2.3 |
| Households in a house ('000) | 19,094.9 | 22,315.2 | 25,828.7 | 28,805.2 | 31,394.0 | 2.5 |
| Households in an apartment ('000) | 2,658.4 | 2,439.5 | 2,302.5 | 2,358.6 | 2,488.5 | −0.3 |
| Households - other ('000) | 97.0 | 154.7 | 230.8 | 286.3 | 324.9 | 6.2 |
| Total - home owners ('000) | 14,758.4 | 19,507.8 | 23,752.1 | 26,499.0 | 28,835.3 | 3.4 |
| Owner without mortgage ('000) | 12,417.0 | 16,047.9 | 19,186.6 | 21,011.9 | 22,436.1 | 3.0 |
| Owner with mortgage ('000) | 2,341.4 | 3,459.8 | 4,565.5 | 5,487.1 | 6,399.3 | 5.2 |
| Renters ('000) | 2,636.0 | 2,810.4 | 2,951.2 | 3,265.9 | 3,564.1 | 1.5 |
| Other - households by tenure ('000) | 4,455.9 | 2,591.2 | 1,658.7 | 1,685.2 | 1,808.1 | −4.4 |
Source: Euromonitor International from national statistics/UN, 2024 *CAGR: Compound Annual Growth Rate |
||||||
In the Philippines, the average household size was 4.1 persons in 2023. Over the year, couples with children was the largest type of household (15.9 million), followed by households with other blended families (3.9 million), single persons (3.14 million), couples without children (3.13 million), and single-parent family households (2.3 million). Based on historic and forecast previsions (2013 to 2023), it is expected that the average household size will decrease by a CAGR of 1.3%; declining to a size of 3.6 persons by 2033. Single person households and couples without children are forecast to increase the most at CAGRs of 6.0% and 2.7%, respectively over the same period. Overall the number of households without children is expected to increase to a share of 47.8% by 2033, which will be the cohort increasing the most over this period by a CAGR of 4.3% to reach 16.3 million households. By 2033, the number of children per household is supposed to decline the most amongst households with four children from a total share of 15% in 2023 to 12.6% in 2033 (CAGR 2013-2033: −2.5%) - whereby the total number of children per household is expected to follow the trend close behind to also decline, for households with three down to one children.
| Type | 2013 | 2018 | 2023 | 2028 | 2033 | CAGR* % 2013-2033 |
|---|---|---|---|---|---|---|
| Average household size (number) | 4.7 | 4.4 | 4.1 | 3.8 | 3.6 | −1.3 |
| Single person ('000) | 1,590.6 | 2,209.2 | 3,140.3 | 4,113.7 | 5,097.8 | 6.0 |
| Couple without children ('000) | 2,239.6 | 2,686.2 | 3,137.4 | 3,507.6 | 3,799.6 | 2.7 |
| Couple with children ('000) | 13,004.3 | 14,390.6 | 15,850.0 | 17,086.2 | 18,139.9 | 1.7 |
| Single-parent family ('000) | 1,838.3 | 2,064.7 | 2,291.1 | 2,479.0 | 2,636.8 | 1.8 |
| Other[1] blended family ('000) | 3,177.6 | 3,558.7 | 3,943.2 | 4,263.5 | 4,533.3 | 1.8 |
| Total - households ('000) | 21,850.3 | 24,909.4 | 28,362.0 | 31,450.1 | 34,207.5 | 2.3 |
Source: Euromonitor International from national statistics/UN, 2024 *CAGR: Compound Annual Growth Rate 1: Couples with children and extended families |
||||||
| Type | 2013 | 2018 | 2023 | 2028 | 2033 | CAGR* % 2013-2033 |
|---|---|---|---|---|---|---|
| Average number of children per household | 1.9 | 1.7 | 1.4 | 1.2 | 1.0 | −3.2 |
| Households without children ('000) | 7,002.2 | 8,917.0 | 11,326.2 | 13,747.5 | 16,341.5 | 4.3 |
| Households without children (%) | 32.0 | 35.8 | 39.9 | 43.7 | 47.8 | 2.0 |
| Households with 1 child ('000) | 6,145.9 | 7,044.3 | 7,807.6 | 8,363.4 | 8,345.3 | 1.5 |
| Households with 1 child (%) | 28.1 | 28.3 | 27.5 | 26.6 | 24.4 | −0.7 |
| Households with 2 children ('000) | 2,480.0 | 2,823.4 | 3,054.0 | 3,188.3 | 3,276.3 | 1.4 |
| Households with 2 children (%) | 11.3 | 11.3 | 10.8 | 10.1 | 9.6 | −0.8 |
| Households with 3 children ('000) | 1,666.6 | 1,828.9 | 1,912.2 | 1,937.7 | 1,951.0 | 0.8 |
| Households with 3 children (%) | 7.6 | 7.3 | 6.7 | 6.2 | 5.7 | −1.4 |
| Households with 4 or more children ('000) | 4,555.7 | 4,295.8 | 4,261.9 | 4,213.1 | 4,293.4 | −0.3 |
| Households with 4 or more children (%) | 20.8 | 17.2 | 15.0 | 13.4 | 12.6 | −2.5 |
| Total - number of households ('000) | 21,850.3 | 24,909.4 | 28,362.0 | 31,450.1 | 34,207.5 | 2.3 |
Source: Euromonitor International from national statistics/UN, 2024 *CAGR: Compound Annual Growth Rate |
||||||
Business environment and economic indicators
The economy in the Philippines grew rapidly in 2022 and urbanization, as well as, consumer income are forecast to grow. The economy has seen positive developments driven by tourism and remittances. Nevertheless, the Philippines faces challenges of inflation and a gender pay gap. Economic turbulence and rising costs of living are making consumers doubt their financial security. Generally, a younger overall population in the Philippines poses both risks of future economic uncertainties, yet can open opportunities for innovation, technology and societal shifts. Economic uncertainties and soaring inflation are rising the cost of living and reshaping economic structures as the bottom of the pyramid grows, and consumer confidence dwindles and inequality expands. The wealthy population continues to accumulate among the cohort between 30-40 years of age.Footnote 3
In the Philippines, gross domestic product (GDP) reached US$437.2 trillion in 2023. The economy spiked from a real GDP growth of 5.7% in 2021 to 7.6% in 2022, then dropped back down to 5.5% in 2023. Between 2018 and 2023, real GDP growth declined by a CAGR of −2.6% and is expected to turn around to grow by a CAGR of +2.6% (2023 to 2028).
Overall, the Philippines ranked 80th out of 184 countries in the Index of Economic Freedom (IEF) ranking in 2022. The country struggles the most with monetary freedom and judicial effectiveness, leading to a decline in its tax burden ranking. Despite, the country's flexible business regulations, convenient location and financial sector improvements leading to an increase in the country's foreign direct investments (FDI), the Philippines face major issues on tax burden as a percentage of GDP and poor infrastructure - which government is taking steps to address through the Corporate Recovery and Tax Incentives for Enterprises (CREATE) Act passed in April 2021 (reducing the corporate income tax rate from 30% to 20% by 2025).Footnote 4
| Category | 2013 | 2018 | 2023 | CAGR* % 2018-2023 | 2028 | 2033 |
|---|---|---|---|---|---|---|
| Gross domestic product (GDP) in USD millions | 216,630.5 | 328,348.8 | 437,169.6 | 5.9 | 693,150.0 | 1,093,196.6 |
| GDP per capita (US dollar) | 2,122.2 | 2,999.6 | 3,805.1 | 4.9 | 5,796.3 | 8,812.6 |
| GDP measured at purchasing power parity per capita (international dollar million) | 6,407.0 | 8,487.3 | 11,140.8 | 5.6 | 16,199.7 | 23,525.6 |
| Real GDP (% growth) | 6.751 | 6.341 | 5.546 | −2.6 | 6.300 | 6.400 |
| GDP deflator (2010 = 100) | 108.2 | 119.0 | 137.4 | 2.9 | 161.9 | 187.7 |
| Inflation (% growth) | 2.583 | 5.277 | 5.978 | 2.5 | 3.002 | 3.001 |
| Gross value added from production from agriculture, hunting, forestry and fishing (US$M) | 27,021.2 | 31,686.1 | 40,936.3 | 5.3 | ||
| Net exports of goods and services (US$M) | −7,517.0 | −38,535.6 | −61,593.9 | 9.8 | ||
| Exports (million) | 56,708.3 | 99,206.0 | 116,521.8 | 3.3 | ||
| Imports (million) | 64,225.2 | 137,741.6 | 178,115.7 | 5.3 | ||
Source: Euromonitor International, 2024 *CAGR: Compound Annual Growth Rate |
||||||
In 2023, the employment rate (age 15 to 64) in the Philippines was 59.7%. The employed population consisted of men at an employment rate of 73%, with working females at a rate of 46.4% and working youth (age 15 to 24) at a rate of 27.9% in 2023. Between 2018 and 2033, the unemployment rate in the Philippines has been decreasing by a CAGR of 3.3%, dropping down to a rate of 4.5% in 2023. Albeit, the unemployment rate is forecast to increase back up slightly over the next decade to reach 5.2% by 2033.
| Category | 2013 | 2018 | 2023 | CAGR* % 2018-2023 | 2028 | 2033 |
|---|---|---|---|---|---|---|
| Labour force participation rate (% age 15-64) | 61.5 | 59.3 | 62.7 | 1.1 | ||
| Employment rate (% age 15-64) | 56.9 | 56.0 | 59.7 | 1.3 | ||
| Economically active population ('000) | 40,493.3 | 43,267.0 | 49,841.7 | 2.9 | 54,777.8 | 59,805.5 |
| Male active population ('000) | 24,538.5 | 26,668.4 | 30,312.7 | 2.6 | 33,112.7 | 36,028.6 |
| Female active population ('000) | 15,954.8 | 16,598.5 | 19,529.0 | 3.3 | 21,665.1 | 23,776.8 |
| Employed population ('000) | 37,587.9 | 40,968.0 | 47,598.8 | 3.0 | 51,982.7 | 56,694.0 |
| Male employment rate (% age 15-64) | 69.3 | 69.4 | 73.0 | 1.0 | ||
| Female employment rate (% age 15-64) | 44.5 | 42.4 | 46.4 | 1.8 | ||
| Youth employment rate (% age 15-24) | 33.1 | 29.6 | 27.9 | −1.2 | ||
| Unemployed population ('000) | 2,905.4 | 2,298.9 | 2,242.9 | −0.5 | 2,795.1 | 3,111.4 |
| Unemployment rate (% economically active) | 7.2 | 5.3 | 4.5 | −3.3 | 5.1 | 5.2 |
| Male unemployment rate (%) | 6.8 | 4.9 | 4.1 | −3.4 | 4.5 | 4.6 |
| Female unemployment rate (%) | 7.7 | 6.1 | 5.1 | −3.2 | 6.0 | 6.1 |
| Youth unemployment rate (% aged 15-24) | 18.4 | 14.6 | 10.5 | −6.3 | ||
| Disposable income per capita (US dollar) | 1,617.9 | 2,239.2 | 2,807.6 | 4.6 | 4,344.3 | 6,653.6 |
| Population living below national poverty line (NPL) (%) | 24.7 | 17.0 | 16.4 | −0.7 | ||
Source: Euromonitor International, 2024 *CAGR: Compound Annual Growth Rate |
||||||
The middle class is expanding at a fast pace and is expected to have a strong influence on consumer markets (although still having a weaker spending power compared to global average), making up of around 29% of households in the Philippines. In return, the disposable income in the Philippines is growing, as the country's economy is getting stronger - reaching a median of US$8,634.7 per household in 2023.Footnote 3
A large number of head of households holds either no education up to primary education (56.2%), followed by 34.8% of head of households with a secondary education, and 8.9% with a higher education in 2023. Nonetheless, education is to play a larger role in the near future at the secondary or higher education level.
| Category | 2013 | 2018 | 2023 | 2028 | 2033 | CAGR* % 2013-2033 |
|---|---|---|---|---|---|---|
| Number of households | 21,850.3 | 24,909.4 | 28,362.0 | 31,450.1 | 34,207.5 | 2.3 |
| Households by education of head of household [primary and no education] | 12,884.3 | 14,313.7 | 15,953.5 | 17,343.7 | 18,635.4 | 1.9 |
| Households by education of head of household [secondary] | 7,098.2 | 8,419.6 | 9,877.1 | 11,241.8 | 12,418.5 | 2.8 |
| Households by education of head of household [higher] | 1,867.8 | 2,176.0 | 2,531.3 | 2,864.5 | 3,153.6 | 2.7 |
| Middle class households | 5,216.7 | 6,932.1 | 8,155.8 | 9,261.8 | 10,316.6 | 3.5 |
| Middle class households (% of total) | 23.9 | 27.8 | 28.8 | 29.4 | 30.2 | 1.2 |
Source: Euromonitor International, 2024 *CAGR: Compound Annual Growth Rate |
||||||
In 2023, the Philippines ranked 13th among Asia Pacific countries in terms of average gross income, and saw a 3.7% rise in per capita disposable income over the year - supported by a lower unemployment rate and an increase in labour productivity.Footnote 5 The average gross income of the population from age 15+ within the Philippines was US$4,368.2 growing at a CAGR of 6.5% (2013 to 2033), which is equivalent to the Philippine peso of PHP$242,994.3 in 2023. The largest average gross income peaks at the population aged between 30 and 34 years (middle youth) at a value of US$5,634.5 with its lowest average being between 15 to 19 years (US$2,168.9) and ages 65+ (US$3,081.2) in 2023.
| Type of statistic | 2013 | 2018 | 2023 | 2028 | 2033 | CAGR* % 2013-2033 |
|---|---|---|---|---|---|---|
| Average gross income (15+ yrs) - US$ | 2,693.2 | 3,607.5 | 4,368.2 | 6,427.0 | 9,474.6 | 6.5 |
| Average gross income (15+ yrs) - PHP$[1] | 149,816.5 | 200,678.2 | 242,994.3 | 357,516.1 | 527,047.5 | 6.5 |
| Population aged 15 to 19 (US$) | 1,302.5 | 1,774.5 | 2,168.9 | 3,217.0 | 4,755.3 | 6.7 |
| Population aged 20 to 24 (US$) | 2,689.1 | 3,651.4 | 4,452.1 | 6,592.8 | 9,735.2 | 6.6 |
| Population aged 25 to 29 (US$) | 3,198.1 | 4,323.6 | 5,260.7 | 7,784.2 | 11,488.8 | 6.6 |
| Population aged 30 to 34 (US$) | 3,446.6 | 4,640.9 | 5,634.3 | 8,327.1 | 12,280.7 | 6.6 |
| Population aged 35 to 39 (US$) | 3,399.7 | 4,559.9 | 5,523.1 | 8,151.5 | 12,011.4 | 6.5 |
| Population aged 40 to 44 (US$) | 3,209.0 | 4,282.4 | 5,171.1 | 7,618.5 | 11,213.3 | 6.5 |
| Population aged 45 to 49 (US$) | 2,979.7 | 3,945.3 | 4,742.7 | 6,970.4 | 10,243.6 | 6.4 |
| Population aged 50 to 54 (US$) | 2,736.5 | 3,582.0 | 4,279.4 | 6,269.9 | 9,195.6 | 6.2 |
| Population aged 55 to 59 (US$) | 2,476.9 | 3,200.8 | 3,796.9 | 5,542.3 | 8,109.1 | 6.1 |
| Population aged 60 to 64 (US$) | 2,264.8 | 2,909.8 | 3,437.2 | 5,001.6 | 7,303.2 | 6.0 |
| Population aged 65+ (US$) | 2,045.9 | 2,614.1 | 3,081.2 | 4,481.0 | 6,540.3 | 6.0 |
| Median disposable income per household (US$) | 5,430.4 | 7,243.0 | 8,634.7 | 12,718.2 | 18,839.9 | 6.4 |
Source: Euromonitor International, 2024 *CAGR: Compound Annual Growth Rate 1: Philippine peso |
||||||
Out of a population cohort of 82.0 million in 2023, the majority of workers (69.1%) made an average gross income between social class D (50 to 100%) and E (<50%; <US$2,184.1), followed by 14.7% at middle social class C (100-150%; US$4,368.2 to $6,552.3), 6.7% at social class B (150 to 200%), and 9.6% at social class A (>200%; >US$8,736.4). Social class C is set to be the fastest growing social class over the period to 2028, but social class E will remain the largest social class. Projections for 2023-2028 indicate a 28.4% increase per capita disposable income and social progress is anticipated to continue in the country, reducing the income distribution gap.Footnote 5
| Type of statistic | 2013 | 2018 | 2023 | 2028 | 2033 | CAGR* % 2013-2033 |
|---|---|---|---|---|---|---|
| Average gross income (15+ yrs) - US$ | 2,693.2 | 3,607.5 | 4,368.2 | 6,427.0 | 9,474.6 | 6.5 |
| Total - population in cohort by social class | 66,911.9 | 74,670.4 | 82,023.5 | 89,661.8 | 96,483.8 | 1.8 |
| Social class A (gross income >200% of average gross income) | 6,317.0 | 7,125.7 | 7,837.0 | 8,578.0 | 9,299.0 | 2.0 |
| Social class B (between 150 to 200%) | 3,856.5 | 4,708.0 | 5,503.0 | 6,117.2 | 6,649.0 | 2.8 |
| Social class C (between 100 to 150%) | 8,321.2 | 10,229.0 | 12,022.0 | 13,370.2 | 14,519.2 | 2.8 |
| Social class D (between 50 to 100%) | 19,980.6 | 23,551.7 | 26,819.1 | 29,558.6 | 31,921.7 | 2.4 |
| Social class E (gross income <50% of average gross income) | 28,436.6 | 29,056.0 | 29,842.4 | 32,037.8 | 34,094.9 | 0.9 |
| Total - population | 102,076.3 | 109,465.3 | 114,891.2 | 119,584.0 | 124,049.0 | 1.0 |
Source: Euromonitor International, 2024 *CAGR: Compound Annual Growth Rate |
||||||
Food and beverage expenditures and preferences
Within the APAC region, the total average consumer expenditure per capita (PCE) was equivalent to US$3,550.9 in 2023. The Philippines has the 23rd largest consumer market in the APAC region (US$2,865.6) in 2023, with the most well off areas being Macau (China) at a PCE as high as (US$56,803.4), followed by Guam, Hong Kong (China), Singapore, and New Caledonia. The Calabarzon region is anticipated to remain the largest consumer market in the Philippines by 2028, accounting for 20.8% of total consumer expenditure in the country.Footnote 5
Food and non-alcoholic beverages was the largest consumer spending category in the Philippines at a share of 37.3% in 2023, while leisure and recreation will record the fastest growth over 2023-2028. Other consumer expenditures included housing (12.1%), transportation (9.5%), hotels and catering (7.8%), education (5.0%), health goods and medical supplies (4.1%), household goods and services (2.7%), communications (2.7%), alcoholic beverages and tobacco/clothing and footwear/leisure and recreation (5.3%), and other miscellaneous goods and services (37.3%) in 2023.
Retail value sales of packaged food continue to grow steadily in the Philippines at total sales of US$17.2 billion in 2023, representing a CAGR of 7.7% (2018-2023) and is forecast growth at a CAGR of 7.1% (2023-2028) to reach US$24.3 billion by 2028. Filipino consumers spent the most on staple foods at an expenditure of US$56.4 PCE, dairy products and alternativie (US$34.2 PCE), snacks (US$33.3 PCE), and cooking ingredient and meals (US$26.2 PCE) in 2023 - especially highest for products such as processed meat, seafood and alternatives to meat, dairy, savoury snacks, rice, pasta and noodles, and edible oils. In terms of beverages, Filipinos spent approximately US$75.3 PCE on non-alcohol hot/soft drinks and US$64.3 PCE on alcoholic drinks in 2023.
| Consumer expenditure | 2018 | 2023 | CAGR* % 2018-2023 | 2024 | 2028 | CAGR* % 2023-2028 |
|---|---|---|---|---|---|---|
| Total - consumer expenditure of all goods | 2,137.2 | 2,865.6 | 6.0 | 3,115.1 | 4,317.8 | 8.5 |
| Total - retail packaged food (off-trade) | 108.9 | 150.1 | 6.6 | 158.3 | 203.3 | 6.3 |
| Cooking ingredients and meals | 17.8 | 26.2 | 8.0 | 27.5 | 33.5 | 5.0 |
| Edible oils | 9.0 | 13.3 | 8.1 | 13.8 | 16.1 | 3.9 |
| Meals and soups | 1.0 | 1.5 | 8.4 | 1.6 | 2.1 | 7.0 |
| Sauces, dips and condiments | 7.2 | 10.6 | 8.0 | 11.3 | 14.3 | 6.2 |
| Sweet spreads | 0.5 | 0.8 | 9.9 | 0.8 | 1.1 | 6.6 |
| Dairy products and alternatives | 25.7 | 34.2 | 5.9 | 36.1 | 46.9 | 6.5 |
| Baby food | 7.7 | 8.2 | 1.3 | 8.7 | 10.7 | 5.5 |
| Dairy | 17.6 | 25.6 | 7.8 | 27.0 | 35.7 | 6.9 |
| Plant-based dairy | 0.4 | 0.4 | 0.0 | 0.4 | 0.5 | 4.6 |
| Staple foods | 36.8 | 56.4 | 8.9 | 60.0 | 76.2 | 6.2 |
| Baked goods | 8.1 | 10.4 | 5.1 | 11.0 | 14.2 | 6.4 |
| Breakfast cereals | 1.0 | 1.3 | 5.4 | 1.4 | 1.7 | 5.5 |
| Processed fruit and vegetables | 2.0 | 3.0 | 8.4 | 3.2 | 4.1 | 6.4 |
| Processed meat, seafood and alternatives to meat | 17.1 | 28.4 | 10.7 | 30.2 | 38.2 | 6.1 |
| Rice, pasta and noodles | 8.6 | 13.4 | 9.3 | 14.1 | 17.8 | 5.8 |
| Snacks | 28.6 | 33.3 | 3.1 | 34.7 | 46.7 | 7.0 |
| Confectionery | 6.5 | 6.9 | 1.2 | 7.1 | 9.4 | 6.4 |
| Ice cream | 3.3 | 3.6 | 1.8 | 3.7 | 5.5 | 8.8 |
| Savoury snacks | 13.1 | 16.1 | 4.2 | 17.0 | 23.3 | 7.7 |
| Sweet biscuits, snack bars and fruit snacks | 5.7 | 6.7 | 3.3 | 6.8 | 8.5 | 4.9 |
| Total - retail non-alcohol drinks (off-trade) | 63.4 | 75.3 | 3.5 | 82.4 | 111.5 | 8.2 |
| Hot drinks | 13.6 | 14.6 | 1.4 | 15.9 | 21.0 | 7.5 |
| Soft drinks | 49.8 | 60.7 | 4.0 | 66.5 | 90.5 | 8.3 |
| Alcoholic drinks | 47.1 | 64.3 | 6.4 | 71.6 | 111.0 | 11.5 |
Source: Euromonitor International, 2024 *CAGR: Compound Annual Growth Rate |
||||||
Health and wellness products
Health and wellness (HW) continues to gain traction among Filipino consumers to alleviate concerns around mental health and physical fitness. In a Euromonitor survey in 2023, just over half of respondents said they regularly exercise, and 62% are regularly taking supplements or vitamins. Unhealthy eating habits and consumers' concerns about their health are prompting Filipinos to also, manage their weight. 49% of consumers said that they are monitoring what they eat to manage their weight, along with 23% said they are reducing their alcohol consumption. Furthermore, 66% of consumers said they look for health ingredients in food and beverages and 50% closely read the nutrition labels on the products they consume, with an increasingly interest in seeking out foods that have additional healthy ingredients and nutritional properties - with 84% of these consumers saying they would be willing to pay more for these features. For a variety of reasons, including personal health, high prices and sustainability, consumers continue to reduce their meat intake - 26% said they are trying to reduce their meat consumption, while 12% said they now eat meat (and fish) only occasionally.Footnote 1
Tech-based solutions are helping consumers to better monitor their health and fitness such as fitness wearables, smart watches, and other health-monitoring devices. 17% of respondents indicated that they own a fitness wearable/health tracking device and 26% said they regularly visit health-related or medical websites.Footnote 1
At the same time, 62% of Filipinos are cooking or baking at home at least weekly rather than dining out. As inflationary pressure continues to result in rising food prices, 31% are regularly seeking private label and low cost products. However, 43% of respondents are still tempted by the convenience and saving of time by reheating/preparing ready meals or regularly ordering food for home delivery (30%), while 38% are regularly ordering food for takeaway, or pick up ready-made food to eat at home.Footnote 1
In the Philippines, total HW product sales were approximately US$4.5 billion in 2023. Between 2019 and 2023, the HW sector grew by a CAGR of 9.3% and is forecast to grow by a CAGR of 5.8% between 2023 and 2028, to reach US$6.0 billion by 2028. In 2023, the largest HW category in the Philippines was for fortified/functional (FF) products by a market share of 81.8%, followed by health benefit (14.5%), better for you (BFY) at 11.5%, natural (5.9%), dietary and free from (FF) at 4.1%, and organic (0.8%) products.
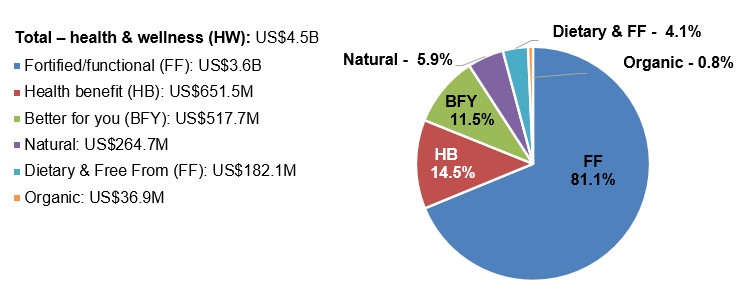
Description of above image
- Total – health and wellness (HW): US$4.5 billion
- Fortified/functional (FF): US$3.6 billion (81.1%)
- Health benefit (HB): US$651.5 million (14.5%)
- Better for you (BFY): US$517.7 million (11.5%)
- Natural: US$264.7 million (5.9%)
- Dietary and free from (FF): US$182.1 million (4.1%)
- Organic: US$36.9 million (0.8%)
Source: Euromonitor International, 2024
Opportunities for Canada
Canada and the Philippines are currently negotiating a free trade agreement (FTA) in the context of the Canada-Association of Southeast Asian Nations (ASEAN) FTA negotiation (Global Affairs Canada; Canada-Philippines Relations). Since Canada is presently not a FTA partner of the Philippines, Canadian products are subject to the Most Favoured Nation (MFN) tariff duties.
Canada is also, establishing an Indo-Pacific Agriculture and Agri-Food Office (IPAAO) in Manila, Philippines. This new office is a sign of our long-term commitment in the Indo-Pacific, along with the importance we place on building upon Canada's reputation as a stable and trusted supplier for agriculture, agri-food and seafood products. The office will enhance market access, advance technical cooperation, identify new business opportunities for Canadian exporters to diversify their exports and support investment attraction efforts into Canada (Agriculture and agri-food in the Indo-Pacific region). Canadian exporters are also encouraged to leverage the following programs and services in order to enter and expand their products within the Philippine market:
- Canada Brand
- AgriMarketing Program
- Trade Commissioner Service
- Agriculture and Food Trade Show Service
- Single Window for Agri-Food Trade Services
- Agri-food International Market Intelligence Service
- Funding Programs (Global Affairs Canada)
- Solutions for Canadian exporters (Export Development Canada)
For more information
The Canadian Trade Commissioner Service:
International Trade Commissioners can provide Canadian industry with on-the-ground expertise regarding market potential, current conditions and local business contacts, and are an excellent point of contact for export advice.
More agri-food market intelligence:
Agri-food market intelligence service
Canadian agri-food and seafood businesses can take advantage of a customized service of reports and analysis, and join our email subscription service to have the latest reports delivered directly to their inbox.
More on Canada's agriculture and agri-food sectors:
Canada's agriculture sectors
Information on the agriculture industry by sector. Data on international markets. Initiatives to support awareness of the industry in Canada. How the department engages with the industry.
Resources
- Agriculture and Agri-Food Canada; Agriculture and agri-food in the Indo-Pacific region.
- Euromonitor International | 4 July 2024. Country report: Income and Expenditure – The Philippines
- Euromonitor International | 21 July 2023. Country report: Philippines – Consumer Profile
- Euromonitor International | 12 June 2024. Consumer Lifestyles in the Philippines, November 2018.
- Euromonitor International | 11 May 2023. Country report: Business Dynamics: The Philippines
- Global Affairs Canada; Canada-Philippines Relations
- Global Trade Tracker (GTT), 2024
Consumer Profile – Philippines
Global Analysis Report
Prepared by: Erin-Ann Chauvin, Senior Market Analyst
© His Majesty the King in Right of Canada, represented by the Minister of Agriculture and Agri-Food (2024).
Photo credits
All photographs reproduced in this publication are used by permission of the rights holders.
All images, unless otherwise noted, are copyright His Majesty the King in Right of Canada.
To join our distribution list or to suggest additional report topics or markets, please contact:
Agriculture and Agri-Food Canada, Global Analysis1341 Baseline Rd, Tower 5, 3rd floor
Ottawa ON K1A 0C5
Canada
Email: aafc.mas-sam.aac@agr.gc.ca
The Government of Canada has prepared this report based on primary and secondary sources of information. Although every effort has been made to ensure that the information is accurate, Agriculture and Agri-Food Canada (AAFC) assumes no liability for any actions taken based on the information contained herein.
Reproduction or redistribution of this document, in whole or in part, must include acknowledgement of agriculture and agri-food Canada as the owner of the copyright in the document, through a reference citing AAFC, the title of the document and the year. Where the reproduction or redistribution includes data from this document, it must also include an acknowledgement of the specific data source(s), as noted in this document.
Agriculture and Agri-Food Canada provides this document and other report services to agriculture and food industry clients free of charge.