
The Pesticides Indicator (official name: Indicator of the Risk of Water Contamination by Pesticides) evaluates the relative risk of water contamination by pesticides across agricultural areas in Canada. It can be used to assess pesticide inputs to cropland and the amount of pesticide transported to surface and ground water. This indicator has tracked pesticide risk associated with Canadian agricultural activities from 1981 to 2016.
Overall state and trend
Pesticide risk has been increasing on agricultural lands in Canada, although the majority of agricultural land is still considered to be at low or very low risk. From 1981 to 2016, the level of risk increased on 52% of agricultural land, primarily due to an increase in the area treated with pesticides.
Use the interactive map below to zoom in and explore different regions. Note that in the Prairies, risk is considered to be low. While this region has the highest percentage of agricultural land treated with herbicides and fungicides, the dry Prairie climate means that there are fewer days with runoff and fewer pesticide applications per year. Most of the areas at very high risk, representing about 5% of agricultural land, are located in Prince Edward Island, the Mixedwood Plains regions of Ontario and Quebec, the Red River region of Manitoba, the Moisture Mixed Grassland area in Saskatchewan and Alberta, and the Lower Mainland in British Columbia.
From 1981 to 2016 there has been a generally increase in risk, particularly in southern and western Ontario, the Prairie provinces and Prince Edward Island.
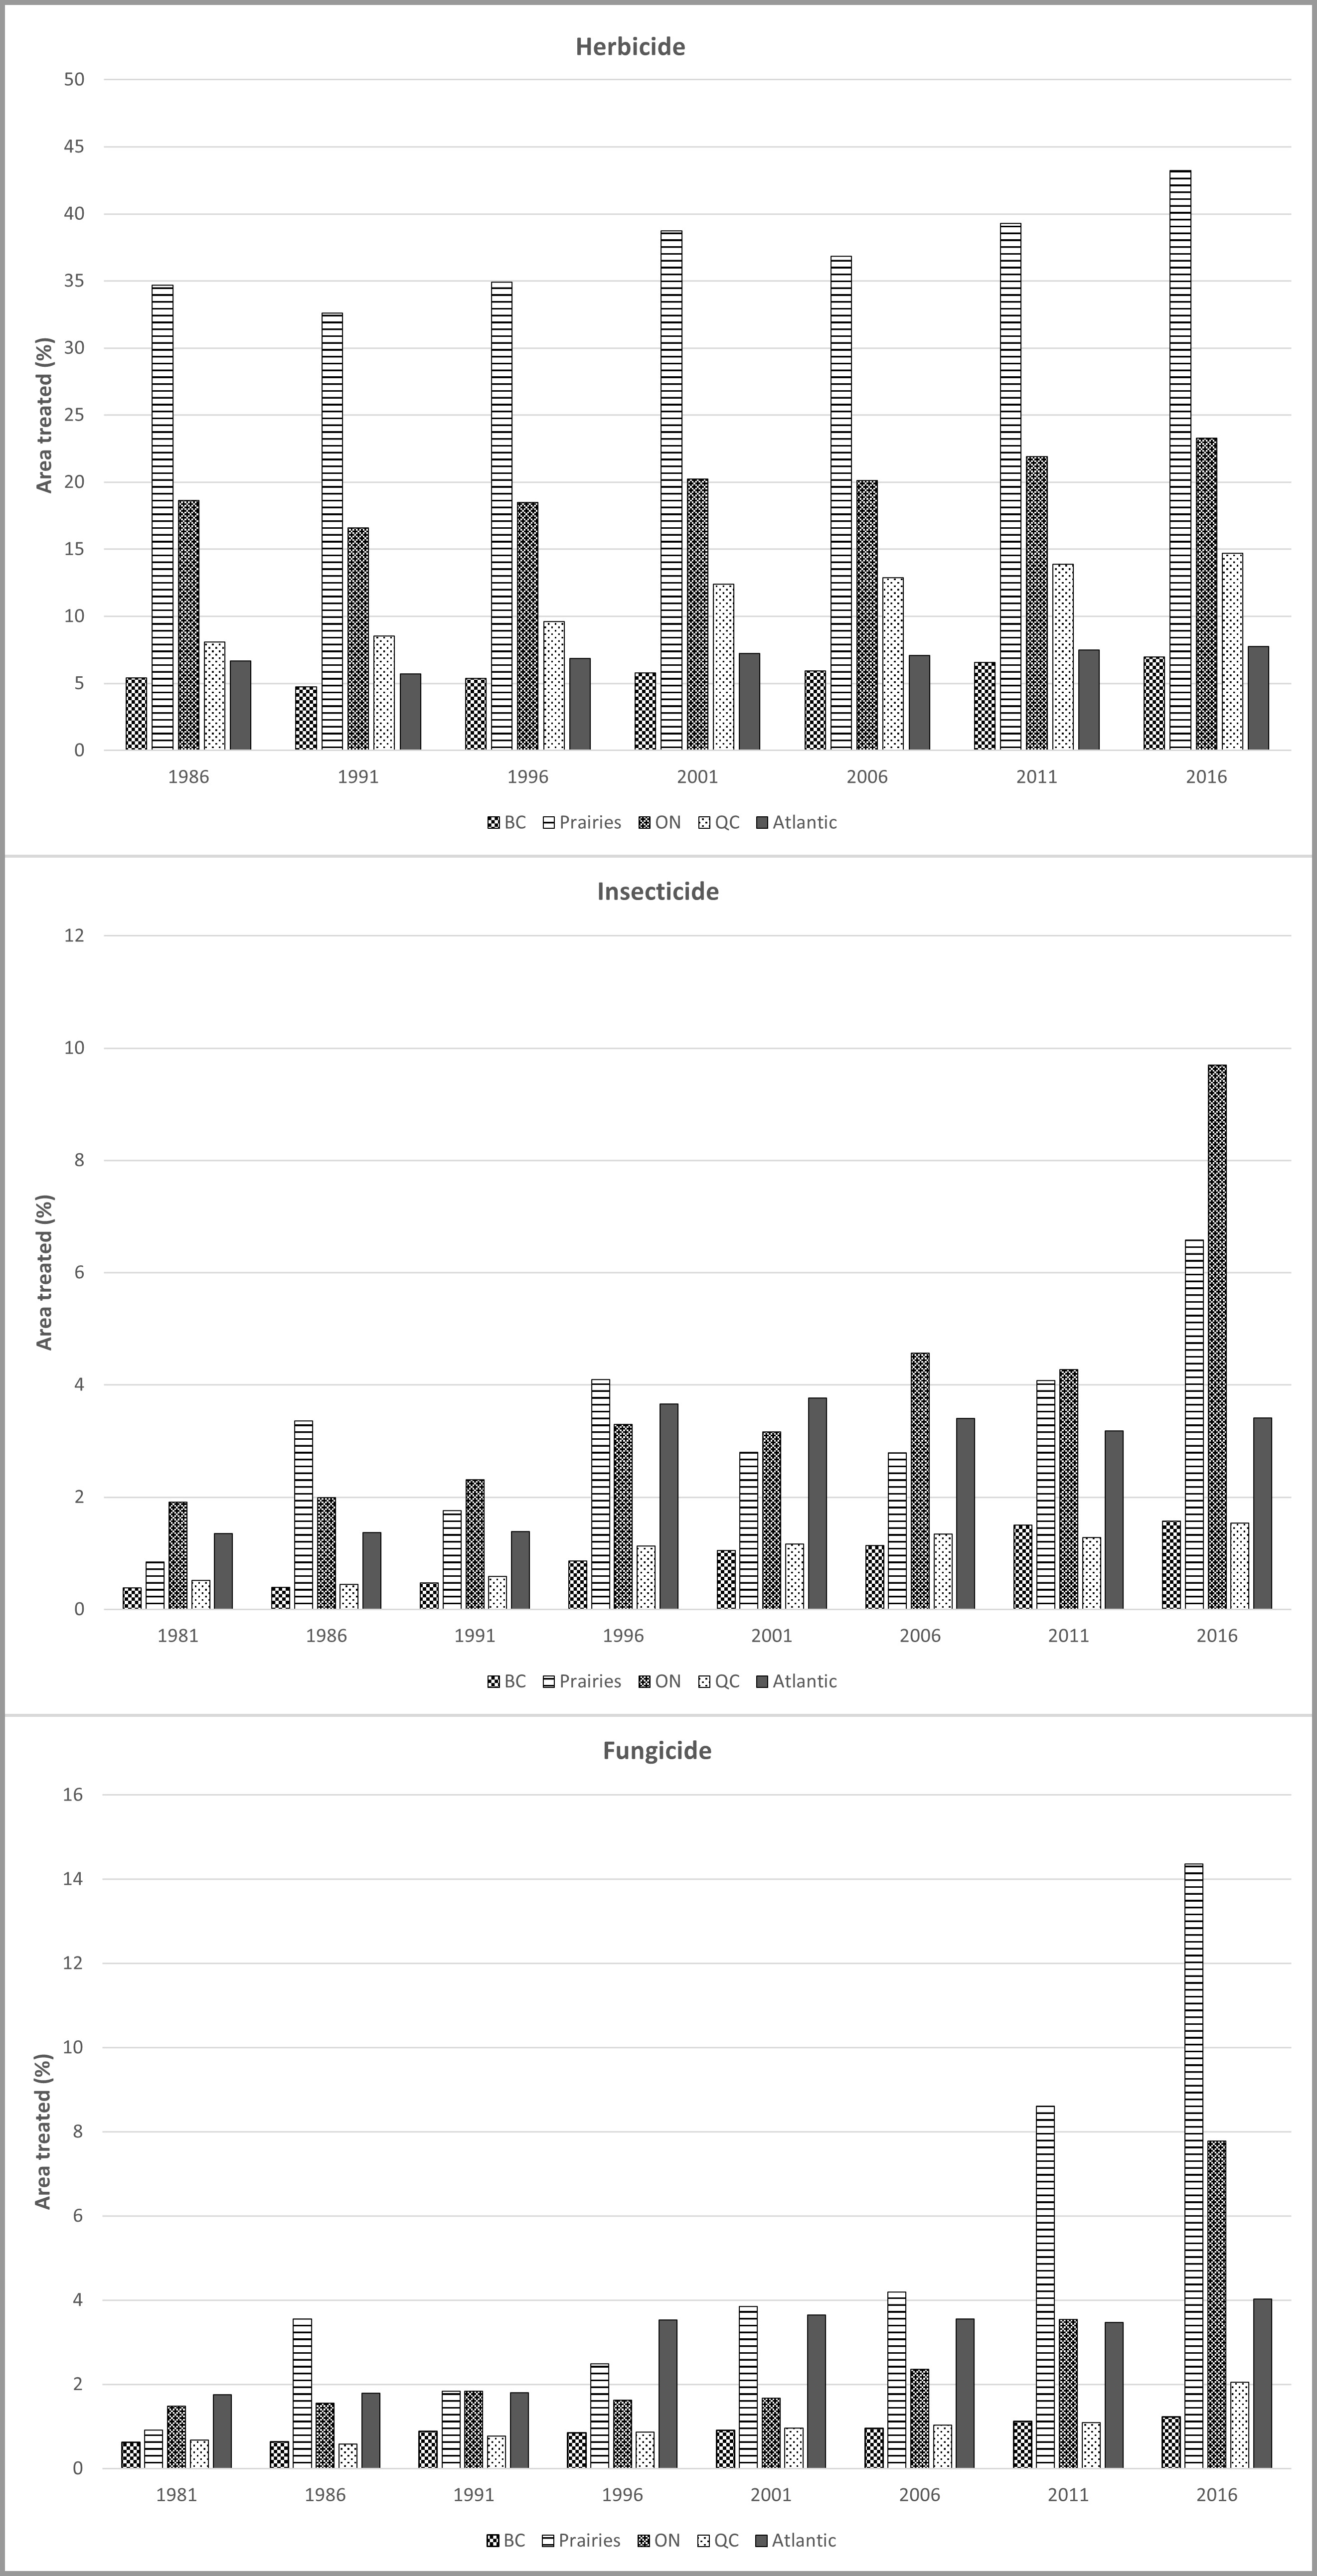
Generally speaking, the increases in risk observed in between 1981 and 2016 were caused by an increase in the area treated with pesticides. In Eastern Canada and the Maritimes this can be attributed to shifts from pasture and forage production to annual cropping systems, and in the Prairies to ongoing shifts from conventional tillage to reduced tillage and no-till systems, which require greater herbicide use for weed control. Between 1981 and 2016, there was a marked increase in the use of fungicides on the Prairies (from 0.9% to 14.4% of the land area) which can be attributed to the shift from intensive tillage to reduced tillage systems, which increase the risk of fungal diseases such as fusarium blight. The use of herbicide and insecticide also increased in this region, as shown by a percent of area increase from 21.7% to 43.2%, and from 0.8% to 6.6%, respectively. Another factor that may have contributed to the increase in pesticide use per unit cropland in recent years is the expansion of land devoted to glyphosate-tolerant canola, soybeans and corn and the mass of glyphosate herbicide applied in these systems.
Use the interactive map in Figure 2 to explore the change in pesticide risk between 1981 and 2016. It is apparent that the increase in risk is occurring across Canada.
Risk of Water Contamination by Pesticides performance index
The state and trend of the Pesticides Indicator can also be seen in the performance index below.

Description - Figure 3
| Year | Index Value |
|---|---|
| 1981 | 90 |
| 1986 | 87 |
| 1991 | 83 |
| 1996 | 88 |
| 2001 | 84 |
| 2006 | 82 |
| 2011 | 78 |
| 2016 | 77 |
In 2016, the state of the environment, as it relates to pesticide risk resulting from farming activities in Canada, was in the "Good" category. The index illustrates a downward trend, representing increased risk to water quality. From 1981 to 2016, the level of risk increased on 50% of agricultural land, primarily due to an increase in the area treated with pesticides, owing to a shift to cropping systems requiring greater use of pesticides, such as reduced tillage systems.
The index tends to aggregate and generalize trends and so should be viewed as a policy tool to give a general overview of state and trend over time.
Specific trends
More land area is being treated with pesticides
The figure below shows the percentage of agricultural land area treated with pesticides for all Census years since 1981, by region, for the Prairies (Alberta, Saskatchewan and Manitoba) and the Maritimes (New Brunswick, Nova Scotia and Prince Edward Island), which have been grouped based on similarities of climate and agricultural activities, or by province (British Columbia, Ontario and Quebec). The Prairie region has the highest percentage of agricultural land treated with herbicides and fungicides, and Ontario, the Prairies and the Maritimes have the highest percentage of agricultural land treated with insecticides. Despite the application of pesticides to large areas across much of the Prairies, the risk of water contamination remains relatively low there, mainly because of the dry climate, which limits pesticide movement caused by runoff events.
Description - Figure 4
| Pesticide | Year | BC | Prairies | ON | QC | Atlantic |
|---|---|---|---|---|---|---|
| Fungicides | 1981 | 0.62 | 0.92 | 1.48 | 0.68 | 1.76 |
| Fungicides | 1986 | 0.64 | 3.55 | 1.56 | 0.58 | 1.79 |
| Fungicides | 1991 | 0.89 | 1.84 | 1.84 | 0.77 | 1.8 |
| Fungicides | 1996 | 0.85 | 2.49 | 1.62 | 0.87 | 3.53 |
| Fungicides | 2001 | 0.91 | 3.85 | 1.67 | 0.96 | 3.65 |
| Fungicides | 2006 | 0.96 | 4.19 | 2.36 | 1.03 | 3.56 |
| Fungicides | 2011 | 1.12 | 8.61 | 3.54 | 1.09 | 3.47 |
| Fungicides | 2016 | 1.23 | 14.36 | 7.78 | 2.05 | 4.03 |
| Herbicides | 1981 | 4.61 | 21.75 | 17.82 | 6.1 | 6.31 |
| Herbicides | 1986 | 5.42 | 34.67 | 18.65 | 8.09 | 6.66 |
| Herbicides | 1991 | 4.75 | 32.61 | 16.59 | 8.53 | 5.72 |
| Herbicides | 1996 | 5.38 | 34.9 | 18.48 | 9.6 | 6.86 |
| Herbicides | 2001 | 5.78 | 38.74 | 20.24 | 12.4 | 7.23 |
| Herbicides | 2006 | 5.92 | 36.86 | 20.12 | 12.87 | 7.08 |
| Herbicides | 2011 | 6.57 | 39.29 | 21.91 | 13.89 | 7.48 |
| Herbicides | 2016 | 6.96 | 43.24 | 23.27 | 14.7 | 7.76 |
| Insecticides | 1981 | 0.38 | 0.85 | 1.91 | 0.52 | 1.35 |
| Insecticides | 1986 | 0.39 | 3.36 | 1.99 | 0.45 | 1.37 |
| Insecticides | 1991 | 0.47 | 1.76 | 2.31 | 0.59 | 1.39 |
| Insecticides | 1996 | 0.86 | 4.1 | 3.3 | 1.13 | 3.66 |
| Insecticides | 2001 | 1.05 | 2.8 | 3.16 | 1.17 | 3.77 |
| Insecticides | 2006 | 1.14 | 2.79 | 4.57 | 1.34 | 3.4 |
| Insecticides | 2011 | 1.5 | 4.08 | 4.27 | 1.28 | 3.18 |
| Insecticides | 2016 | 1.57 | 6.58 | 9.7 | 1.54 | 3.41 |
Reasons for increasing pesticide use
The primary reason for increase in pesticide use in Canada over the past 30 years is due to the shift away from livestock – cattle in particular – towards food crops, which require more inputs. According to Health Canada's Pest Management Regulatory Agency (PMRA), pesticide sales (based on weight of active ingredients) increased by 13.9% between 2008 and 2010. Furthermore, the increased use of reduced tillage and no-till on the Prairies, while greatly benefitting the health of our soils, has resulted in an increased reliance on pesticides, leading to an increased risk to water quality.
Why this indicator matters
Pesticides help agricultural producers reduce losses caused by weeds, insects and plant diseases, enabling a greater diversity of crops to be grown on existing farmland. While most pesticides are formulated to target a specific pest organism, the active ingredients found in some products may also cause unintentional harm to non-target species, which can become exposed when pesticides move from on-farm application sites into the surrounding environment and contaminate surface and ground water. Pesticide residues have been detected in surface and ground water in monitoring studies conducted in various regions of Canada, raising concerns for potential adverse effects on wildlife as well as on drinking water quality.
Agriculture has the potential to mitigate risk from pesticides by implementing beneficial management practices (BMPs) that reduce pesticide application rates or that prevent pesticides from reaching water bodies.
Beneficial management practices
Strategies for reducing the risk of water contamination by pesticides include reducing the risk of pesticide transport to surface or ground water, decreasing the amount of pesticide used and reducing the persistence or mobility of the active ingredients.
Because surface runoff and spray drift are important pesticide transport mechanisms, it is critical that pesticides only be applied in suitable weather conditions with the recommended application techniques. Local spray advisory forecasts provide helpful guidance for producers in this regard. BMPs that reduce runoff or soil erosion, or increase soil organic matter content, help reduce pesticide transport. These include riparian buffers, contour farming, strip cropping, and reduced tillage or zero tillage systems. It should be noted, however, that herbicide use typically increases with reduced tillage, which may offset the pesticide-related benefits of the reduction in runoff associated with this practice. Other practices that can help reduce pest pressure include crop rotation and the planting of resistant crop varieties.
Integrated pest management (IPM) combines the use of cultural, biological and chemical control measures, reducing the need for chemical pesticides. Examples of these measures include:
- cultural techniques and sanitation practices (such as washing soil off equipment when moving from a nematode-infested field to one that isn't infested, or plowing under infected plant residues) to prevent the development of or suppress harmful organisms;
- resistant cultivars or certified disease-free seed;
- practices to protect and enhance natural enemies and other beneficial organisms;
- scouting and monitoring of crops for the presence of harmful organisms;
- forecasting systems to inform pest management decisions; and
- mechanical methods or biological control measures (e.g. biopesticides, natural enemies) when pest pressure reaches the threshold for action.
About the performance indices
The agri-environmental performance index shows environmental performance state and trends over time, based on weighting the percentage of agricultural land in each indicator class, such that the index ranges from 0 (all land in the most undesirable category) to 100 (all land in the most desirable category). An index value that is increasing over time suggests improving environmental performance, while a decreasing index value suggests deteriorating environmental performance over time.
Related indicators
- The Nitrogen Indicator tracks the risk of water contamination from nitrogen.
- The Phosphorus Indicator examines risk to water from phosphorus.
- The Coliforms Indicator calculates the risk of water contamination from agricultural coliforms.
Additional resources and downloads
Discover and download geospatial data related to this and other indicators.