
Table of contents
- Water contamination by pesticides in Canada: why does it matter?
- What determines the risk of water contamination by pesticides?
- Risk of water contamination by pesticides: the indicator
- Risk of water contamination by pesticides: current state and change over time in Canada
- How can risk of water contamination by pesticides be reduced?
Summary
- Pesticides protect crops from economic damage, yield loss and quality reduction caused by weeds (herbicide), insects (insecticide, acaracide) and diseases (fungicide, bactericide).
- Pesticides may move from cropland to the broader environment, affecting drinking water, land and aquatic wildlife.
- The Indicator of the Risk of Water Contamination by Pesticides estimates the risk of farmland pesticides reaching water bodies and tracks how this risk has changed over time and space.
- Overall, the risk of water contamination by pesticides on Canada’s farmland has increased over time.
- Risk is highest in areas where a large percentage of cropland area is treated with pesticides, and where surface runoff from rain and snowmelt is higher due to a relatively moist climate.
- Producers can reduce the risk of water contamination by pesticides by adopting Beneficial Management Practices (BMPs) that reduce runoff or soil erosion, and adopting integrated pest management. These options include applying:
- the right amount
- in the right place
- at the right time
- using the right pesticide type
- with the right (or most appropriate) technology
- following the right application methods
Water contamination by pesticides in Canada: why does it matter?
Pesticides help agricultural producers protect crop yield and quality by reducing weeds, insects, and plant diseases. However, pesticides applied to crops can negatively impact the environment and reduce profits when applied unnecessarily or inappropriately.
Pesticides have been found in surface and ground waters across Canada. This poses a risk to human health by affecting drinking water, and to land and aquatic plants and animals. Toxicity varies greatly among pesticides; however, in Canada, aquatic and drinking water guidelines have been established for only a few agricultural pesticides. Toxicity is related to the chemistry of the ingredients as well as how much, how long, and how often the exposure happens, by individual pesticide or in combination with other pesticides.
Many of Canada’s animal Species at Risk (that is, species at risk of disappearing from Canada and the world) use water bodies on or near farmland at some stage in their life cycles. To help protect these species, it is important to understand how farming impacts their health and habitat. In some cases, provincial or federal regulations (such as the Species at Risk Act or provincial wildlife acts) might also require protecting these species or their habitats (see Wildlife Habitat Availability on Farmland Indicator).
In addition to environmental and ecological impacts, pesticides lost to the broader environment also have an economic impact. First, pesticides lost from farms are not effectively protecting crops. Second, producers will have to purchase and apply additional pesticides to protect their crops, which increases expenses and consumes more time.
Effective pesticide management benefits producers and the environment. Optimal use of pesticides can save producers time, resources and money, and reduce environmental impacts. Also, the Government of Canada reports on the risk of water contamination by pesticides on farmland. This helps inform Canadians if Canada’s farmlands are healthy and highlight where improvements to farming practices may be needed.
What determines the risk of water contamination by pesticides?
Because Canada has a wide range of climatic conditions, landscape types and agricultural practices, it is challenging to evaluate the risk of water contamination by pesticides. The risk of water contamination by pesticides is high when there is a high pesticide application rate or where residue pesticide can easily be transported to water. Overall, the Prairies have the highest percentage of agricultural land treated with fungicides (fungal disease control) and herbicides (weed control). Use of fungicides has increased on the Prairies (from 2% to 9% of cropland area in the past 10 years). This might be because more land is under reduced tillage, which can increase the risk of fungal disease such as fusarium head blight on cereals or sclerotinia on canola. In addition, more fungicide is required in wetter climates. Reduced tillage also requires increased use of herbicides to control weeds.
Ontario, the Prairies and Atlantic Canada have the highest percentage of agricultural land treated with insecticides. Because fruits are so vulnerable to insect infestations, fruit production usually requires more insecticide applications than field crop production.
Pesticide use can differ greatly in different parts of the same province. For example, in the lower Fraser River valley of British Columbia (where the climate is wetter and there is a lot of fruit production), pesticide use is high. While in northern British Columbia agricultural regions (which are drier and dominated by field crop production systems and pasture land), pesticide use can be low.
Pesticides are transported to water bodies by wind or water. Many physical and chemical factors influence how much pesticide is transported to water bodies. Applied pesticides can be moved through vapour drift, wind erosion of treated soil, dry deposition, and rainfall washout. These particles can then be further transported through leaching or runoff. Climate, soil characteristics and agricultural practices can further influence the risk that these pesticides reach water bodies.
The main means of transportation for pesticides is surface runoff. The amount of runoff depends on the amount of precipitation and the soil moisture content when precipitation occurs. Soil moisture content is influenced by the frequency, duration and intensity of precipitation, by soil texture, and by farm management practices such as the type of crop grown and tillage practices. The average number of days with surface runoff is highest in Atlantic Canada (42), followed by Ontario and Quebec (about 30), British Columbia (21) and the Prairies (11).
Climate change is expected to contribute to the risk of water contamination by pesticides. For example, periods of excess or extreme rainfall can increase transport of pesticides to water bodies because of increased surface runoff or drainage.
Risk of Water Contamination by Pesticides Indicator
The Risk of Water Contamination by Pesticides Indicator quantifies the potential risk of pesticides to move into water bodies. The Indicator also reflects the variation over space and change over time.
The Indicator considers how farming practices affect pesticide use and how pesticides are transported by water. To assess this, the amount of pesticides moving into the surrounding environment is estimated based on pesticide use data across Canada; pesticide application rates and management; soil and landscape characteristics; daily weather; and pesticide properties.
Because more than one pesticide may be applied on a field, the Indicator considers the total amount and concentration of all pesticides applied. The overall risk is scored as very low, low, moderate, high or very high based on the pesticide concentration and the amount of pesticide transported in water. Because Canada has no water quality guidelines for pesticide mixtures, the European drinking water quality guideline for pesticide mixtures (a concentration of 0.5 micrograms per litre = 5 parts per million) is used as a guide.
The Risk of Water Contamination by Pesticides Indicator is calculated every five years. It helps the Government know the status and trend of the risk of water contamination by pesticide across Canada’s cropland. This helps to identify where farming practices need to be changed to reduce the risk.
Risk of water contamination by pesticides in Canada: current state and change over time
Current state
Regions of high to very high risk occur in every province where pesticide use, wetter climate, and production systems requiring significant pesticide application are found in combination.
In 2021, the risk of groundwater contamination was very low for the majority of Canada. However, the risk of edge-of-field runoff was higher: about 70% of cropland had low or very low risk and about 5% of cropland had very high risk. Areas of higher risk were mainly found in Prince Edward Island, in the mixedwood plains of Ontario and Quebec, and in the Prairie parkland region.
In the Prairies, where the area treated by pesticides is large, much of the cropland was at low or very low risk. This is because of the dry climate (a low number of runoff days) and fewer pesticide applications per year. However, high and very high risk areas do occur in some wetter regions of the Prairies where some crops requiring high pesticide use are common (for example, the Red River region of Manitoba and the parkland region of Alberta).
Relative risk of pesticide contamination of water on cropland under management practices in Canada in 2021
Change over time
Between 1981 and 2006, the risk of water contamination by pesticides was relatively stable with the large majority of farmland (90%) under lower risk (low and very low classes). However, in 2021, the lower risk area decreased to 70%; farmland in the moderate risk class increased from 3% to 15%, and farmland under higher risk (high and very high classes) increased from 5% to 16%.
Change in pesticide risk, 1981 to 2021
How can the risk of water contamination by pesticides be reduced?
Strategies for reducing the risk of water contamination by pesticides include reducing the amount of pesticide used (apply only when required), reducing the persistence or movement of pesticide ingredients, or reducing the risk of pesticide transport to surface or groundwater.
Surface runoff is the main force driving pesticides to water bodies. It is critical that pesticides only be applied with recommended application technologies, at the correct rate, during the optimal crop stage, when the economic threshold is reached (that is, when the potential yield benefit or return on investment is more than the cost of application), and during suitable weather conditions. Local spray advisories, bioclimatic models (which predict the occurrences of invasive insects or diseases from weather forecasts) and in-field disease, insect and weed monitoring (for example, fungal disease spore traps) can help producers know the best time to apply pesticides.
Beneficial management practices (BMPs) that reduce runoff or soil erosion or increase soil organic matter content will reduce pesticide transport.
Beneficial management practices
- Create riparian buffers, contour farming, strip cropping, and reduced or zero tillage systems. Reduced tillage reduces pesticide runoff, but it often requires more herbicides. Therefore, integrated risk management approaches are required which weigh the benefits and risks.
- Integrate pest management approaches that combine cultural and biological pest control with chemical control.
- Scout fields to ensure that pesticide application is necessary.
- Rotate crops to reduce insect and disease pressures.
- Rotate pesticide-active ingredients to minimize pest resistance.
Ongoing research should target pesticide-specific BMPs, pest-resistant crops and pesticide active ingredients that are less persistent and less mobile in the environment.
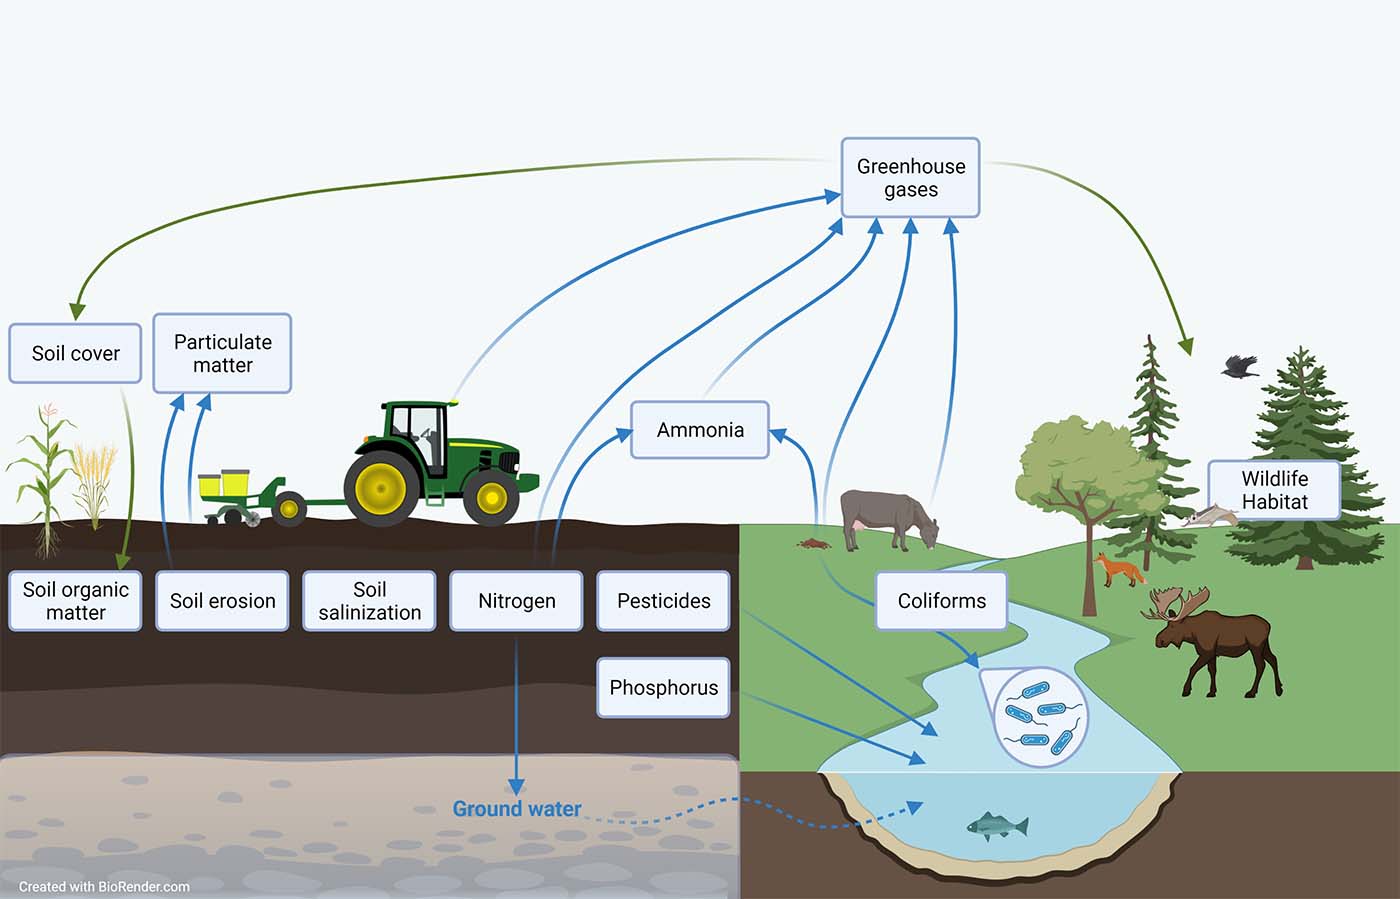
Description of the image above
An infographic showing an agricultural landscape with crops, a tractor, soil and grazing livestock adjacent to a natural landscape with a watercourse, forest and wild animals. Text boxes are placed next to specific landscape elements to identify their connection to the agricultural sustainability indicators. One text box identifies each of the following indicators: Soil cover, particulate matter, soil organic matter, soil erosion, soil salinization, nitrogen, pesticides, phosphorus, ammonia, greenhouse gases, coliforms and wildlife habitat. Arrows are used to connect text boxes to show interrelationships.
Agriculture and Agri-Food Canada's agri-environmental indicators (AEIs) provide a science-based snapshot of the current state and trend of Canada’s agri-environmental performance in terms of soil quality (soil organic matter, soil erosion, soil salinization), water quality (nitrogen, pesticides, phosphorus, coliforms), air quality (particulate matter, ammonia, greenhouse gas emissions) and farmland management (agricultural land use, soil cover, wildlife habitat). While indicator results are presented individually, agro-ecosystems are complex, so many of the indicators are interrelated. This means that changes in one indicator may be associated with changes in other indicators as well.
Related indicators
- The Nitrogen Indicator tracks the risk of water contamination from nitrogen.
- The Phosphorus Indicator examines risk to water from phosphorus.
- The Coliforms Indicator calculates the risk of water contamination from agricultural coliforms.
Additional sources and downloads
Discover and download geospatial data related to this and other indicators.