
Summary
This report, Environmental Sustainability of Canadian Agriculture: Agri-Environmental Indicator Report Series—Report #4, presents agri-environmental performance results and trends for the 30-year period from 1981 to 2011. The report provides a snapshot of the health of the Canadian agriculture and agri-food system using data from the 2011 Canadian Census of Agriculture. The indicators in this report have been developed using internationally established methodology and are shared with the Organisation for Economic Co-operation and Development where they are used to compare Canada's agri-environmental performance with that of other member nations.
The report is intended for readers who want to learn about the environmental issues most important to the agriculture sector, and want to know whether the agriculture sector is moving towards or away from environmental sustainability. This information can be used as a report card for producers, consumers and the international community, as it points out areas where further efforts are required. It also provides valuable information to assist decision-makers in developing and evaluating agricultural policy.
To complement the report, each indicator also has its own web page, where the trends are explored through the use of interactive maps. Links to each indicator web page are provided in the highlights section.
The report begins with an introductory section with chapters on methodologies for the assessments and the forces driving change in the indices. Section 2 presents indicators relating to Farmland Management and species habitat. Sections 3, 4, and 5 present indicators relating to Soil Quality, Water Quality, and Air Quality respectively. Section 6 discusses Applications and Future Directions for these indicators.
Highlights
Farmland Management indicators
- Two prevalent trends in Canadian agricultural production were discernable between 1981 and 2011; consolidation of farmland into fewer farms, and increasing intensity of production on those farms.
- Total numbers of most major livestock categories increased over the 30-year period for the country as a whole. Since 1981, the beef cattle industry in Canada grew steadily, and reaching a peak between 2001 and 2006. Since 2006, beef herd size has been declining. Conversely, between 1981 and 2011, the number of dairy cows declined steadily with a 46% drop over the 30 years. The primary reason for this has been a dramatic increase in milk production per cow, which has been facilitated by the consolidation of dairy farms, and improved feed efficiency.
- The Soil Cover Indicator has shown dramatic improvements since 1981, primarily due to the reduction in summerfallow and intensive tillage in the Prairie Region.
- The Wildlife Habitat on Farmland Indicator has deteriorated since 1986, primarily due to the loss of natural and semi-natural land resulting from the widespread conversation of pasture and forage to annual crops.
Biodiversity compound index
The Soil Cover Indicator and the Wildlife Habitat on Farmland Indicator contribute to the Compound Biodiversity Index below. The overall trend from 1981 to 2011 for biodiversity shows steady and consistent improvements across Canada, moving from a "Poor" status in 1981, to a "Moderate" status in 2011. The improvements are largely due to changes in tillage practices reflected in the Soil Cover Indicator.
Figure 1: Biodiversity index

Figure 1 - description
| Year | Index Value | Status* |
|---|---|---|
| *Status: desired, good, moderate, poor, at risk | ||
| 1986 | 37 | poor |
| 1991 | 36 | poor |
| 1996 | 39 | poor |
| 2001 | 41 | moderate |
| 2006 | 43 | moderate |
| 2011 | 44 | moderate |
The index tends to aggregate and generalize trends and so should be viewed as a policy tool to give a general overview of state and trend over time.
Soil Quality indicators
- Overall soil quality has seen considerable improvements over the last 30 years, primarily attributable to improvements in land management practices, such as increased adoption of reduced tillage and no-till practices, and the reduction in area under summerfallow in the Prairie Region.
- The Soil Erosion Indicator has shown dramatic improvements since 1981, primarily due to the reduction in tillage erosion in the Prairie Region as well as a reduction in erosion from wind and water.
- The Soil Organic Matter Indicator has shown dramatic improvements since 1981, primarily due to the reduction in summerfallow and intensive tillage in the Prairie Region – practices which had historically degraded the soil.
- The Soil Salinization Indicator has also shown dramatic improvements since 1981. These improvements are largely attributable to a 7-million-hectare decrease in summerfallow area, and a 4.8-million-hectare increase in the area of permanent cover.
Soil quality compound index
The Soil Erosion, Soil Organic Carbon and Soil Salinization Indicators contribute to the Compound Soil Quality Index below, in addition to the Trace Elements Indicator (values extrapolated from previous years, not reported here). Considering various aspects of soil quality together, agriculture's environmental performance has a "Good" status, and has significantly improved over the 30-year period preceding 2011. These improvements can be directly attributed to improvements in land management practices, such as increased adoption of reduced tillage and no-till practices, and the reduction in area under summerfallow.
Figure 2: Soil quality compound index
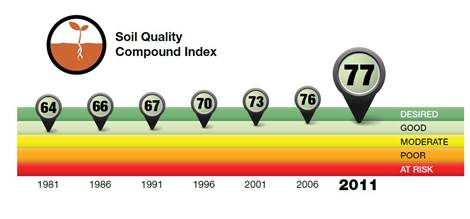
Figure 2 - description
| Year | Index Value | Status* |
|---|---|---|
| *Status: desired, good, moderate, poor, at risk | ||
| 1981 | 64 | good |
| 1986 | 66 | good |
| 1991 | 67 | good |
| 1996 | 70 | good |
| 2001 | 73 | good |
| 2006 | 76 | good |
| 2011 | 77 | good |
The index tends to aggregate and generalize trends and so should be viewed as a policy tool to give a general overview of state and trend over time.
Water Quality indicators
- While the risk of water contamination was not considered to be high on a national basis in Canada in 2011, all of the indicators showed a trend toward increasing risk between 1981 and 2011.
- The Nitrogen Indicator has deteriorated since 1981 as increases in nitrogen inputs (primarily from fertilizer and manure) have outpaced N outputs (primarily from crop removal at harvest).
- The Phosphorus Indicator has deteriorated since 1981 due to increased use of mineral fertilizers as well as a greater concentration of livestock production, which has created regional phosphorus surpluses, increasing the risk of transport to water bodies in runoff.
- The Coliforms Indicator has deteriorated since 1981 due to concentrated livestock production.
- The Pesticides Indicator has deteriorated since 1981, partly due to the shift towards reduced tillage and no-till systems which require a greater use of pesticides.
Water quality compound index
The Compound index for Water Quality is composed of the Nitrogen, Phosphorus, Coliforms and Pesticides Indicators. Considering various aspects of risks to water quality together, agriculture's environmental performance currently has a "Good" status. It does however represent an overall decline from a desired state in 1981. This overall declining performance is mirrored by the individual indicator performance indices, which moved from "Desired" status in 1981 to "Good" status in 2011, with the exception of the Phosphorus Indicator, which moved from "Desired" status to "Moderate" status. The deterioration in the index can be attributed to increased application of nutrients (nitrogen and phosphorus) as fertilizer and manure as well as an increased use of pesticides across Canada.
Figure 3: Water quality compound index
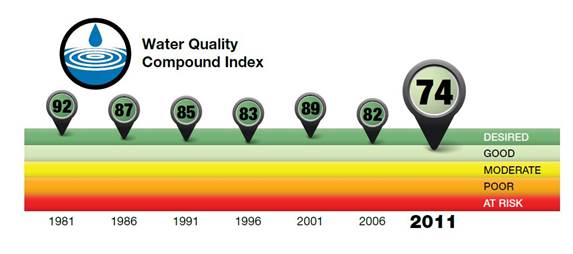
Figure 3 - description
| Year | Index Value | Status* |
|---|---|---|
| *Status: desired, good, moderate, poor, at risk | ||
| 1981 | 92 | desired |
| 1986 | 87 | desired |
| 1991 | 85 | desired |
| 1996 | 83 | desired |
| 2001 | 89 | desired |
| 2006 | 82 | desired |
| 2011 | 74 | good |
The index tends to aggregate and generalize trends and so should be viewed as a policy tool to give a general overview of state and trend over time.
Air Quality Indicators
- Overall air quality as it pertains to agriculture has been improving, although findings are mixed.
- The Agricultural Greenhouse Gas Indicator has improved since 1981 because it factors emissions (from Carbon dioxide, methane and nitrous oxide) as well as absorption by soils. Because of improvements to soils, which are now able to absorb more carbon, the net greenhouse gas emissions are lower in 2011 than in 1981.
- The Agricultural Ammonia Indicator has deteriorated since 1981 but improved since 1996. Emissions have increased due to increased nitrogen fertilizer use, but livestock related emissions have decreased.
- The Particulate Matter Indicator has seen dramatic improvements since 1981 as a result of the widespread adoption of reduced tillage and no-till, as well as decreases in the use of summerfallow in the Prairies.
Air quality compound index
The Compound index for Air Quality is composed of the Agricultural Greenhouse Gas, Agricultural Ammonia and Particulate Matter Indicators. Considering various agricultural atmospheric emissions together, agriculture's environmental performance in air quality is "Good", having been relatively stable between 1981 and 2006, and then significantly improving to 2011. This improvement is mirrored by improvements in all the individual performance indices within this theme. Improvements in land management practices such as increased adoption of conservation and no-till practices, reduced use of summerfallow, and increased forage and permanent cover crops were primarily responsible for the improved agri-environmental performance for air quality.
Figure 4: Air quality compound index

Figure 4 - description
| Year | Index Value | Status* |
|---|---|---|
| *Status: desired, good, moderate, poor, at risk | ||
| 1981 | 57 | moderate |
| 1986 | 58 | moderate |
| 1991 | 58 | moderate |
| 1996 | 54 | moderate |
| 2001 | 57 | moderate |
| 2006 | 58 | moderate |
| 2011 | 64 | good |
The index tends to aggregate and generalize trends and so should be viewed as a policy tool to give a general overview of state and trend over time.
Request a copy of the full report
Visit the Departmental Publications Service to request an electronic copy of the full report, or contact:
Departmental Publications Service
Telephone: 613-773-1444
Fax: 613-773-1498
E-mail: aafc.publications.aac@agr.gc.ca